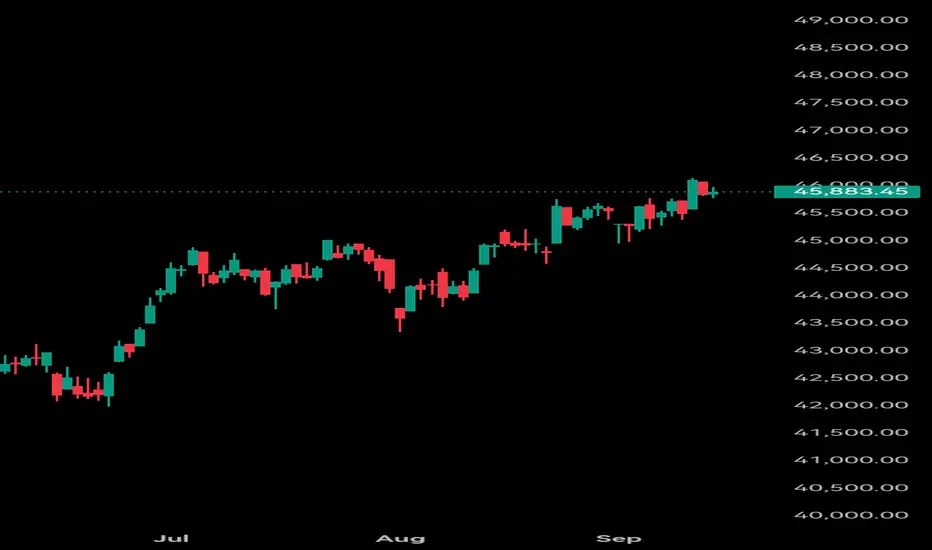
Dow Jones is back in playThe rotation from tech stocks back to the industrial sector is the main trend in late September: Dow Jones gets back in play. The price consolidates in the ascending wedge, and ready to break it to the upside as shown on the chart, with a potential target area above $48000.
The alternative scenario would be a false breakout with a continuation of a consolidation and another attempt to break it closer to PCE index publication on September 25th, 2025.
Don't forget - this is just the idea, always do your own research and never forget to manage yoru risk.
DJCUSD trade ideas

US30 LONG SETUP Price has successfully broken into a new level 46.. First test of new support was clean and now we looking for a second test as it continues with an up trend

US30_push_46 625US30_push_46 625
this was something we noticed
lets see of the push to the 50% Q4 level, .. also just above a key level of 46 500, what some might call a mid-points
what we have seen is that the TRUMP markets favours the light blue lines / 50% q4'rs
lets see; how this plays.

Dow projections after yesterday's rate cutEverything is mentioned in chart.
This is my Elliott Wave breakdown of the Wave 5 cycle rally from my last year's projections.

Most probable scenario (Rates remain unchanged)Ever since my last year's downward correction projection on Dow, the market has been steadily going upward forming our wave 5.
For past couple weeks, I have been monitoring the Expanding Triangle forming in market ever since the major RSI drop in July downward swing, which was our wave C.
22 August was the day most people like me were expecting the drop in market which would have been our Wave E, but since the GDP news pumped the market turning an ABC zigzag into an Impulse with the 5th wave being the pump upon news release, the wave D was hence prolonged and we had to wait for another 5 wave structure to complete the wave D zig-zag as shown in the image below.
Now, we can see that even though wave D has traced more than 200% of wave B, it is still a valid Triangle. The ending diagonal further strengthens this scenario to play out.
Even though this scenario's success is dependent upon the news, which is impossible to predict. The price action so far we have seen along with the GDP and other news reports suggest that even though market is highly anticipating 25 basis points cut or even 50 basis points, the likelihood of Interest rates remaining unchanged is still very high because the US economy is still strong and does not necessarily require rate cuts yet.
After this wave E, we can enter our usual end of year pump.

US30 US30 is bullish.
Trading above last week’s open.
Momentum is pushing higher highs.
US30 is showing a bullish bias, trading comfortably above last week’s open. The market is forming higher highs and higher lows, indicating strong upward momentum. Pullbacks to key levels, like the current week open, may offer good entry opportunities in line with the trend.

dowjones must goes to 46047Based on the analysis, Dow Jones has the potential to continue its upward movement from the 45,868 range. The price level of 45,809 serves as a warning zone for this decision.
If this area holds, the target could reach the peak of 46,100. CMCMARKETS:US30

U30 Trade Set Up Sep 17 2025www.tradingview.com
price is trading in between PDH/PDL but just inverted a 1h FVG so will want to see if price can continue making internal bullish structure on the 5m-15m to target PDH or continue its 1h bearish structure and target PDL. But will have to be careful due to FOMC news coming out at 2pm

US30 Technical Breakdown – 09/17/2025📍 US30 Technical Breakdown – 09/17/2025
US30 failed to hold above 46,000 and has started to drift lower, now trading around 45,720 🟥. Yesterday’s momentum stalled, and sellers are stepping in at resistance.
Price is sitting right at EMA support — this zone decides whether buyers step back in or if we see a deeper pullback.
📊 Current Market Behavior:
📉 Rejected at 46,000–46,112
🔄 Pulling back toward 45,700 support
⚡ EMA cluster acting as short-term magnet
🧱 Mid-range chop after breakout high
📌 Key Levels:
🔹 Resistance Zones:
45,930–46,000 → Rejection zone
46,112 → Breakout high
46,250 → Next bullish target
🔹 Support Zones:
45,700 → EMA + intraday support
45,456 → Strong support floor
45,320 → Key demand zone
44,988 → Deeper support
🧠 Bias:
Neutral → Bearish leaning
Below 45,700 = sellers in control
Above 46,000 = bullish continuation

US30Success in forex and stocks comes from a combination of knowledge, discipline, and patience. Understanding market trends, economic factors, and company fundamentals is crucial, but equally important is controlling emotions and sticking to a well-planned strategy. Continuous learning, adapting to changing conditions, and managing risk wisely can turn opportunities into consistent growth over time. Consistency, not luck, separates successful traders from the rest.

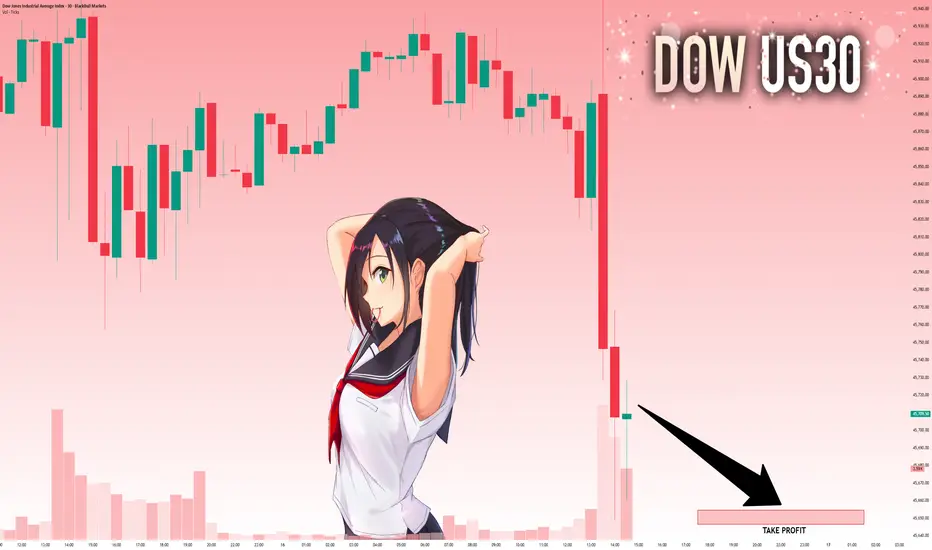
Us30i got screwed with that liquidity sweep
but now that its back into the zone i am waiting for a nice rejection candle on that support to take to the upside -
but but but - news this week lol
so first tp is shown
but depending on volume maybe re-test those highs unless another sell and im screwed.

Dow JonesAfter days of fighting at the resistance at 45800, this was broken, now this level as support we can expect new highs and continuation of the trend up to the region of 46500. Resistance that will become support

US30: Will Go Down! Short!
My dear friends,
Today we will analyse US30 together☺️
The recent price action suggests a shift in mid-term momentum. A break below the current local range around 45,713.96 will confirm the new direction downwards with the target being the next key level of 45,654.62 and a reconvened placement of a stop-loss beyond the range.
❤️Sending you lots of Love and Hugs❤️
Us30 Trade Set Up Sep 16 2025www.tradingview.com
Price is consolidating right now so i either want to see a break and close of the support key zone to trader lower to lower levels of support or a sweep of PDL, close above followed by a IFVG on the 1m-2m to trade higher to PDH

Sure, here is the English translation of the analysis for the USSure, here is the English translation of the analysis for the US30 (Dow Jones Industrial Average):
The US30, a heavyweight index composed of 30 blue-chip stocks, is a core barometer of U.S. economic health. The index is currently oscillating near all-time highs, highlighting a tug-of-war in market sentiment. Its trajectory is primarily driven by two key factors: firstly, the path of the U.S. Federal Reserve's monetary policy, where any changes in inflation data and interest rate expectations trigger significant volatility; and secondly, the corporate earnings of its constituent companies, with the performance of large-cap tech and financial stocks providing crucial support.
From a technical perspective, the 39,000-point zone is a critical watershed. Sustained trading above it could initiate a new upward leg, while a break below may lead to a deeper technical correction. Looking ahead, the index will maintain high volatility amid a tug-of-war between "soft landing" hopes and policy uncertainty. Investors must closely monitor inflation reports and Fed commentary to gauge its future direction. Caution is warranted in the short term, while the long-term trend remains dependent on the resilience of economic data.
US30 Technical Breakdown – 09/16/2025📍 US30 Technical Breakdown – 09/16/2025
US30 is hovering just under 46,000 after last week’s breakout to 46,112 🚀. Price pulled back but has since stabilized around 45,900–45,930, coiling just below resistance.
Bulls are defending higher lows, but momentum has slowed. A clean break above 46,000 could open the door for another push higher, while failure to hold could drag us back into mid-range support.
📊 Current Market Behavior:
🔄 Coiling below 46,000 resistance
📈 Higher lows holding structure
🧱 Strong support at 45,456–45,500
⚠️ Market indecision before next leg
📌 Key Levels:
🔹 Resistance Zones:
45,930–46,000 → Intraday ceiling
46,112 → Breakout high
46,250 → Next bullish target
🔹 Support Zones:
45,865 → EMA cluster zone
45,456 → Key support floor
45,320 → Mid-range demand
44,988 → Strong base
🧠 Bias:
Neutral → Bullish leaning
Above 46,000 = expansion higher
Below 45,865 = possible fade lower

US30 Liquidity Play📌 **POV – US30 Liquidity Play**
Currently looking for a **short-term long position on US30**, with the main objective of grabbing liquidity above last week’s high and the daily previous high.
This move aligns with a classic **liquidity sweep** setup – expecting price to run the highs before showing signs of exhaustion.
Once liquidity is taken, I’ll shift bias to a **bearish scenario**, looking for a clear **CHOCH/BOS confirmation** and an entry around newly-formed **FVGs** for the larger move to the downside.
For now, the bullish move is only a **liquidity play**, not a structural shift. The real interest lies in the bearish continuation after the sweep.
---
Lord Emerson

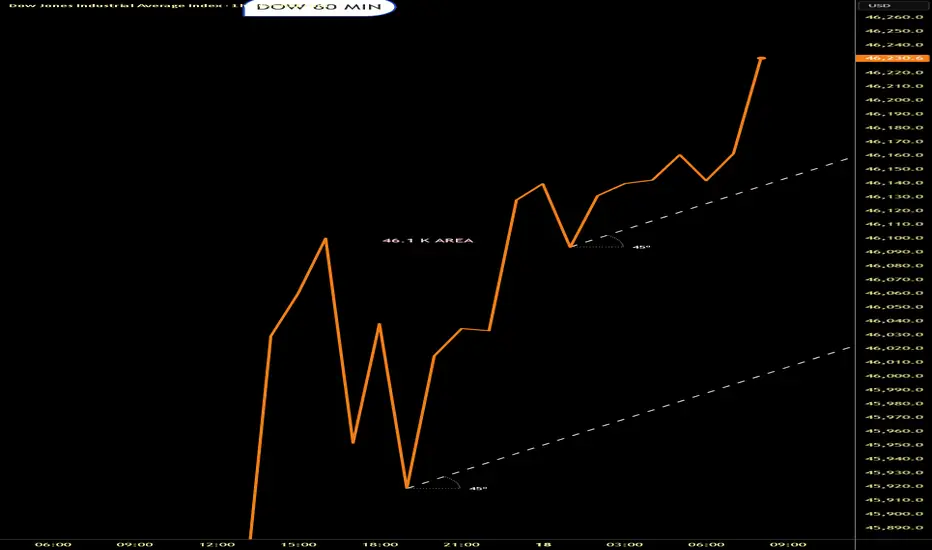
Possibility of uptrend A trend change is expected to form within the current support area and we will witness the start of an uptrend. As long as the index fluctuates above the support area, a continuation of the uptrend is likely.

Gan strategy’s In dow jones has return after determining and calculating it’s considered my angle is 90 dgree and for time angle i calculated 90 candle though. Its in square shape and maybe it completes all major angles which is 360 last one
The smal rectangle consider price / time
And the trend line is my bias which golden one is major road and red is for selling and green is for buying.
Les see

Us30 Trade Set Up Sep 15 2025www.tradingview.com
Price has swept PDL back stayed closed above, so i am overall still bullish. I would like to see price sweep internal SSL followed by a IFVG/CISD on the 1m-2m to continue higher

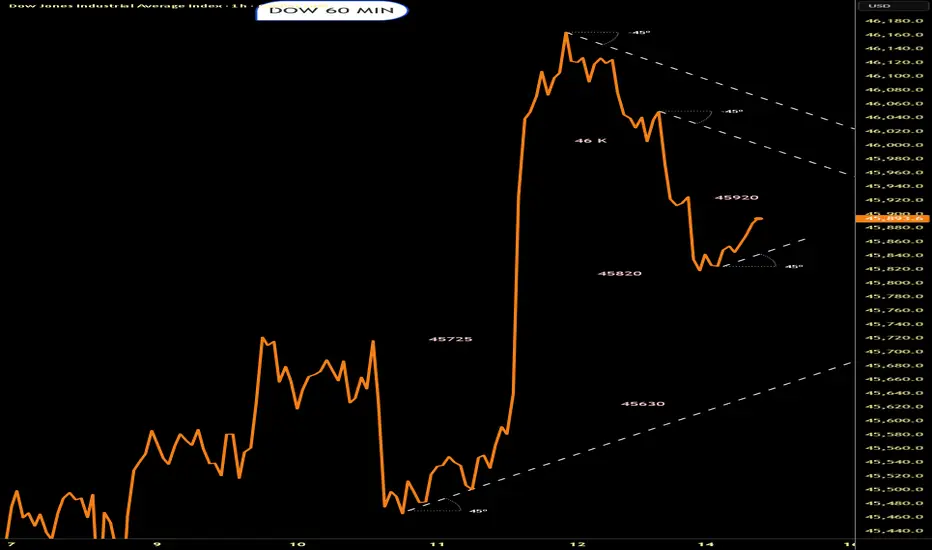
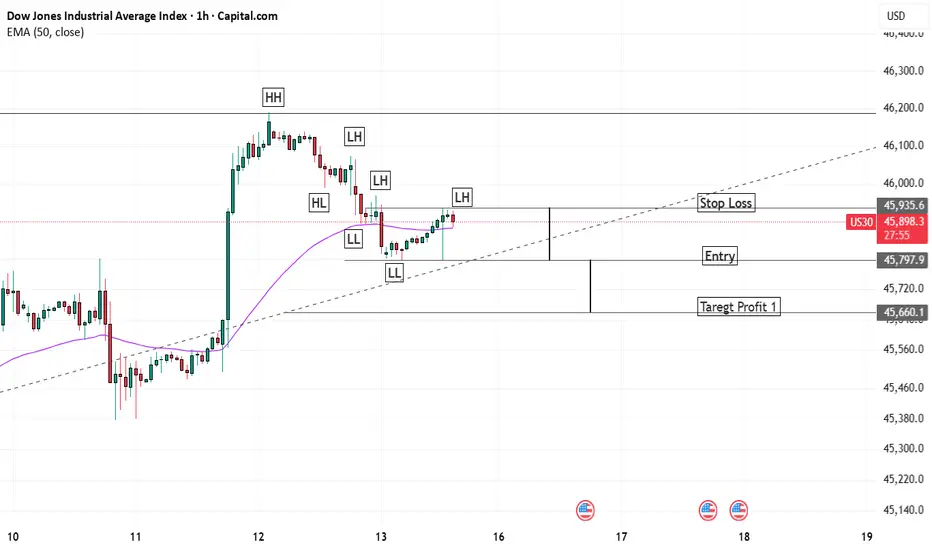
US 30 1 Hour Downward Trend Simple Dow TheoryUS 30 1 Hour Downward Trend Simple Dow Theory
LH and LL Making
Setup is Mentioned
Trade with Care
Dow not looking too happyNot looking as good as the other index.Might find some buyers.? Lets se what happens