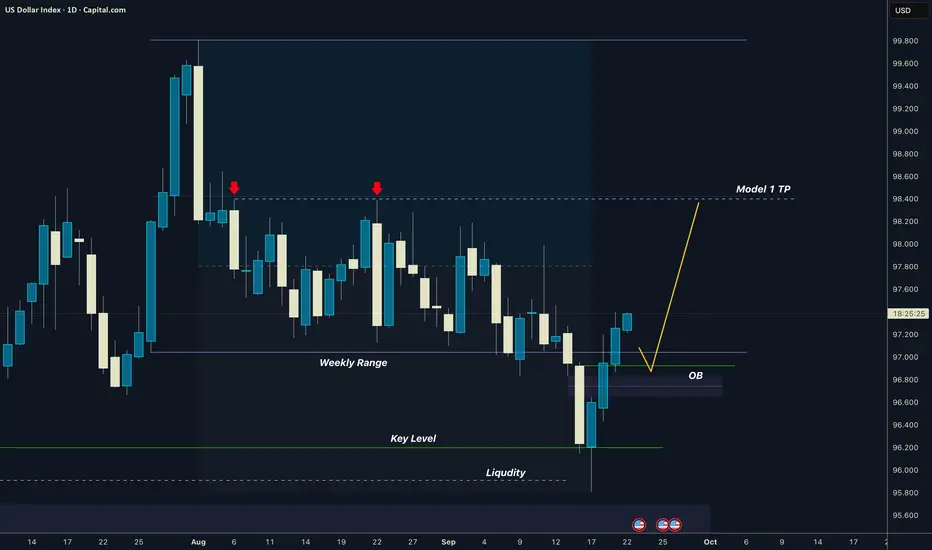
Dollar I Weekly Range I 50% Target I Model 1GM Traders, we have seen price has been accumulating thru the whole august, now it dipped bellow the range and strongly rejected and created OB. It has change to to go to 50% of that range where is doouble top liquidity which.
Have a great trading week !!
David Perk aka Dave FX Hunter
USXUSD trade ideas
DXY at a Critical Juncture — What’s the Fed’s Next MoveHey Guys,
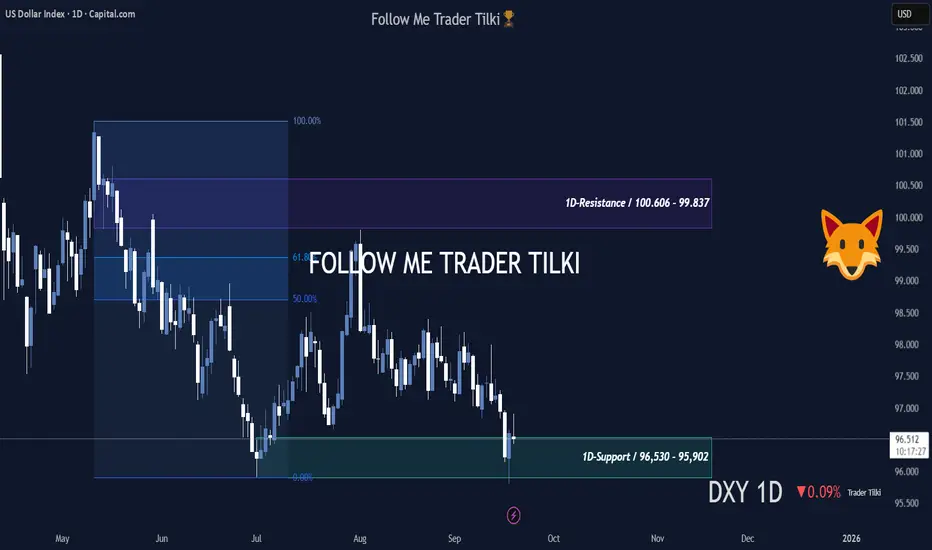
I’ve put together a swing-style analysis for the DXY.
This one’s been highly requested — my followers are valuable to me, and I never turn them down.
DXY Daily Levels:
- Resistance: 100.606 – 99.837
- Support: 96.530 – 95.902
From a fundamental perspective, the U.S. Dollar Index is currently dropping due to Fed policies.
No steps are being taken to push the dollar higher.
Because of this, investors are choosing gold as a safe haven instead of buying dollars.
Gold keeps hitting new ATHs, and naturally, the dollar index is sliding.
Unless the Fed takes action to support the dollar, this decline will continue.
In short, the drop in the dollar is entirely due to the policies implemented by the Fed Chair.
Remember — DXY isn’t heavily influenced by technical analysis; it’s driven by Fed policy.
That said, since the index has fallen so much, I believe we might see some steps taken in the coming months to lift the dollar.
I’ll be sharing updates right here.📢
Once support or resistance levels are broken, I’ll post new insights immediately.
Every like from you is my biggest motivation to keep sharing these analyses.
Thanks to all my friends who support me — you’re the best. ❤️
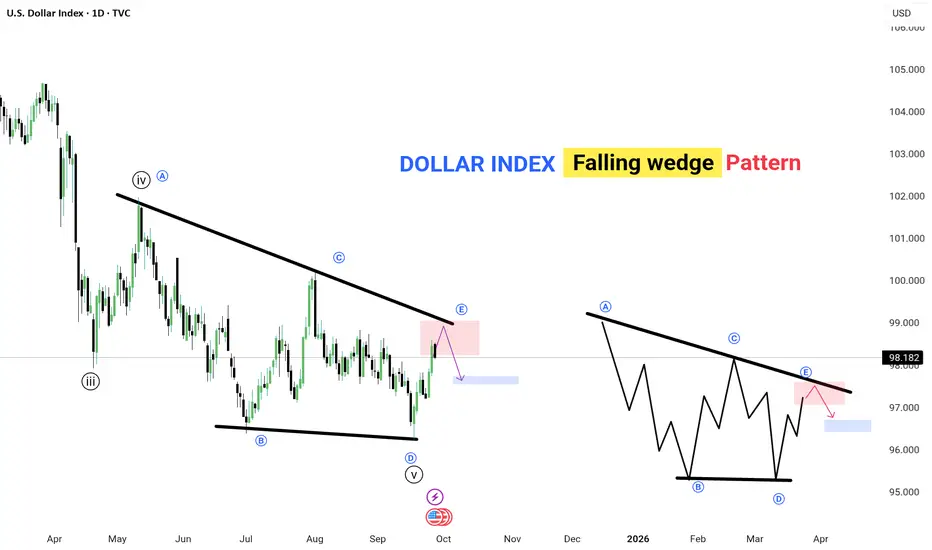
DOLLAR INDEX – Falling Wedge Pattern📉 The Dollar Index is forming a falling wedge, a classic reversal pattern.
🔹 Price is approaching the upper trendline resistance (point E).
🔹 Expect a potential pullback toward the support zone (highlighted in blue).
🔹 Pattern repeats: After E, a corrective dip is likely before the next move.
✅ Key Points:
Falling wedge usually signals trend reversal or continuation.
Watch for breakout confirmation above resistance for bullish continuation.
Current focus: resistance zone near 98–98.2, then potential drop to 96–97 support.
💡 Lesson: Patience pays — wait for clear rejection or breakout before trading this setup.
---
DXY (US Dollar Index) 2H chart.DXY (US Dollar Index) 2H chart, you can see my drawn a breakout setup with targets marked.
Here’s the breakdown:
Current price: ~97.42
Trendline breakout setup is shown, with bullish continuation in mind.
First target point is marked around 98.00
Second target point is marked around 98.60
✅ So the bullish targets are:
TP1: 98.00
TP2: 98.60

DXY LOCAL LONG|
✅DXY is going down to retest
A horizontal support around 97.200
Which makes me locally bullish biased
And I think that we will see a rebound
And a move up from the level
Towards the target above at 97.440
LONG🚀
✅Like and subscribe to never miss a new idea!✅

DXY ( Doller Index ) I expect to see the dollar index begin to rise from these areas. The wave will take months, perhaps even two years, to reach the upward target

DXY outlook from 29th sept to 3rd oct 2025The DXY has shown signs of longs even when the FED cut rates. the last quarter may actually be bullish for the US dollar.
it has been forming large buy candles on the daily timeframe in the previous week. this may not be a sign that we are bullish but also the market has failed to close below the FVG on the weekly time frame from July ever since it traded into it.

U.S. Dollar Index (DXY) – Bullish Pullback & Long Setup (2H Char1. Price Action & Structure
The chart shows a bullish channel (red shaded area) where price has been making higher highs and higher lows since around September 18.
Price recently reached the upper trendline of the channel and is now pulling back toward the middle/lower zone.
2. Key Levels
Support Zone: Around 97.575 – 97.257 (blue labels).
This is where the chart suggests a potential buy/long entry.
The gray box marks the area where price is expected to reverse to the upside.
Stop-Loss Level: Slightly below 97.257, around 97.238 (red level).
If price breaks below this, it would invalidate the bullish setup.
Target Point: 98.799 – 98.805
This is the projected move upward, shown with the big arrow.
3. Expected Scenario
The zigzag line indicates that price may dip into the support zone, consolidate, and then bounce back up strongly toward the target point.
This is a long (buy) trade setup with a favorable risk-to-reward ratio since the potential reward is much bigger than the stop loss risk.
4. Risk–Reward Ratio
Risk (downside): Around 0.3 points (from 97.575 entry to 97.238 stop).
Reward (upside): Around 1.2 points (from 97.575 entry to 98.799 target).
That’s roughly 4:1 R:R — a very good trade setup if price respects the support zone.
Summary
✅ Bullish Bias – Price is in an uptrend channel.
📉 Buy Zone: 97.575 – 97.257
📊 Target: 98.799 – 98.805
🛑 Stop Loss: Below 97.238
🎯 Expectation: Short-term dip followed by a strong bullish rally.

$DXY longsFor next week I’ll be focusing on dollar longs since we got a 4H swing trend BOS and a lot of descending highs left open.
Favoring positions on #EURUSD and #GBPUSD.
Will keep you updated. #FOREX

dxy sep 23
if bos and other key statistic of mine failed to hold and probably price will hammered down. During Ny session expeccting consolidation espacially in xausd.

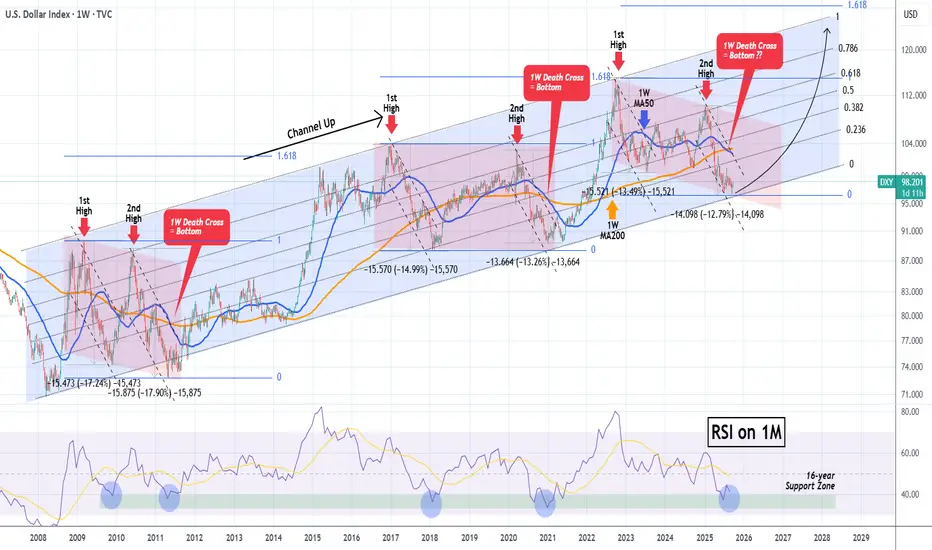
DXY Is it finally time for the Dollar to shine?The U.S. Dollar index (DXY) has been trading within a Channel Up since the March 2008 bottom during the U.S. Housing Crisis. This pattern has been showing incredible symmetry, having clear correction phases (red Channels) followed by bullish phases, where the price rallied to the 1.618 Fibonacci extension.
Right now the price has almost hit the bottom of this multi-year Channel Up, while at the same time making a new (2nd) bottom for the 2nd Bearish Leg of the (red) correction phase.
With the 1M RSI having already touched its 16-year Support Zone, which has provided the most optimal Buy Signals throughout this pattern, we expect the Dollar Index to start rising aggressively in the long-term, targeting at lest 120.000 on its way to the 1.618 Fib ext.
-------------------------------------------------------------------------------
** Please LIKE 👍, FOLLOW ✅, SHARE 🙌 and COMMENT ✍ if you enjoy this idea! Also share your ideas and charts in the comments section below! This is best way to keep it relevant, support us, keep the content here free and allow the idea to reach as many people as possible. **
-------------------------------------------------------------------------------
💸💸💸💸💸💸
👇 👇 👇 👇 👇 👇
DXYDXY Bearish Outlook
COT positioning confirms sellers are in control, showing bearish sentiment.
Market structure also points lower with lower highs and lower lows.
As long as this structure holds, bias remains bearish.

GBPUSD 4hr Long SetupGBPUSD 4hr Long Setup with DXY confirmation potential swing set up to hold if we see dxy holding the highs without recovering furhter.

DXY--Big picture--To see the big picture I analysed the instrument in 3M time period
--I will add a seperate lower time frame chart

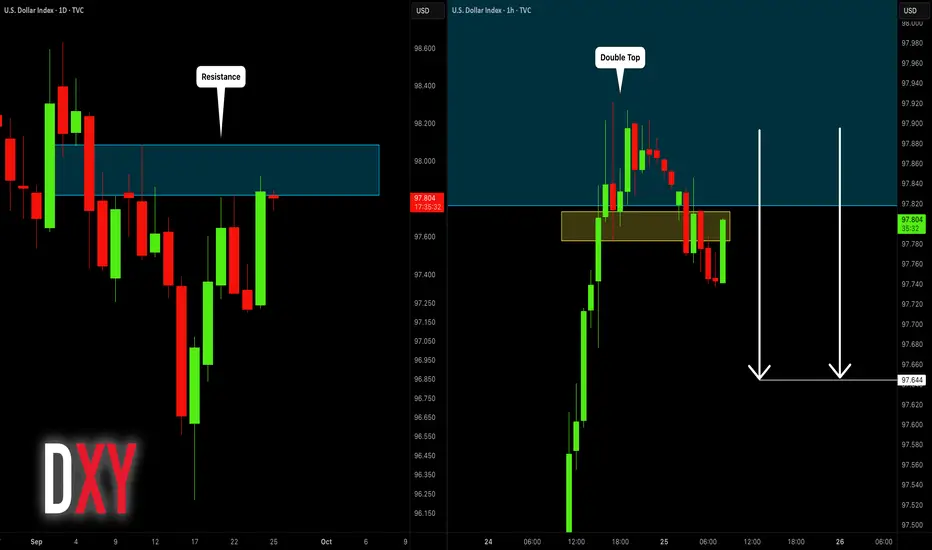
DOLLAR INDEX (DXY): Overbought Market & Pullback
Dollar Index is testing a major daily resistance cluster now.
With a high probability, the market will retrace from that.
A double top pattern that was formed on an hourly time frame
indicates a clear overbought state.
The index may drop to 97.65
❤️Please, support my work with like, thank you!❤️
I am part of Trade Nation's Influencer program and receive a monthly fee for using their TradingView charts in my analysis.
US Dollar: Hold Off On Selling The USD! Higher Prices Ahead?Welcome back to the Weekly Forex Forecast for the week of Sept 22 - 26th.
In this video, we will analyze the following FX market: USD Dollar
The USD recovered last Friday after the FED cut the rate .25 basis points. The USD was also supported by higher T-note yields.
What's next?
Although price swept the Swing Low last week, it recovered, trading back up into the consolidation. There is a bullish tone to this movement, and a manipulative one as well. The sell side LQ was taken, followed by a quick recovery.
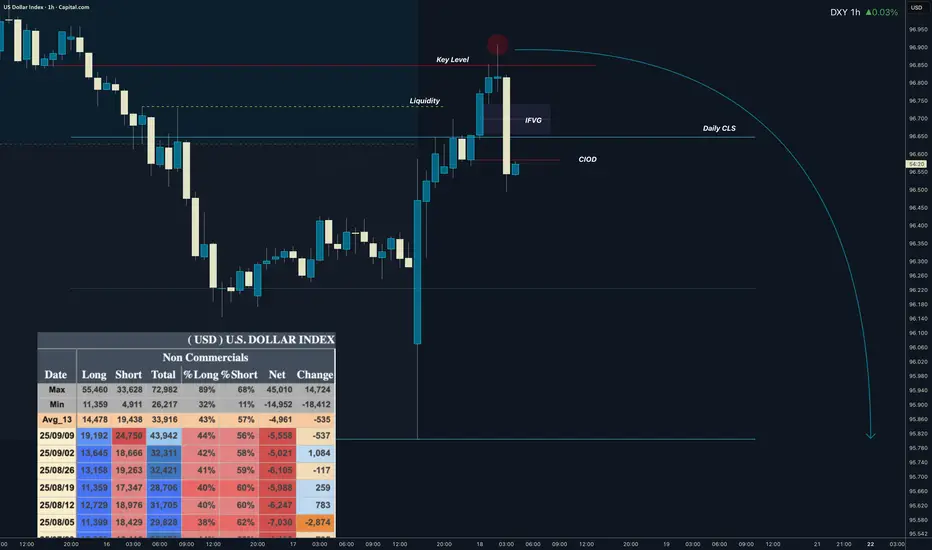
The highlighted bullish FVG indicates bullish order flow.
There is a potential iFVG just above the +FVG. Monitor it to see if price will respect it as support. Should it hold, look to long the USD.
Wait and react. Do not predict.
Enjoy!
May profits be upon you.
Leave any questions or comments in the comment section.
I appreciate any feedback from my viewers!
Disclaimer:
I do not provide personal investment advice and I am not a qualified licensed investment advisor.
All information found here, including any ideas, opinions, views, predictions, forecasts, commentaries, suggestions, expressed or implied herein, are for informational, entertainment or educational purposes only and should not be construed as personal investment advice. While the information provided is believed to be accurate, it may include errors or inaccuracies.
I will not and cannot be held liable for any actions you take as a result of anything you read here.
Conduct your own due diligence, or consult a licensed financial advisor or broker before making any and all investment decisions. Any investments, trades, speculations, or decisions made on the basis of any information found on this channel, expressed or implied herein, are committed at your own risk, financial or otherwise.

USD Sell the Rumor, Buy the NewsUSD set a fresh three-year low on the Fed's rate cut announcement last week. Since then, however, bears have taken a back seat and bulls have chewed through several short-term resistance levels. This highlights just how one-sided that move was in the earlier part of the year and for q3, it's been a build into a falling wedge formation which is often approached with aim of bullish reversal.
This sets the stage for a test of the 99 level, which is confluent with both a 61.8% Fibonacci retracement of the 2021-2022 major move - and the resistance side of that formation.
Notably, this resembles last year's move, when the USD set a fresh low on the Fed's first rate cut announcement of the year only for bears to be stalled thereafter. It wasn't until Q4 that USD bulls were able to take over but when they were - they drove an aggressive move into the end of the year.
In that scenario, there was also a similar move in Treasury yields as rates jumped even as the Fed was cutting overnight rates - and the rationale behind that was that a Fed cutting into a high inflation backdrop simply boosted long-run inflation expectations, which further erodes fixed yields. That can drive capital from bonds and possibly even into stocks, but more importantly for traders, that's what helped to boost the Greenback in Q4 of last year even as the Fed was cutting. - js

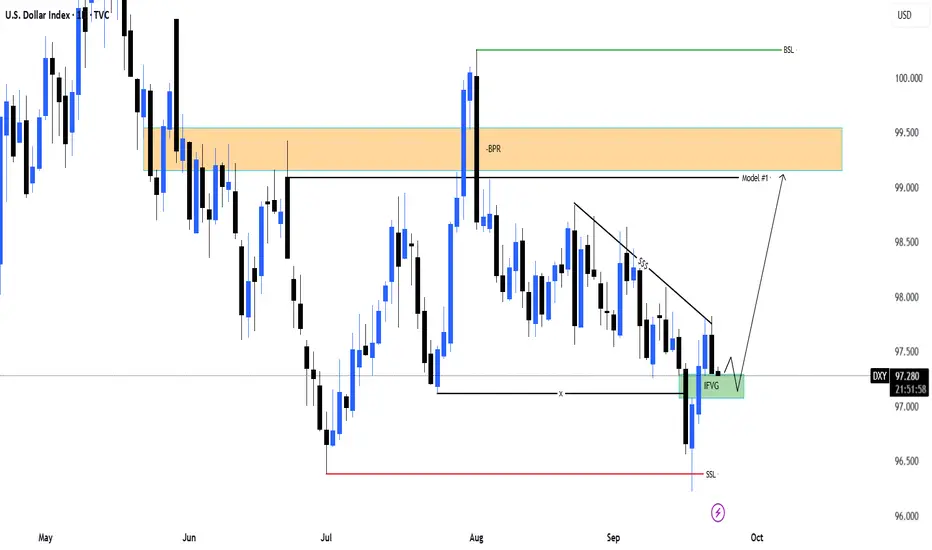
DXY | Bullish Reversal from IFVG – Targeting 99.50 Supply ZoneHello Billionaires!!
In DXY D1 Projection we know The US Dollar Index has tapped into the Imbalance/Fair Value Gap (IFVG) and shown signs of bullish reaction after sweeping Sell-Side Liquidity (SSL). This aligns with a potential reversal model aiming towards higher liquidity levels.
🔹 Key Points:
SSL swept, confirming liquidity grab.
Price reacting from IFVG as demand zone.
Short-term retracement expected, followed by continuation.
Targeting the BPR supply zone around 99.50 and eventually Buy-Side Liquidity (BSL) above 100.00.
As long as DXY holds above the IFVG zone, bullish continuation remains the primary outlook.
Dollar Index Holds Firm on Fed CautionFundamental approach:
- DXY edged higher this week amid firmer US data and cautious Fed rhetoric that tempered aggressive easing bets. Risk sentiment was mixed, with markets awaiting core PCE for policy cues, supporting the dollar on rate differentials and data resilience.
- Stronger jobless claims and an upgraded Q2 GDP print underpinned the greenback, while Fed speakers highlighted divisions over the pace of additional cuts, limiting the index's downside.
- DXY could stabilize or firm if core PCE surprises, while a soft print may rekindle cut expectations and weigh on the dollar.
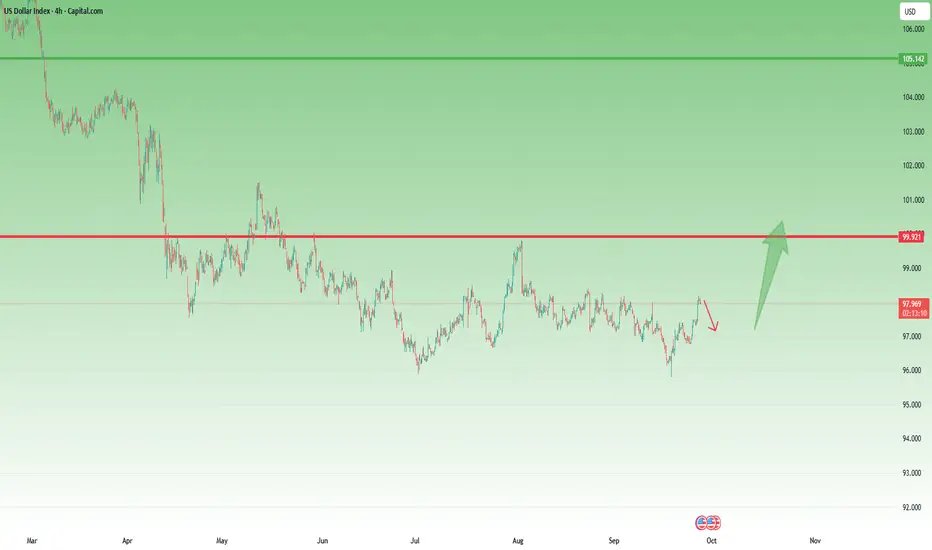
Technical approach:
- DXY broke the descending trendline and retested the key resistance at around 98.60. The index is around EMA21, and it is awaiting an apparent breakout to determine the upcoming trend.
- If DXY breaks above EMA21 and key resistance at 98.60, the index may retest the following resistance at 100.
- On the contrary, failing to close above 98.60 may lead the index to retest EMA78 or the following support at around 97.15.
Analysis by: Dat Tong, Senior Financial Markets Strategist at Exness

DXY – Reversal in Motion, Correction Next?In my previous DXY analysis, I highlighted that all the bad news might already be priced in for the USD, opening the door for a reversal.
That scenario is now unfolding: after making new dips, the index bounced strongly from the 95 zone and is currently trading around 98.
After such a sharp rebound, the market looks ready for a correction. This pullback phase could provide traders with attractive opportunities – especially to position short on the major USD pairs, but at better, higher prices.
Trading Plan:
• The reversal has confirmed, but I expect a correction before continuation.
• I’m looking for retracements to offer entry levels for USD shorts via majors.
• As always, flexibility is key – monitor price action closely to time entries correctly.
The market has started to shift – now it’s about waiting for the correction to align risk and reward properly. 🚀
USDX: demand zone holds but downside pressure remainsThe US dollar index remains under pressure, trading within a descending channel. The recent bounce from the support zone around 96.30–96.90 stalled at the EMAs and the supply zone near 98.30–98.60, where sellers reappeared. On the 4H chart, price has failed to sustain above 97.80, keeping the bearish scenario in play.
It is also important to note that the index is trading below the 200 EMA, reinforcing the bearish bias and signaling that sustainable recovery is less likely without strong fundamental catalysts.
If 96.90 breaks, the next downside target is 96.30, followed by 95.40. Stronger bearish momentum could even push the index toward 94.00, signaling further dollar weakness. For now, 96.30 acts as the key support barrier.
From a fundamental perspective, the dollar index remains weighed down by expectations of a dovish Fed and lower yields. Any hawkish surprise from Fed officials could lift price back toward 98.50, but the structure still favors bearish continuation.
This is exactly the kind of situation where market expectations diverge from reality, and the longer it lasts the more it feels like a trend reversal is near. But as always, emotions must be set aside — we wait for clear signals, not illusions.

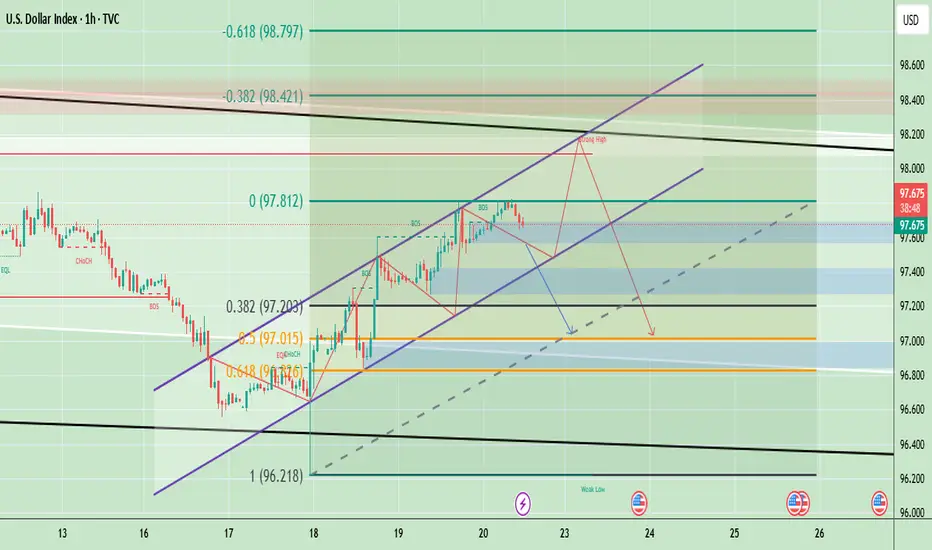
Dollar Index Resistance & Support AnalysisDXY (U.S. Dollar Index) is trading around 97.71, holding within an upward channel after bouncing from the 97.00–97.10 support zone. The structure shows a series of higher highs and higher lows, indicating short-term bullish momentum. However, the chart also highlights a potential “strong high” area near 98.20–98.40, where resistance from both Fibonacci retracement levels and channel tops converge. If DXY fails to break above this resistance, a retracement toward 97.20–97.00 is likely, with further downside risk toward 96.80 if that support breaks.
Based on the current setup, short-term upside toward 98.20–98.40 is possible, but overall bias suggests a likely pullback (downside) after testing resistance, especially if momentum weakens near the channel top.
🔴 Sell Zone (Short Setup)
- Sell Zone (Resistance area): 98.20 – 98.40
- Sell Trigger: If price tests and rejects this zone with bearish candles (reversal signals).
🟢 Buy Zone (Long Setup)
- Buy Zone (Support area): 97.20 – 97.30
- Buy Trigger: If price holds above this zone and shows bullish reversal candles (hammer, engulfing, etc.).
Note
Please risk management in trading is a Key so use your money accordingly. If you like the idea then please like and boost. Thank you and Good Luck!
Dollar - Daily Range I Liqudity I Key Level - ShortDollar has reached key level after whipsaw move on FOMC. It also grabbed liqudity and COT is still bearish while HTF Key Level on lower prices. Hence I think new low is in play.
Trading is like a sport. If you consistently practice you can learn it.
“Adapt what is useful. Reject whats useless and add whats is specifically yours.”
David Perk aka Dave FX Hunter
💬 Don't hesitate to ask any questions or share your opinions