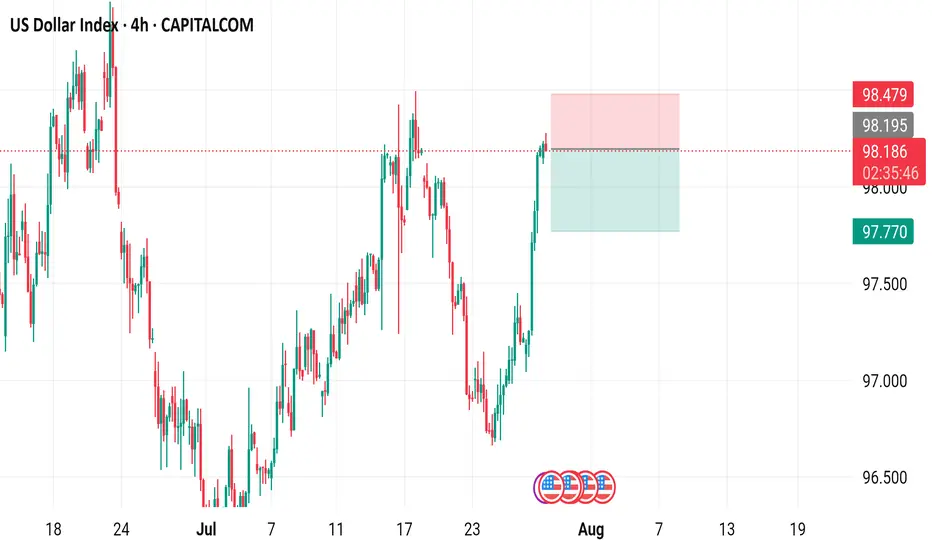
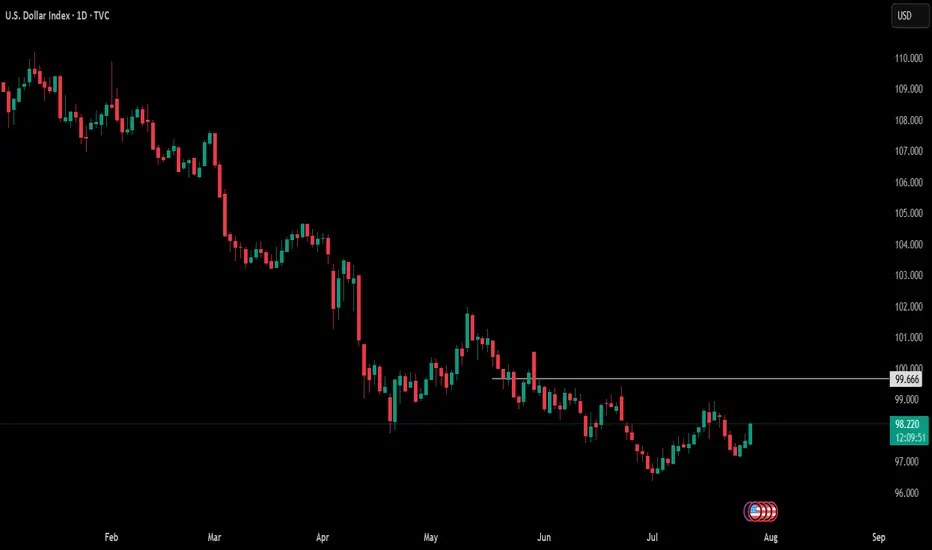
US Dollar Index (DXY) - 4 Hour Chart4-hour chart from CAPITALCOM displays the recent performance of the US Dollar Index (DXY), showing a current value of 98.190 with a slight decline of 0.009 (-0.01%). The chart highlights key price levels, including a recent sell signal at 98.189 and a buy signal at 98.243, with a resistance zone marked between 98.195 and 98.479. The index has experienced fluctuations, with notable drops and recoveries, and is currently trending near the 98.190 level as of July 29, 2025.
USXUSD trade ideas
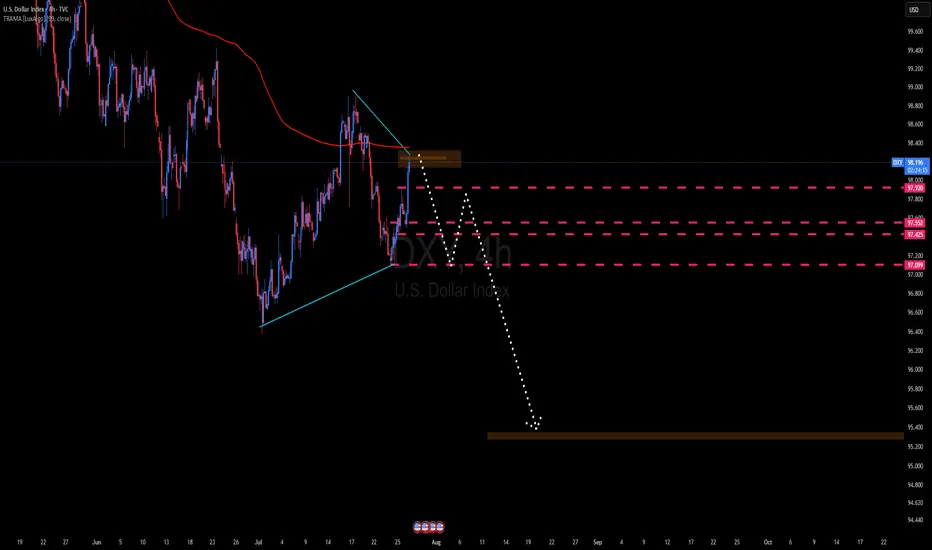
IS A HIGHER LOW SECURED ON THE DXY? LET'S FIND OUTIn this weekend analysis, I am still paying attention to the higher time frame downtrend on the dollar index while acknowledging the higher low support on the daily chart forming an inverse Head and Shoulders pattern. On the 4H and lower timeframes we have a strong ceiling made up of the 200SMA and 50SMA resistance level and need to break through from the 20SMA Line in the sand support. This weeks trade plan and thesis is for price to hold above the 20 SMA on the 4H timeframe expecting a potential dip to the zone of 97.128 (liquidity zone) and then bounce up to a weekly target of 97.7. This Thesis is INVALIDATED if a candle opens and closes below 97.015. I wish everyone a great trading week. Thank for supporting my publications and trade ideas. Cheers!!!

DXY LOCAL SHORT|
✅DXY is going up now
But a strong resistance level is ahead at 98.948
Thus I am expecting a pullback
And a move down towards the target of 98.451
SHORT🔥
✅Like and subscribe to never miss a new idea!✅
Disclosure: I am part of Trade Nation's Influencer program and receive a monthly fee for using their TradingView charts in my analysis.


DXY dont take these charts serious its just my way to keep myself entertained while finding levels etc.. no your usual boring systematic shiiiteee!! IRISH CRAIC ONLY!!! ☘

USD Rallies into a Major Week - Fed, PCE, NFP on the WayReversals of long-term moves can be tough to work with, especially for shorter-term traders.
While fundamentals are important for shaping future price moves and technicals are key for explaining past moves, while also allowing for strategy and risk management, it's sentiment and positioning that probably matter more.
Because if any and everyone in the world that wants to be long already is, well it doesn't matter how positive the news is if there's simply nobody left to buy. And if there's no influx of fresh demand, and only incoming supply, well, then price can drop, even on good news. And at that point, a heavy one-sided market will take notice of falling prices even in the face of good news, when price should be going up, and they'll be disconcerted to hold long positions, which can lead to even more supply, more selling, and in-turn, lower prices.
As the old saying goes, if a market doesn't rally on good news, well then look out below.
This shows in various ways on varying time frames in numerous markets but from a longer-term perspective, that shifting trend is akin to turning a cruise ship in the middle of the ocean - it's not going to happen suddenly. It takes time, it takes shifting, and it takes the slow grind of late-to-the-trend bulls turning into ahead-of-the-curve sellers.
This is what allows for the build of wedges, just as I had looked at earlier in the month in both USD and EUR/USD. Bulls suddenly get shy as prices approaches highs, although they remain aggressive on pullbacks and tests of support. This leads to a weaker trendline atop the move and, eventually, unless buyers get motivated to punch up to higher-highs with a new breakout, that motive for profit taking can soon take over.
In the USD, the sell-off in the first half of this year was a grinding matter, and the polar opposite of the trend that had held in DXY as we came into 2025. But, now the question is whether resilient US data leads to profit taking from bears and as we saw again last week, sellers have been showing lacking motivation at tests of lows or around support.
The big question for this week is whether we see that shift take-hold on a larger basis. We've seen sellers getting shy around lows, but are buyers ready to punch up to fresh highs in the USD? There's certainly ample potential for motivation as given the economic calendar with FOMC, Core PCE and NFP in the final three days of this week. - js
DXY: USD Flexes Muscle - Pairs SlideFriday, July 25, 2025
The foreign exchange markets are experiencing a pronounced USD bullish session this morning, with the US Dollar Index (DXY) showing robust gains of +0.35% while simultaneously pressuring all major currency pairs into negative territory. The Japanese Yen (JPY) is bearing the brunt of this dollar strength, currently registering losses between -0.4% to -0.66% across JPY pairs. This market behavior suggests traders should pay particularly close attention to DXY dynamics, as its movements will likely dictate price action across all major currency pairs in today's session.
Technical Perspective: DXY at Critical Inflection Point
A detailed examination of the Dollar Index reveals several compelling technical factors that market participants should consider:
1. Weekly Demand Zone Reaction
- The DXY has demonstrated a strong rejection from a significant weekly demand area
- The subsequent bullish spike indicates potential continuation of upward momentum
- This price action suggests institutional buyers are defending this key level
2. Commitment of Traders (COT) Report Insights
Non-commercial traders (typically hedge funds and speculators) have increased their positions from a bottom level not seen since June 2021 meanwhile the Commercial traders (often corporations hedging FX exposure) show opposing extreme positioning. This stark divergence between trader categories often precedes significant market moves
3. Seasonal Patterns Favor USD Strength
- Historical seasonal analysis indicates the current period typically supports dollar appreciation
- The combination of technical and seasonal factors creates a potentially powerful bullish setup
✅ Please share your thoughts about DXY in the comments section below and HIT LIKE if you appreciate my analysis. Don't forget to FOLLOW ME; you will help us a lot with this small contribution.

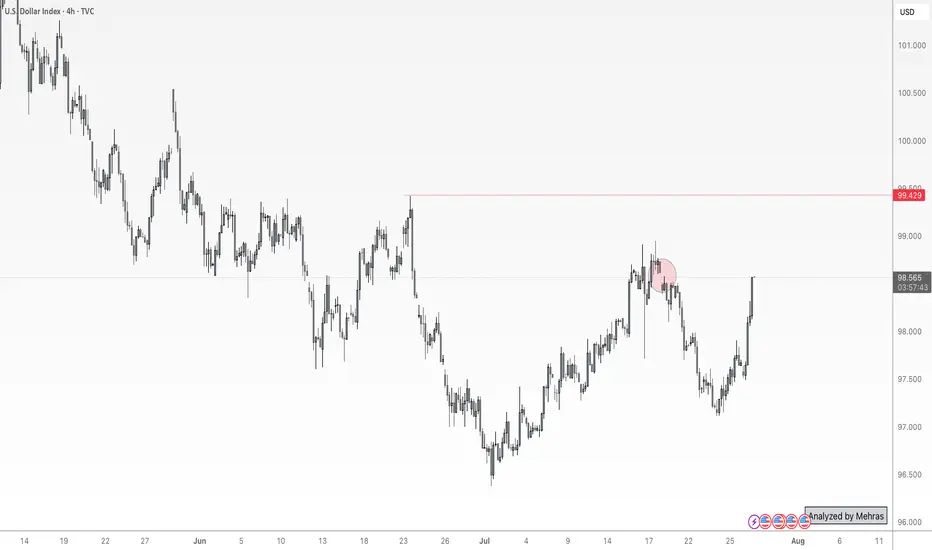
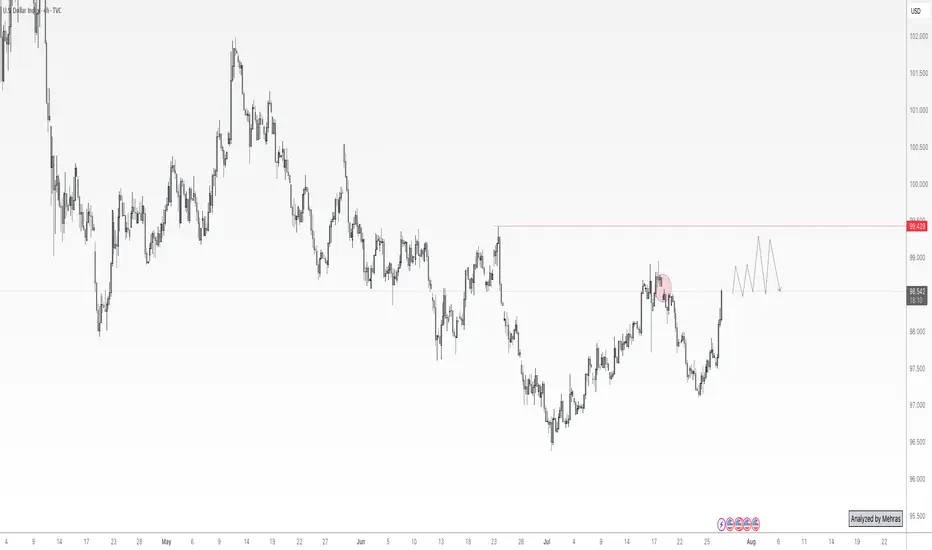
DXY at Its Most Critical Level of 2025 — Will the 100 Bank LevelThe Dollar Index (DXY), just like several other majors, is approaching a very important level. We’re now near the 100 mark, which is not only a psychological level — but also a key institutional (bank) level.
There’s also a gap zone left behind that price is about to fill. I believe the index will stay in a range over the next 1–2 days as it waits for critical data later this week — especially Wednesday’s announcements and Friday’s NFP report, which could set the tone for what’s next.
Based on current market sentiment, Trump’s remarks, Powell’s upcoming speech, and broader macro factors, I believe DXY has the potential to break above 100 and move toward 102–104, if that level is broken cleanly.
Let’s also not forget — price bounced from a monthly demand block near 96, and we’re seeing weak support across majors like EUR and Gold. That adds confluence for potential dollar strength.
📌 What do you think — is dollar strength just around the corner?
🔁 This analysis will be updated whenever necessary.
Disclaimer: This is not financial advice. Just my personal opinion.
Dollar us dxyI think the US dollar will fall sharply, causing a sharp rise in gold. There will probably be a bigger fall than in 2008 in the global economy, especially in the US.

Dyx us dollar I think the US dollar will fall sharply, causing a sharp rise in gold. There will probably be a bigger fall than in 2008 in the global economy, especially in the US.

DXY at Its Most Critical Level of 2025 — Will the 100 Bank LevelThe Dollar Index (DXY), just like several other majors, is approaching a very important level. We’re now near the 100 mark, which is not only a psychological level — but also a key institutional (bank) level.
There’s also a gap zone left behind that price is about to fill. I believe the index will stay in a range over the next 1–2 days as it waits for critical data later this week — especially Wednesday’s announcements and Friday’s NFP report, which could set the tone for what’s next.
Based on current market sentiment, Trump’s remarks, Powell’s upcoming speech, and broader macro factors, I believe DXY has the potential to break above 100 and move toward 102–104, if that level is broken cleanly.
Let’s also not forget — price bounced from a monthly demand block near 96, and we’re seeing weak support across majors like EUR and Gold. That adds confluence for potential dollar strength.
📌 What do you think — is dollar strength just around the corner?
🔁 This analysis will be updated whenever necessary.
Disclaimer: This is not financial advice. Just my personal opinion.
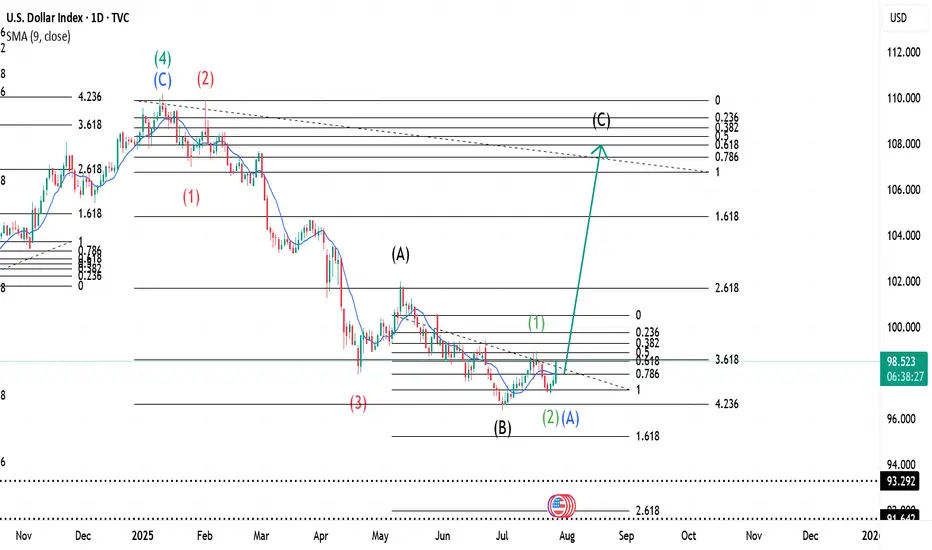
$ INDEX ~ Real Time Elliott Wave UpdatesThis is an update of a $ index chart I had previously posted. We see a Wave 1(Green) completed and a dip occurring. This dip is marked as Wave 2(Green) or Wave A(Blue). It has two readings because it could be a Zigzag, hence 2 or an A of a Flat, hence A. I will offer updates as the wave unfolds. All other analysis remains the same as I had previously posted and can be checked for references. Sentiment still remains buy.
DXY bullishDXY is in the early stage of a bull market, so no one want dollars but in my view but the trend is your friend.
This could be a impulsive 5 of 5 or a B of ABC but both are bullish, another view is that the EURO have been a bad day when the US and EU reach tariff agreement??
The lagging indicators are changing or I hope, but this bullish trend for the Dollar could continue for weeks...

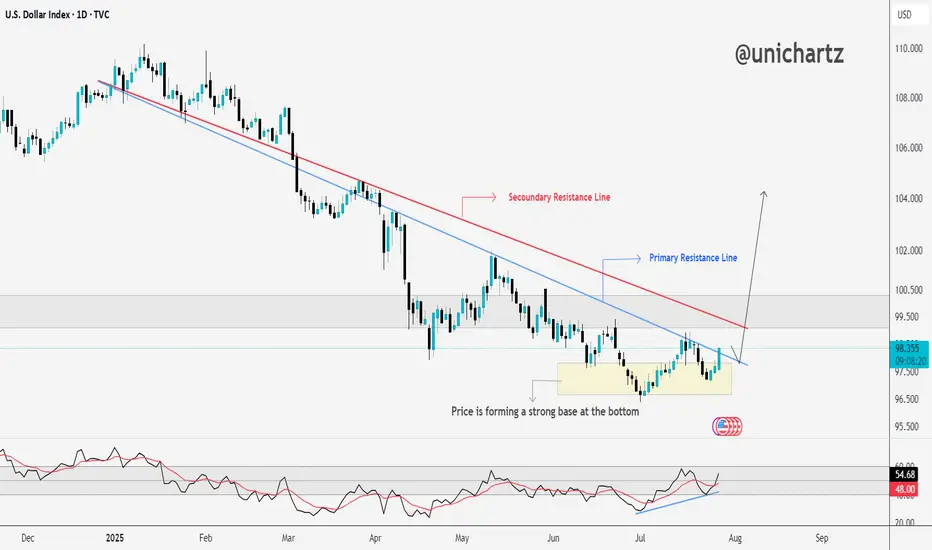
DXY Approaching Key Resistance — Trend Reversal Ahead?The DXY is forming a strong base at the bottom, showing clear signs of accumulation after a long downtrend.
Price has started pushing upward and is now approaching the secondary resistance line. A breakout here could open the path toward the primary resistance zone, which has capped rallies in the past.
The RSI is also trending higher, supporting this potential move.
If bulls clear the red resistance line, momentum could accelerate quickly.
DYOR, NFA
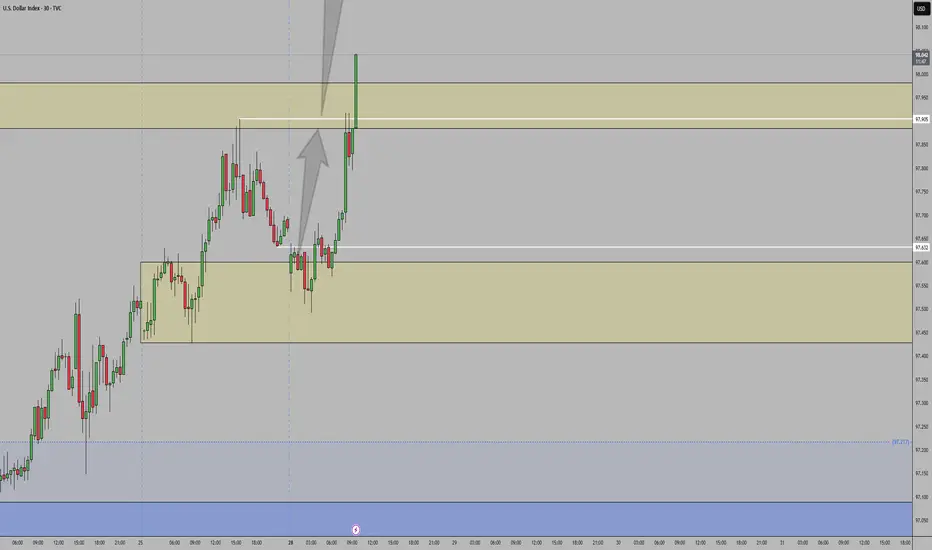
DXY - trade - market structure DXY - trade - market structure , easy setup, clean setup , good probability, if this happen is a big win, use risk and trade managment
Analysis on the DXY – EURUSD RelationshipHello traders,
Here’s an analysis that can be useful for both short-term and swing trades on EURUSD and DXY. Our trading team’s calculations are as follows:
Analysis on the DXY – EURUSD Relationship
Currently, DXY is at 98.200. Historical statistical data indicate that if DXY declines toward 96.300, there is approximately a **1.55% probability of an upward move** in EURUSD.
Based on this scenario:
Current EURUSD level: 1.16500
Projected target level:1.1830
While the correlation data show a strong inverse relationship, it’s important to note that periodic deviations can occur in the market. Therefore, this analysis should be considered a statistical projection only, not a guaranteed outcome.

DXY - ABC Move still in playDXY has been moving not so much on technical factors lately but more so with what Mr. Trump says, we still could see a move lower with an ABC pattern.
Good Luck

DXYDXY Bullish COT Setup
Commercials: Net-long ~3,988 → smart money positioning for strength
Large Specs: Net-short ~3,451 → bearish bias, potential squeeze risk
COT Index: 94.5% → near historical extreme, signaling possible trend shift
Key Events That Could Shape the Dollar This Week🇺🇸 Key Events That Could Shape the Dollar This Week
Three major catalysts are on the radar for USD traders:
📊 ADP Employment Report
💰 Advance GDP (Q2)
🧠 Fed Chair Powell’s Speech
Additionally, ongoing trade developments with the EU may add to volatility.
📊 1. ADP Employment Report
The July ADP report is forecast to show 82K job additions. While this may seem consistent with recent NFP strength, several red flags suggest growing labor market weakness:
Decline in labor force participation
Slowing wage growth
Emerging contraction signals in the services sector
Even if ADP meets expectations, it may not reflect broad-based labor market health. Historically, ADP and NFP have often diverged—so the market reaction may be muted unless the data surprises meaningfully.
💰 2. Advance GDP (Q2)
Q2 GDP is expected to show modest growth, possibly supported by:
Higher tariff revenues boosting government income
A weaker dollar improving export competitiveness
Reduced imports due to elevated import costs
However, much of this growth is likely nominal rather than real. With inflation remaining sticky, headline GDP may be inflated by price effects rather than true economic expansion. Real GDP could remain flat or weak.
🧠 3. Fed Chair Powell’s Speech
This is arguably the most market-sensitive event of the week.
Goldman Sachs and other major banks believe the recent resilience in U.S. data lowers the chances of a rate cut at this meeting. However, political dynamics could add nuance:
With Donald Trump actively campaigning—and reportedly pressuring the Fed to ease rates to boost exports and growth—Powell may face a fine balancing act in his tone.
Markets will dissect every word for clues on future policy.
🌐 U.S.-EU Trade Developments
The U.S. recently announced a new trade agreement with the EU, including a 15% tariff on selected European imports.
In the short term, this could be dollar-supportive, as it:
Favors domestic producers
Reduces reliance on imports
Potentially improves the trade balance
Yet over the longer term, such tariffs can be inflationary and disrupt global supply chains—possibly complicating the Fed’s decision-making.
⚠️ Final Thought
In times of policy uncertainty, markets lose their predictability.
Tariffs, in particular, often have a stronger and more immediate impact than calendar-based economic data.
As a result, traders must monitor trade-related news and tariff decisions just as closely—if not more—than traditional economic releases in order to stay ahead of market direction and central bank decisions.
DXY Bearish Trend The DXY is expected to enter a bearish phase, with a potential decline starting from the 98.26–98.35 range, and possibly extending down to the 95.20–94.50 levels, which are anticipated to act as key support zones during the upcoming downtrend

A news-packed week.In this week, which could be considered the most news-packed week of the year, anything can happen. Due to the strength of the news, there's a high possibility that many of our analyses might fail, while many targets could also be hit.

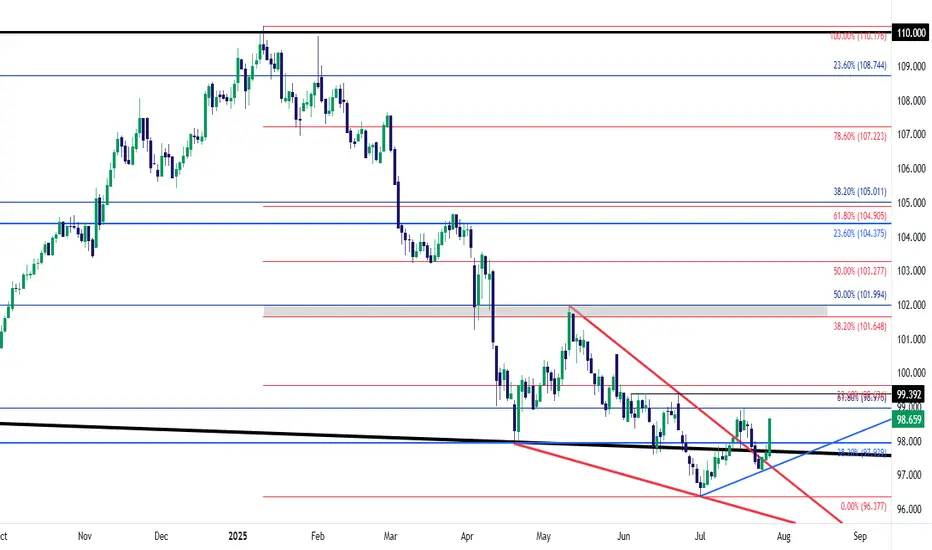
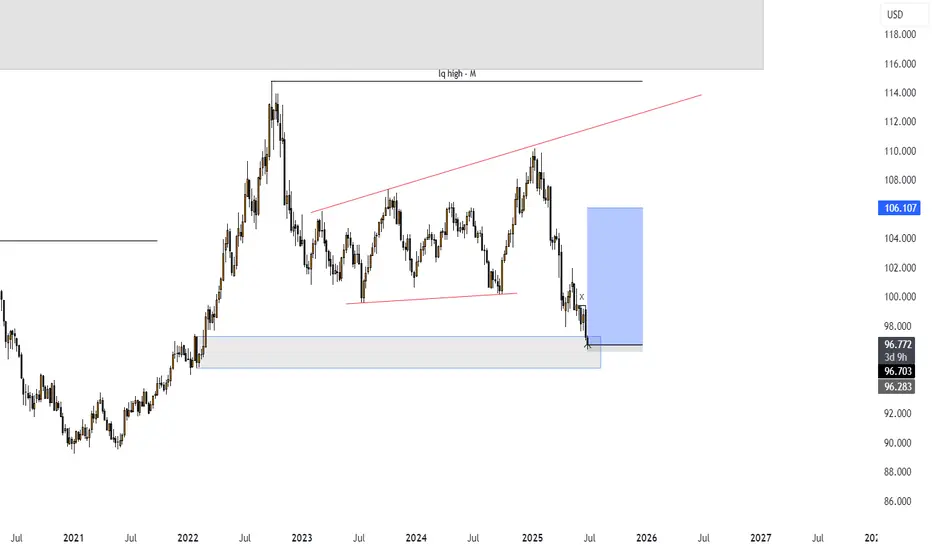
Dollar Index (DXY): Possible Reversal | Inverse Head & ShouldersThe dollar has had a tough year, but that might be changing.
I’ve spotted a well-known reversal pattern: an Inverse Head & Shoulders.
This pattern features three dips, with the middle one—the "head"—being the deepest.
Now, the price has rebounded from the Right Shoulder and is heading higher.
It’s approaching the Neckline at $98.7, which needs to be broken for a bullish confirmation.
If that happens, the projected target is around $101.6, based on the depth of the pattern.
This lines up closely with the previous high of $102 from May. The target area is highlighted in the blue box.
However, if the price falls below the Right Shoulder’s low at $97.1, the pattern would be invalidated.
Anyone else see this pattern?
Could this be the bottom for the dollar?
