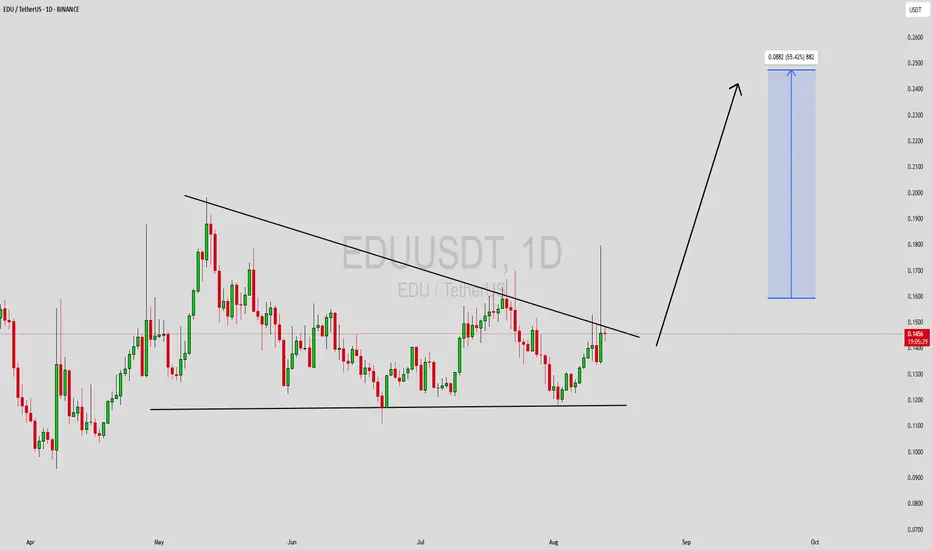
EDUUSDT 1D#EDU is moving inside a symmetrical triangle on the daily chart. In case of a breakout above the pattern, the potential targets are:
🎯 $0.1627
🎯 $0.1841
🎯 $0.2054
🎯 $0.2359
🎯 $0.2747
⚠️ Always remember to use a tight stop-loss and follow proper risk management.

EDUUSDT | 1H Setup With CDV DivergenceOn EDUUSDT, the green box is not a bad level to try — but only with the right confirmation.
I’d like to see a positive CDV divergence on the 1-hour chart before considering entry. That would suggest buyers are absorbing and quietly stepping in.
Important note: this is a 1-hour analysis, which mean
#EDU/USDT Forming Bullish Reversal#EDU
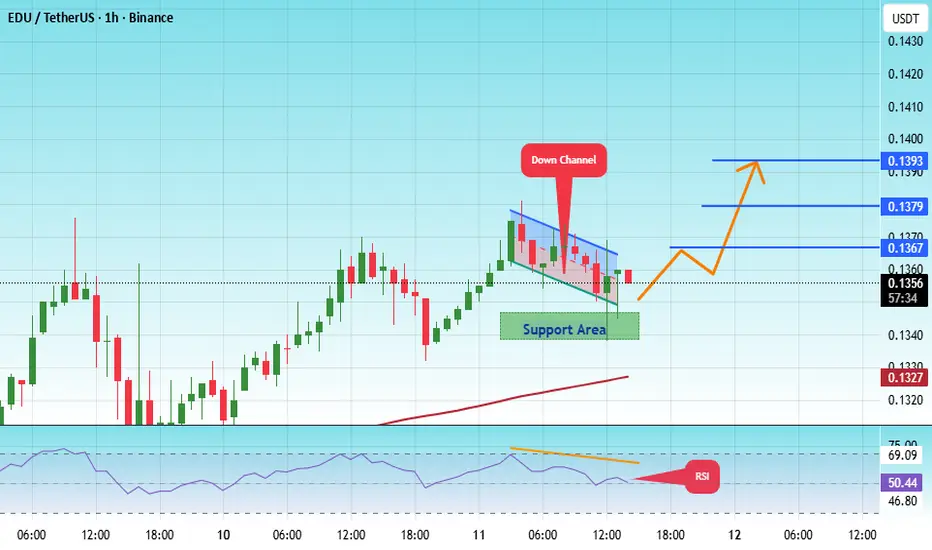
The price is moving within a descending channel on the 1-hour frame, adhering well to it, and is heading for a strong breakout and retest.
We have a bearish trend on the RSI indicator that is about to be broken and retested, which supports the upward breakout.
There is a major support area i
EDU BINANCE:EDUUSDT
#EDU/ USDT
Entry range (0.1200- 0.1380)
SL 4H close below 0.1170
T1 0.1730
T2 0.2800
T3 0.3300
_______________________________________________________
Golden Advices.
********************
* collect the coin slowly in the entry range.
* Please calculate your losses before the

#Edu/USDY#EDU
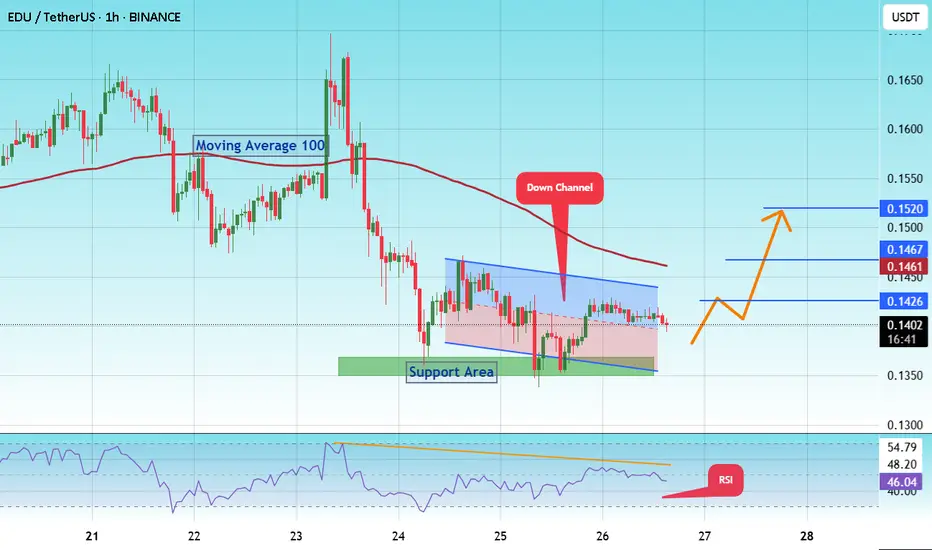
The price is moving within a descending channel on the 1-hour frame and is expected to break and continue upward.
We have a trend to stabilize above the 100 moving average once again.
We have a downtrend on the RSI indicator that supports the upward move with a breakout.
We have a support a

#EDU/USDT Forming Descending Triangle#EDU
The price is moving within a descending channel on the 1-hour frame and is expected to break and continue upward.
We have a trend to stabilize above the 100 moving average once again.
We have a downtrend on the RSI indicator that supports the upward break.
We have a support area at the lowe
EDUUSDT Forming Bullish ReversalEDUUSDT is showing promising signs of a potential bullish reversal after forming a clear descending channel pattern on the charts. This pattern, often considered a continuation or reversal setup depending on the breakout direction, is currently leaning bullish as the price edges closer to a possible
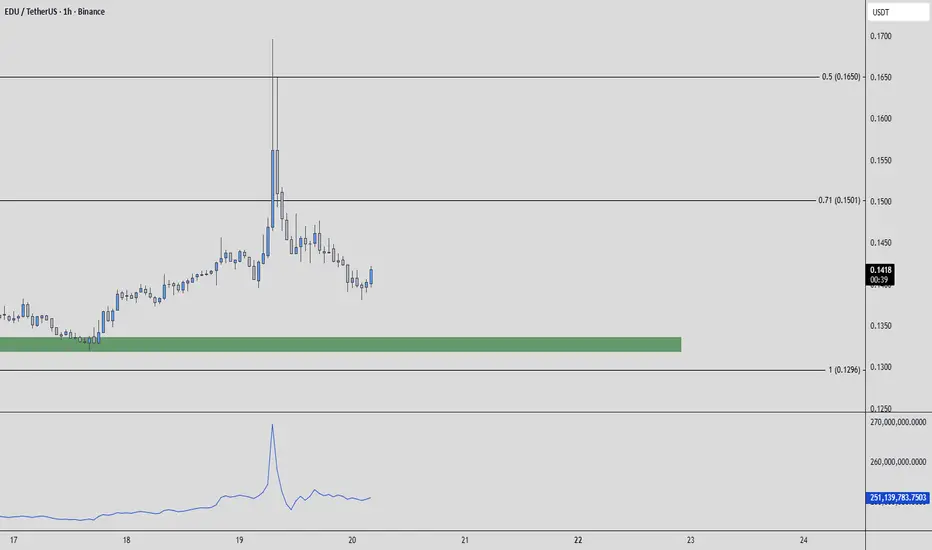
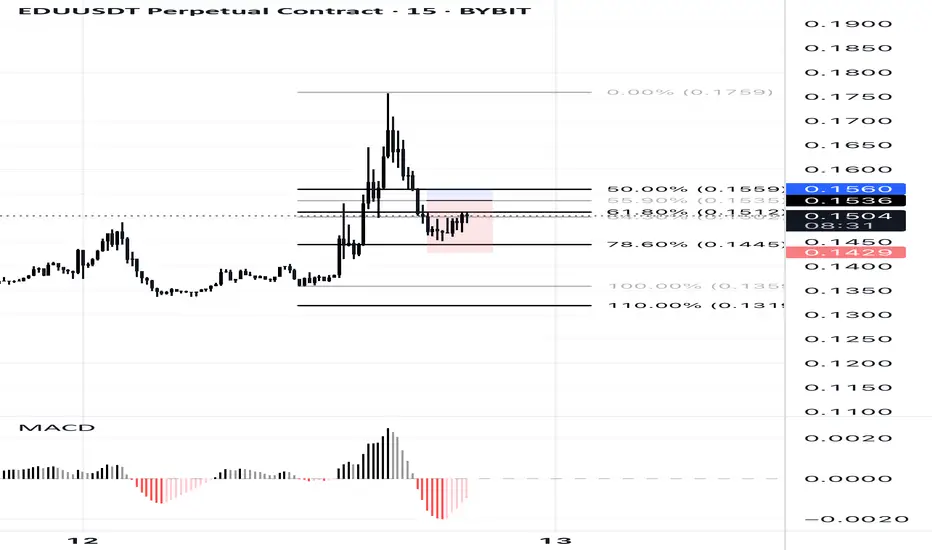
EDUUSDT | 61.8% Fibonacci Rejection – Bearish Continuation SetupEDUUSDT printed a strong pump to 0.1759, followed by a sharp sell-off. Price is now rejecting the 61.8%–64% Fibonacci zone (0.1512–0.1522) after failing to reclaim the 50% Fib (0.1559) level.
#EDU/USDT#EDU
The price is moving within a descending channel on the 1-hour frame, adhering well to it, and is on its way to breaking strongly upwards and retesting it.
We have support from the lower boundary of the descending channel, at 0.1464.
We have a downtrend on the RSI indicator that is about to be

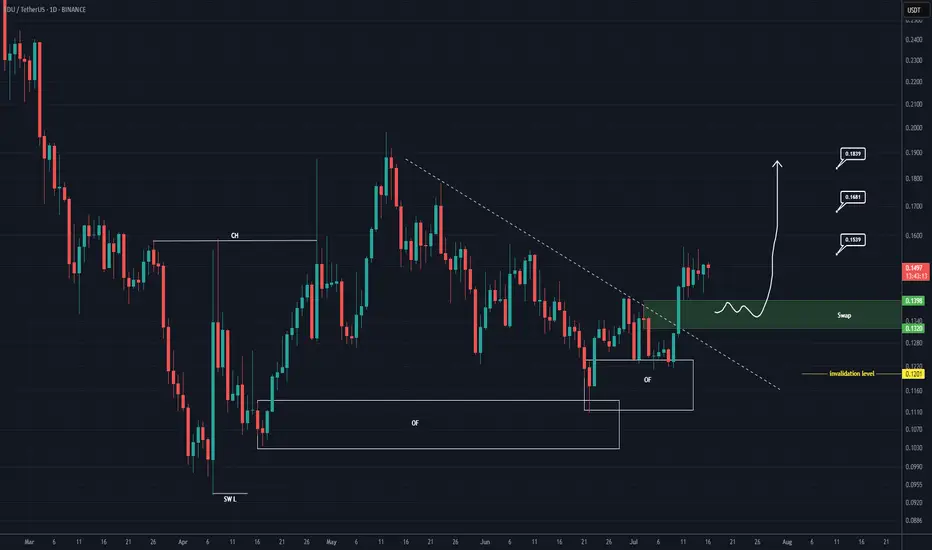
EDU Buy/Long Setup (1D)After forming a swing low, the price has created a bullish Change of Character (CH), and it has flowed well from the origin order blocks.
The trigger line has been broken, and the price has formed a SWAP zone.
Given the bullish signs on the chart, we can consider entering a buy position within the
See all ideas
Summarizing what the indicators are suggesting.
Oscillators
Neutral
SellBuy
Strong sellStrong buy
Strong sellSellNeutralBuyStrong buy
Oscillators
Neutral
SellBuy
Strong sellStrong buy
Strong sellSellNeutralBuyStrong buy
Summary
Neutral
SellBuy
Strong sellStrong buy
Strong sellSellNeutralBuyStrong buy
Summary
Neutral
SellBuy
Strong sellStrong buy
Strong sellSellNeutralBuyStrong buy
Summary
Neutral
SellBuy
Strong sellStrong buy
Strong sellSellNeutralBuyStrong buy
Moving Averages
Neutral
SellBuy
Strong sellStrong buy
Strong sellSellNeutralBuyStrong buy
Moving Averages
Neutral
SellBuy
Strong sellStrong buy
Strong sellSellNeutralBuyStrong buy
Displays a symbol's price movements over previous years to identify recurring trends.