Sell Nass100Price rejected strongly from the upper supply zone and slipped back below it. As long as price stays under that zone, bears stay in control. I’m expecting a deeper correction toward the demand zone around 24 690 – 24 700.
Bias: Bearish
Entry Zone: Below the broken supply
Target: 24 700
Invalidation: Break and hold above the supply zone
Trade ideas

Bias on nas100I'm swinging nas100 to the downside. Price tap into daily supply zone after sweeping liquidity and create a corrective move to the upside will later become my target liquidity now.

NAS100 | Bullish Bounce Off Pullback SupportMomentum: Bullish
Price is currently above the ichimoku cloud.
Buy entry: 25,308.70
- Pullback support
- 23.6% Fib retracement
Stop Loss: 25,092.80
- Multi-swing low support
Take Profit: 25,553.90
- Swing high resistance
- 127.2% Fib extension
High Risk Investment Warning
Stratos Markets Limited (tradu.com/uk ), Stratos Europe Ltd (tradu.com/eu ):
CFDs are complex instruments and come with a high risk of losing money rapidly due to leverage. 70% of retail investor accounts lose money when trading CFDs with this provider. You should consider whether you understand how CFDs work and whether you can afford to take the high risk of losing your money.
Stratos Global LLC (tradu.com/en ): Losses can exceed deposits.
Please be advised that the information presented on TradingView is provided to Tradu (‘Company’, ‘we’) by a third-party provider (‘TFA Global Pte Ltd’). Please be reminded that you are solely responsible for the trading decisions on your account. Any information and/or content is intended entirely for research, educational and informational purposes only and does not constitute investment or consultation advice or investment strategy. The information is not tailored to the investment needs of any specific person and therefore does not involve a consideration of any of the investment objectives, financial situation or needs of any viewer that may receive it. Past performance is not a reliable indicator of future results. Actual results may differ materially from those anticipated in forward-looking or past performance statements. We assume no liability as to the accuracy or completeness of any of the information and/or content provided herein and the Company cannot be held responsible for any omission, mistake nor for any loss or damage including without limitation to any loss of profit which may arise from reliance on any information supplied by TFA Global Pte Ltd.

NAS100How to become successful in forex and stock trading: 1.Master fundamentals and technical analysis. 2,Build and follow a solid trading plan. 3.Apply strict risk management (1–2% rule). 4.Stay disciplined—control fear and greed. 5.Record and analyze every trade. 6.Focus on high-quality setups only. 7.Diversify across assets and markets. 8.Keep evolving—study, adapt, and grow daily.

NOV.30,2025 ANALYSIS ON SPX500 & NAS100 INDICES The monthly charts have printed hanging man candles and hence if the closing of next month candle is below the body of the candle, it will confirm that the rally is over and the next months have a bearish setup. Indicators also support the rally is over based on the weekly and daily charts on both indices.
The weekly candle looks bullish but since the volume is low it does not confirm the rally and is a market maker manipulation setup for retail traders. For shorts bias use tight stop loss, price should not exceed the invalidation levels noted in the video.
The daily charts also show a hidden bearish divergence on MACD Histogram bars, Stochastic cycle & Momentum at fib resistance of 0.786 retrace and Oct, 2023 fib extension of 1) for the SPX500 and fib 0.618 retrace for the NAS100. Daily Stoch cycles support shorts more than long. Price uprise since Wed, Nov 26th, has been on declining momentum, see MACD histogram on 4H. RSI is overbought on 4H with a hidden bearish divergence too.
So, I see more bearish signal on the indices than bullish continuation.
Thank you again for supporting my publications and consider giving my publication a boost and comment with your own insights too. Iron sharpens Iron, let conquer the market together. Cheers !!

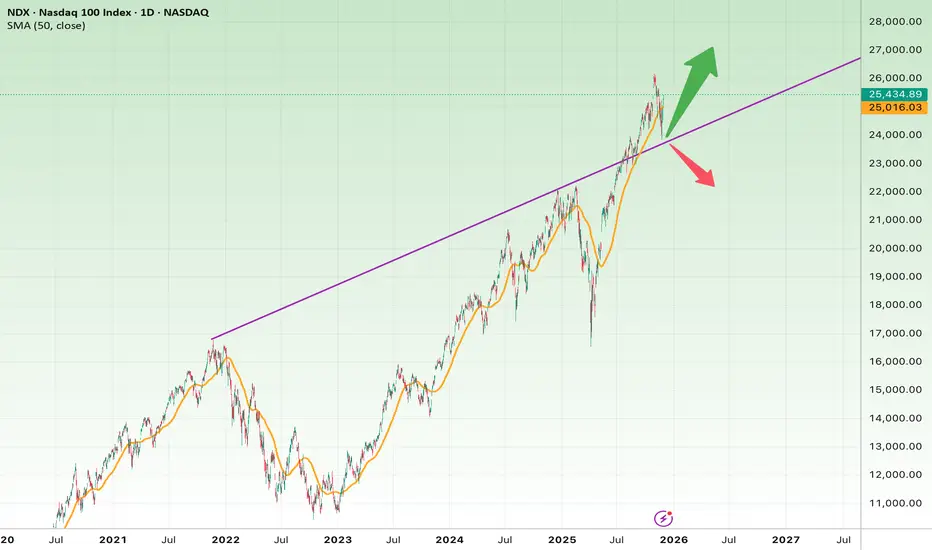
Nasdaq 100 (NDX) – Daily Chart AnalysisThe chart shows that the Nasdaq 100 has been in a strong multi-year uptrend from 2023 to 2025 and is now touching a major long-term ascending trendline (purple line).
This is one of the most critical decision zones for the index.
Bullish Scenario (More Likely at the Moment)
Price is currently holding above the long-term trendline and is also trading above the SMA50 (orange line), which still has a positive upward slope.
If the price continues to respect this trendline:
Bullish Targets
• 26,600
• 27,200
• 28,000 (major upside target)
Signals that strengthen the bullish case:
• A breakout above the previous high near 25,900–26,000
• Strong closing candles above the trendline
• Increasing bullish volume
Bearish Scenario (If the Trendline Breaks)
If the index breaks below the ascending trendline and then loses the SMA50, it could enter a broader corrective phase.
Bearish Targets
• 23,800 – first major support
• 22,500
• 20,800 – key structural support
Bearish confirmation signs:
• A strong breakdown candle below the trendline
• Failure to reclaim the SMA50
• Weak or failed retest (pullback) of the broken trendline
Logical Stop-Loss Zones
• Long positions: Below 24,600
• Short positions: Above 25,900
Quick Summary
• NDX is sitting right on a major long-term trendline.
• Bullish scenario remains stronger as long as the trendline holds.
• Breaking the trendline would likely trigger a deeper correction.
• Holding above it could push price toward 27K–28K.
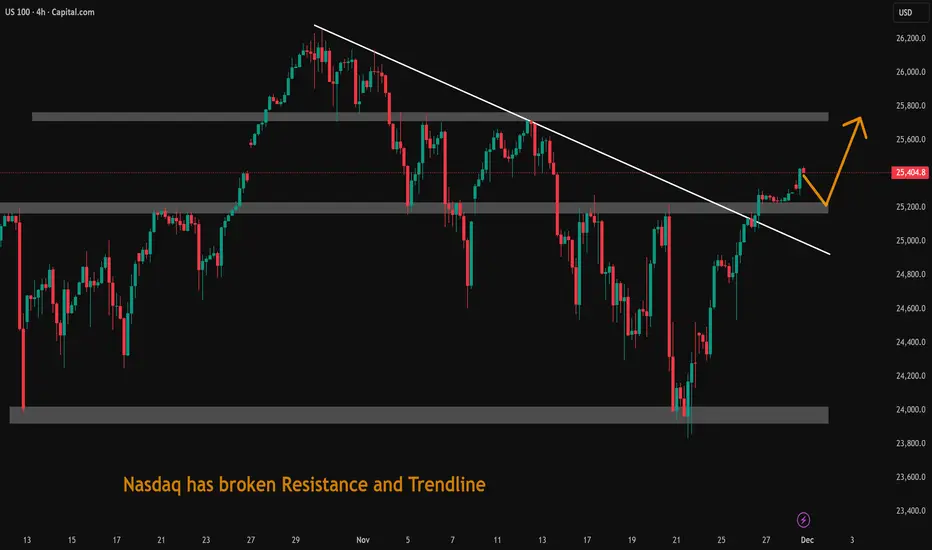
Nasdaq has broken Resistance and TrendlineNasdaq has broken Resistance and Trendline. US economy is doing well. Uptrend may continue.
NAS100 H4 | Bullish Continuation?Momentum: Bullish
The price has bounced off the buy entry, which is a pullback support and is also trading above the Ichimoku cloud.
Buy entry:25,511.55
Pullback support
Stop loss: 25,222.42
Overlap support
Take profit: 26,202.94
Swing high resistance
High Risk Investment Warning
Stratos Markets Limited (tradu.com ), Stratos Europe Ltd (tradu.com ):
CFDs are complex instruments and come with a high risk of losing money rapidly due to leverage. 70% of retail investor accounts lose money when trading CFDs with this provider. You should consider whether you understand how CFDs work and whether you can afford to take the high risk of losing your money.
Stratos Global LLC (tradu.com ): Losses can exceed deposits.
Please be advised that the information presented on TradingView is provided to Tradu (‘Company’, ‘we’) by a third-party provider (‘TFA Global Pte Ltd’). Please be reminded that you are solely responsible for the trading decisions on your account. Any information and/or content is intended entirely for research, educational and informational purposes only and does not constitute investment or consultation advice or investment strategy. The information is not tailored to the investment needs of any specific person and therefore does not involve a consideration of any of the investment objectives, financial situation or needs of any viewer that may receive it. Past performance is not a reliable indicator of future results. Actual results may differ materially from those anticipated in forward-looking or past performance statements. We assume no liability as to the accuracy or completeness of any of the information and/or content provided herein and the Company cannot be held responsible for any omission, mistake nor for any loss or damage including without limitation to any loss of profit which may arise from reliance on any information supplied by TFA Global Pte Ltd.

NAS100 H4 | Potential Bearish DropMomentum: Bullish
The price has reacted off the sell entry, which is a pullback resistance
Sell entry: 25,569.52
Pullback resistance
Stop loss: 25,787.46
Multi swing high resistance
Take profit: 25,216.31
Overlap support
High Risk Investment Warning
Stratos Markets Limited (tradu.com ), Stratos Europe Ltd (tradu.com ):
CFDs are complex instruments and come with a high risk of losing money rapidly due to leverage. 70% of retail investor accounts lose money when trading CFDs with this provider. You should consider whether you understand how CFDs work and whether you can afford to take the high risk of losing your money.
Stratos Global LLC (tradu.com ): Losses can exceed deposits.
Please be advised that the information presented on TradingView is provided to Tradu (‘Company’, ‘we’) by a third-party provider (‘TFA Global Pte Ltd’). Please be reminded that you are solely responsible for the trading decisions on your account. Any information and/or content is intended entirely for research, educational and informational purposes only and does not constitute investment or consultation advice or investment strategy. The information is not tailored to the investment needs of any specific person and therefore does not involve a consideration of any of the investment objectives, financial situation or needs of any viewer that may receive it. Past performance is not a reliable indicator of future results. Actual results may differ materially from those anticipated in forward-looking or past performance statements. We assume no liability as to the accuracy or completeness of any of the information and/or content provided herein and the Company cannot be held responsible for any omission, mistake nor for any loss or damage including without limitation to any loss of profit which may arise from reliance on any information supplied by TFA Global Pte Ltd.

Nasdaq retraced from resistance and taken support at demand zoneNasdaq retraced from resistance and taken support at demand zone.

US Tech 100 NASDAQ Structural Bearish Shift
IG:NASDAQ
Structural Bearish Shift Explained
Multi-Timeframe Price Action Breakdown (1D → 4H)
This analysis focuses purely on market structure, liquidity, and intention.
🔹 1D CONTEXT — MARKET STRUCTURE SHIFT
On the Daily timeframe, the market printed a clear bearish Market Structure Shift (MSS):
• The prior bullish sequence (HH → HL) was invalidated
• Price broke the key HL, officially changing the higher-timeframe flow
• This confirms a bearish structural bias on 1D
The critical detail is where the shift originated.
⸻
🔹 ORIGIN OF THE 1D MSS (KEY DETAIL)
The Daily MSS was caused by an internal high, not by a macro LH:
• This internal high was the impulsive driver that broke the Daily HL
• Once the HL failed, that internal high became:
• The origin of the bearish shift
• A high-probability liquidity pool
This distinction matters.
The market is not reacting randomly — it is respecting structural causality.
⸻
🔹 1D LIQUIDITY SWEEP = MITIGATION, NOT BREAKOUT
After the MSS, price returned precisely to that internal high and:
• Swept liquidity above it
• Took stops from:
• Early shorts
• Late breakout longs
• Failed to accept above the level
• Closed back below the sweep zone
This move is best defined as:
Daily mitigation of the MSS origin, not an attempt at bullish continuation.
No acceptance = no bullish intent.
🔹 4H CONFIRMATION — INTERNAL ALIGNMENT
Dropping to 4H, the lower-timeframe behavior aligns perfectly with the Daily narrative:
• A 4H bearish MSS printed
• Followed by a 4H BOS to the downside
• A clean bearish Fair Value Gap (FVG) was left behind
• Price expanded impulsively away from that imbalance
This tells us:
• The Daily mitigation triggered internal distribution
• Lower timeframes accepted the bearish flow
• Momentum is now aligned top-down
⸻
🔹 WHAT THIS TELLS US ABOUT MARKET INTENT
Putting it all together:
• ✅ Daily bearish MSS defines bias
• ✅ Liquidity above the MSS origin has been fully mitigated
• ✅ 4H structure confirms bearish continuation
• ❌ No bullish acceptance or expansion above key levels
This is not a failed breakout
This is a structural transition from accumulation to distribution
⸻
🔹 KEY TAKEAWAY
After a Daily Market Structure Shift, the market revisited the exact internal high that caused the shift, swept liquidity, failed to accept higher prices, and aligned lower-timeframe structure to the downside.
Bias: Bearish
Framework: Structure → Liquidity → Acceptance
Not financial advice.
AI Generated.


US100 intraday overviewThis is a simple market overview based on basic price action.
Sharing my personal view, not financial advice.

NAS100I am buying currently which i am not 100% confident on, but i am going to wait until next week for fresh news, and then we can move forward, price action is going to be shitty from next week i reckon but lets watch and see how it goes.

NAS100 Intraday Rebound Setup (1H)After a strong downside sweep into the lower liquidity pocket, NAS100 is showing its first signs of stabilization on the 1-hour chart. Price has tapped directly into a confluence of demand and prior inefficiency, creating conditions for a corrective bounce back toward the nearest redistribution zone above.
The sharp wick and immediate reaction signal that sellers may be exhausting into support, giving buyers an opportunity for a short-term recovery move.
🔹 Entry: CMP
🔹 Target (TP): 25,818.90
🔹 Stop-Loss (SL): 25,064.75
This setup aims for a retracement into the mid-range supply cluster, offering a favorable reward relative to the tight invalidation below. A clean close above 25,560–25,620 would confirm early strength and increase the probability of continuation toward the main target.
However, a breakdown beneath 25,064 invalidates the bounce thesis outright and suggests deeper expansion toward the next demand levels.
Trade Management
Take partials as price enters 25,560–25,620
Move SL to break-even once price closes above 25,620
Full TP at 25,818.90 unless momentum shows signs of exhaustion earlier
⚠️ Financial Disclaimer (fun version):
Not financial advice. Just colorful candles and hopeful arrows. If you trade this without risk management, NAS100 may personally introduce you to high-speed downside action. Always DYOR.

NSDQ100 renewed cautionThe Nasdaq-100 saw mixed but resilient performance as the index worked through a heavy tech news cycle:
Tech drag early in the session:
The index opened weak after a sharp tech selloff, led by Oracle (-10.83%), which plunged on missed revenue and higher-than-expected capex, stoking concerns about whether AI-related spending is beginning to show fatigue.
Broader tech sentiment remained cautious with Broadcom slipping after underwhelming AI-related expectations.
Recovery driven by macro tailwinds:
Despite early weakness, the broader US market mood improved, helping the Nasdaq-100 stabilise as investors continued to digest the Fed’s rate cut and easing inflation pressures.
2-yr inflation swaps hit a 13-month low, reinforcing the view that the Fed’s easing cycle is intact—supportive for duration-sensitive tech names.
Global backdrop supportive:
European equities rallied strongly as markets pared back the probability of an ECB hike next year, adding to the global risk-on tone.
Global indices moved closer to record highs on confidence that monetary easing will continue through 2025.
Stock-specific movers with Nasdaq implications:
UBS reached a 17-year high (banking sentiment supportive but not directly Nasdaq-linked).
Lululemon surged pre-market on CEO departure news—boosting retail sentiment within the consumer discretionary components of tech-heavy indices.
Dollar outlook: Strategists at Deutsche Bank and Goldman see the USD weakening in 2025 as the Fed cuts further. A softer dollar typically supports large-cap growth and tech.
Geopolitical noise:
Comments from Donald Trump about guaranteeing Ukraine’s security added volatility in the defense complex globally, but impacts on Nasdaq-100 were indirect and limited.
Takeaway for Nasdaq-100 traders
Early tech weakness (Oracle, Broadcom) signalled renewed caution around AI-driven capex trends.
However, macro easing tailwinds dominated, allowing the index to recover from the weak open.
The path of least resistance remains upward as long as the Fed easing narrative holds, though AI-spending scrutiny may introduce pockets of volatility within the megacap tech complex.


25.12.12 Nasdaq AnalysisWelcome to Acid Trade.
Hello everyone, as of December 12th, 2025, I will be analyzing the Nasdaq chart today.
This is Acid.
15 Minute Chart Analysis
Let’s first review yesterday’s results.
In the previous video, I mentioned that a long position should be taken once the resistance trendline and the 25,566 level were broken.
That breakout occurred at the white circle, and from that entry, the market climbed approximately 152 points, resulting in a $3,000 profit.
For the short-side opportunity, the entry occurred when the rising trendline after the market opened was broken.
This sell signal appeared at the blue circle and led to a 186-point decline, giving a $3,720 profit.
Therefore, the total profit for December 11th was $6,720.
Daily Chart Analysis
Looking at yesterday’s candle (December 11), the price tapped the daily 20-EMA and bounced back, leaving a long lower wick.
Nasdaq is currently trading inside a previous volume zone, with the downside open toward 25,120 and potentially 24,945 if momentum continues lower.
Today’s Strategy
Today, Nasdaq temporarily broke below the short-term rising trendline, but this happened due to a pre-market gap-down, creating the yellow-box gap zone.
Because the sell-off was not strong and price action remains sideways, the market is effectively consolidating.
At the moment, Nasdaq is forming a larger box range:
Top: 25,879 forming a double top
Bottom: 25,400 forming a double bottom
A breakout from either side will likely determine the next major trend direction.
Today’s trading strategy should focus on identifying that breakout level and reacting once confirmation appears.
Conclusion
Nasdaq is moving within a key range between 25,879 and 25,400, and a breakout will define the next major trend direction.
Watch for a confirmed break with supporting volume before taking a position.
Today’s session is all about timing the breakout and reacting quickly.

NAS100 Trade Set Up Dec 10 2025Price is testing 1h FVG so i i see internal 1m-5m IFVG/CISD from here i will target BSL/London highs

Nqz & nas100Price has a potential of slamming lower. Overall it will be good to see price pushing higher tapping into premium arrays and eventually go lower from next week. I will keep an eye on the previous daily high

NasdaqNASDAQ bounced from a strong demand zone, showing bullish momentum, as buyers step in, with key resistance levels ahead to watch for potential continuation.

$BTC - $DXY -$SPX - $NDX - $GOLD 10/12/2025 forecastAs explained,only NASDAQ:NDX should see a corrective day which got skipped on the previous day. Rest is neutral biased. Likely that CRYPTOCAP:BTC mimicks the NASDAQ:NDX price action.
