price could go up higher anthor 500 points based on the fibonacci retracement tool i use price hit all the way down to 50% off and i bought at 37% of
NDQ100 trade ideas

NAS100 - ABCD Harmonic PatternWith a strong bearish divergence on the 2h chart, NAS100 is showing weak signs of sustaining its bullish trend.

BUY NAS100Support and Resistance levels been respected for a while, historic movements showing valid supply and demand zones.
Thanks
Don

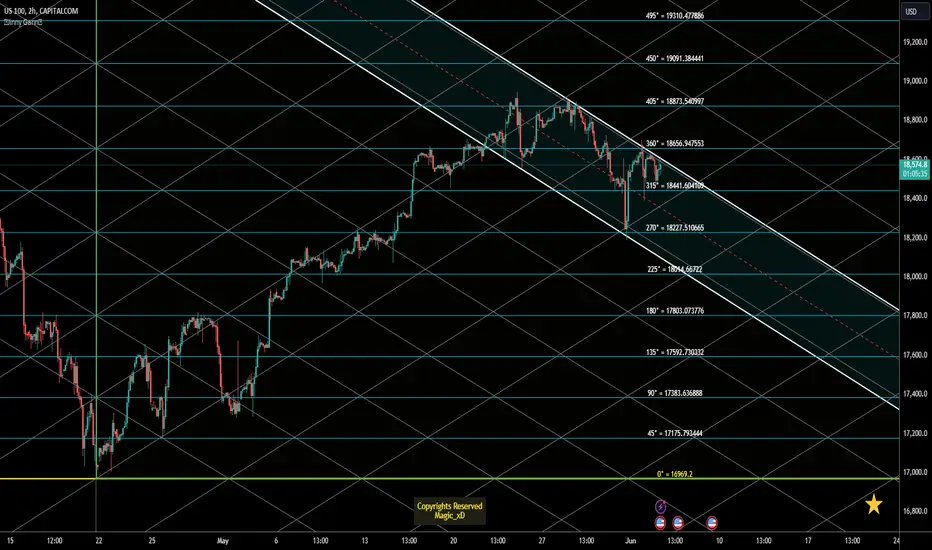
Us100 Important Levels + Gann GridHello Dear Traders...
On the Chart Important levels for US100 Short term
Horizontal lines are Support/Resistance
Watch for Price action around these levels.
Also the Jinny Gann Grid, Giving you Expected Channels,Trends!
Wish you Best of Luck Trading
NAS100: First green day, three days cycleHi everyone and welcome to my channel, please don’t forget to support all my work subscribing and liking my post, and for any question leave me a comment, I will be more than happy to help you!
“Trade setups, not movements”
1. DAY OF THE WEEK (Failed Breakout, False Break, Range Expansion)
Monday DAY 1 Opening Range
Tuesday DAY 2 Initial Balance ✅ day 3 cycle
Wednesday DAY 3 (reset DAY 1) Mid Point Week
Thursday DAY 2
Friday DAY 3 Closing Range
2. SIGNAL DAY
First Red Day
First Green Day ✅
3 Days Long Breakout
3 Days Short Breakout
Inside Day
3. WEEKLY TEMPLATE
Pump&Dump
Dump&Pump ✅
Frontside
Backside ✅
4. THESIS:
Long: primary, market potentially coiling for an explosive move back to the HOD or HOW, I will take this trade in consideration if buy 10am NYT the price action will be auctioning down low into the current LOD.
Short: secondary, is not the trade I'm interested today, but I can see a potential pump and dump starting from Friday LOW. If the market will keep breaking down for a pump and dump into the Friday CP, or market pumping back up into yesterday CP/HOD, then a sell high could also be an interesting alternative.
Please note that the purpose of my analysis is to help me and you hunting the best trade setup for the day, none of my technical aspects are a way to forecast any directional market movement.
Gianni

Nasdaq 100 (CME) may fall to 18240.00 - 18430.00Pivot
18760.00
Our preference
Short positions below 18760.00 with targets at 18430.00 & 18240.00 in extension.
Alternative scenario
Above 18760.00 look for further upside with 18880.00 & 18980.00 as targets.
Comment
As long as 18760.00 is resistance, look for choppy price action with a bearish bias.
Supports and resistances
18980.00
18880.00
18760.00
18543.80 Last
18430.00
18240.00
18000.00
Number of asterisks represents the strength of support and resistance levels.

USNAS100 (4H)USNAS100
Tendency the price is under bearish pressure between 18,680 and 18,750
Turning level : The turning level between 18,680 and 18,750 so as long as the price below this level, there will be a bearish trend
resistance level : Breaking the turning level 18,750 , the price will up to 18,895
support level : The trading stabilizing below 18,680 the price will reach the support level of 18,431 and 18,234 , and under this level it will reach 18,120
corrective level : price will attempt between 18,680 and 18,750, correct itself before falling


#Nazdaq #Nas US100 #stockmarketAccording to my analysis, I see the NASDAQ index rising to the range of 18,800. After reaching this level, a correction is likely. If the index breaks through the 18,800 range, we can expect it to rise further to the 19,150 level before entering a corrective phase.
Additionally, if a candle closes below the 18,500 level, the correction process is expected to start from this area. Based on these levels and the current analysis, we can anticipate potential market movements accordingly.


Nasdaq starts its vacationMixed results are expected this day as we begin a new trading month and WallStreet indices start with solid gains in the month of May. The S&P500 benchmark is up 17 points or about 0.3%. The Nasdaq Composite was up 156 points (0.9%), and the Dow Jones Industrial Average, composed of 30 top companies, fell 25 points (-0.1%). The PCE data showed a slight cooling of the U.S. economy, which has encouraged the FED to possibly cut interest rates in September. The S&P500 rose 0.8% to 5,277.51 points on Friday, while the Dow Jones rose 0.8% to 38,686.32 points and Nasdaq lagged on weakness in tech companies closing flat at 16,735.02 points.
May nonfarm payrolls are a key data point on Friday. Fed traders' consensus was 47% for a 25 basis point cut in September, in conjunction with a 45% probability that it will maintain its monetary policy according to CME Fed Watch. The central bank is expected to hold rates steady, and Fed officials continue to call for patience with rate cuts looking for evidence of a return to inflation stability on the 2% path. Already last Monday Neel Kashkari of the Minneapolis Fed echoed this by reporting that they could remain unchanged for an “extended” period of time.
If we look at the Nasdaq chart (Ticker AT: USATEC) the fact is that on Friday the first price resistance was pierced at the 18,197 area returning to the support zone of May 23rd. The price bell has generated a price control zone at 18,820 points with a dual bell marking the second lower bell around 18,626 points. The RSI is currently oversold at 41.60%, it will not be uncommon this month to see a price drop to Friday's second resistance zone. And a return to the mean. The truth is that this month can be quite weak in terms of sales in many technology sectors and Nasdaq has been practically dragged down by the Magnificent 7 and not so much by the rest that have barely experienced a palpable growth.
Ion Jauregui - ActivTrades Analyst
*******************************************************************************************
The information provided does not constitute investment research. The material has not been prepared in accordance with the legal requirements designed to promote the independence of investment research and such should be considered a marketing communication.
All information has been prepared by ActivTrades ("AT"). The information does not contain a record of AT's prices, or an offer of or solicitation for a transaction in any financial instrument. No representation or warranty is given as to the accuracy or completeness of this information.
Any material provided does not have regard to the specific investment objective and financial situation of any person who may receive it. Past performance is not reliable indicator of future performance. AT provides an execution-only service. Consequently, any person acing on the information provided does so at their own risk.

NAS100USD: Potential Buy Opportunity for NY SessionGreetings, Traders!
Brief Description🖊️:
Currently, institutional order flow on US100 is bullish, therefore we are looking for price to take sell stops in order for a turtle soup trade condition (false break).
Things I Have Seen👀:
Bullish Institutional Order Flow📈: Anticipating price to continue to the upside after sell stops have been taken. Smart money will look to order pair (buy against the sell-side liquidity).
Potential Sell Stops🔄: Price may take sell stops before buying, presenting a turtle soup condition (false break of structure). After sell stops have been taken, I will look to take a confirmation entry.
Bullish Targets📉:
Daily FVG: The primary target.
M15 Bearish Order Block: The secondary objective, with an expectation to fill the liquidity void there.
What's Important Now❗
Stay observant for price action around these key levels to confirm bullish continuation.
Best Regards,
The_Architect

US100US100 is in bullish trend.
Potentially printing HH and HL.
No sign of reversal .
We buy at CMP.

View on NAS100 1.NAS100 broken the Trendline Liquidity and looking for new HH.
2.We take a Long from the new support around 17270.
3.If Dollar continuous the bearish movement we can see a huge upside movement in Indices.
4.Today CPI news is very important for the Dollar. Depending on the news we can see a huge a moves in the market.

USNAS100 (More Bullish or Yet...)Technical Analysis
The price is expected to continue its bullish trend toward 18,735, having already stabilized in the bullish zone. The movement range will likely be between 18,550 and 18,820 until a breakout occurs.
Bullish Scenario: As long as the price remains above 18,600, it is likely to reach 18,735 and potentially 18,820.
Bearish Scenario: A stabilization below 18,550 would suggest a bearish trend, targeting 18,435 and 18,240.
Pivot Line: 18600
Resistance Levels: 18735, 18820, 18940
Support Levels: 18550, 18435, 18250
Today's range is expected to be between the support at 18230 and the resistance at 18820.

bearish pressureUSNAS100
- Tendency :
the price is under bearish pressure 18,675
- Turning level :
The turning level is at 18,675 where price has now stabilized at the bottom
- resistance level :
Breaking the turning level 18,675 , the price will up to 18,795 and 18,885
- support level :
The trading stabilizing below 18,675 the price will reach the support level of 18,490 and 18,325
- corrective level :
price will attempt in 18,675 correct itself before falling

Potential Reversal on US100I will be waiting for a potential Higher low to execute my entry as NAS has completed its Fib retracement on daily time frame Last week end and gave a bullish closing. Now after the opening of this week 1 hourly chart has printed a new Higher High Now I will wait for 1 hour Fib retracement to execute a precise entry. What do you think. Thanks

NASDAQ spread M2SL almost reached 2001 levelsNASDAQ spread between M2 supply almost reached levels we not seen since 2001. Almost like double top or sqeezed top wave5 (1.105 level of whole range as max target). Couple months may give us clue, as usually these extreme levels suppose to reached very fast if we close to real top.

GOLD SHORTGold already make breakout on daily hopefully there will be retracement on and entry area on 30M EMA

US100 SHORTMy US100 analysis is short position currently. This is just my own opinion.
Trade at your own risk!


NAS100 ShortElite Trading
Discretionary Trade
Executed trade in 5 minutes
Targeting Lower Liquidity Pools
Main Target Weekly Market Structural Liquidity
