Trade ideas
NAS100 INTRADAY TECHNICAL ANALYSIS ═════════════════════════════════════════════════════════════════════
NAS100 INTRADAY TECHNICAL ANALYSIS & MARKET OUTLOOK
November 17, 2025 | 10:30 AM UTC+4 | Current Level: 25,187.5
═════════════════════════════════════════════════════════════════════
CRITICAL SUPPORT & RESISTANCE LEVELS
RESISTANCE ZONES (Sell Targets):
R1: 25,245.80 (First Profit Zone - 58.3 points) | RSI 65-70 zone
R2: 25,335.40 (Intermediate Target - 147.9 points) | EMA 20 confluence + Rising Wedge apex
R3: 25,445.20 (Strong Resistance - 257.7 points) | Weekly pivot + Gann 1x1 angle
SUPPORT ZONES (Buy Opportunities):
S1: 25,115.20 (Initial Support - 72.3 points) | 15m Bollinger Band lower band
S2: 25,010.60 (Intermediate Support - 176.9 points) | SMA 50 daily + Gann angle
S3: 24,885.40 (Strong Support - 302.1 points) | Harmonic AB=CD node
CURRENT PRICE ACTION
Index rallying after Wyckoff accumulation completion. Price above EMA 20/50 on 4h = bullish confirmation. Bollinger Bands expanding—breakout phase active. RSI at 62 (bullish) on 1h suggesting momentum continuation. Rising Wedge pattern on 30m approaching apex breakout. Volume surging into US session. Ichimoku cloud bullish alignment below price.
═════════════════════════════════════════════════════════════════════
ENTRY & EXIT SETUPS - INTRADAY EXECUTION
═════════════════════════════════════════════════════════════════════
BULLISH SETUP (Optimal on 5m/15m continuation):
ENTRY: 25,210.40 (Break above 25,200 resistance + candle close confirmation)
STOP LOSS: 25,140.00 (Beneath S1 by 0.20 risk buffer)
TARGET 1: 25,245.80 (35.4 points) | Scale 50% profits
TARGET 2: 25,335.40 (125 points) | Scale 30% profits
TARGET 3: 25,445.20 (234.8 points) | Hold 20% to runner with trailing stop at 25,380
RISK/REWARD: 1:6.2 ratio | Risk 70.40 to win 437.25
BEARISH SETUP (Optimal on 1h wedge apex rejection):
ENTRY: 25,160.50 (Break below support + rejection candle formation)
STOP LOSS: 25,235.00 (Above R1 by 0.20 risk buffer)
TARGET 1: 25,115.20 (45.3 points) | Scale 50% profits
TARGET 2: 25,010.60 (149.9 points) | Scale 30% profits
TARGET 3: 24,885.40 (275.1 points) | Hold 20% with trailing stop at 24,935
RISK/REWARD: 1:3.8 ratio | Risk 74.50 to win 283.25
═════════════════════════════════════════════════════════════════════
TIMEFRAME-SPECIFIC TACTICS
═════════════════════════════════════════════════════════════════════
5-MIN SCALPING: Monitor Rising Wedge squeeze. Target 15-22 points on wedge breakout. Tactical range 25,175-25,210. Volume surge = apex confirmation.
15-MIN SWING: Head & Shoulders potentially forming on rejection. RSI divergence at 25,245 = sell signal. Hold 45-65 points per trade.
30-MIN POSITION: Rising Wedge apex critical—breakout within 60 minutes. EMA 9/21 bullish cross validated. Harmonic ratios at R2 confluence.
1-HOUR MACRO: Gann 1x1 angle support at 25,010. Price must hold above 25,160 for continued upside. Ichimoku Tenkan-sen/Kijun-sen bullish alignment. Wyckoff markup phase accelerating.
4-HOUR BIAS: Daily pivot at 25,115 institutional support. Close above 25,245 = sustained rally to R3. Gann Square of 9 confluences: 24,885 (S3), 25,187.5 (current), 25,445 (R3). Below 25,160 = triangle breakout to downside.
═════════════════════════════════════════════════════════════════════
SESSION EXECUTION RULES
═════════════════════════════════════════════════════════════════════
✓ ENTRY ONLY on candle close confirmation (not wick touch)
✓ STOP always 0.20-0.40 points BEYOND level (never AT exact level)
✓ SCALE profits: Take 50% at R1/S1, 30% at R2/S2, trail 20% to R3/S3
✓ Rising Wedge apex breakout = directional confirmation signal
✓ IF price closes below 25,115 or above 25,245 = trend acceleration likely
✓ Maximum 3 trades per session. Exit after 2 consecutive losses
✓ Volume confirmation mandatory—low volume = false breakout likely
✓ Gann angle violation = position review trigger
═════════════════════════════════════════════════════════════════════
Risk Disclaimer: Analysis is educational. Past performance ≠ future results.
═════════════════════════════════════════════════════════════════════

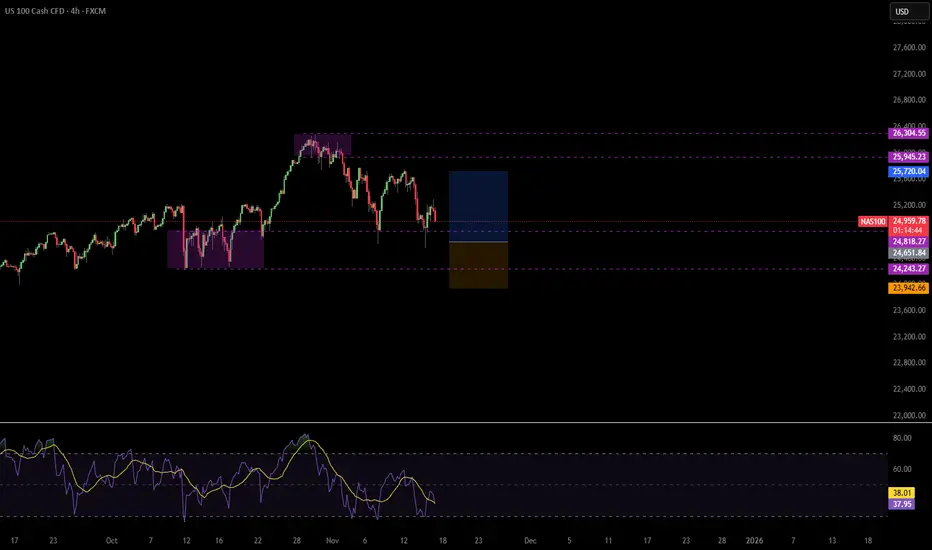
US Tech 100 Cash (NAS100 / NASDAQ) Recorded: 11/17 – 1:52Thesis:
Price swept prior liquidity and printed aggressive delta absorption at the demand zone. Despite selling imbalance, buyers continued to lift the offer, signaling passive accumulation rather than continuation selling. This aligns with the current higher-timeframe trend structure.
Footprint Evidence:
Large negative delta absorbed at the lows (2.9K → 3.3K stacked).
No follow-through selling despite footprint imbalance.
Subsequent candle printed trapped sellers and initiated responsive buy programs.
Cumulative delta failed to make a lower low → bullish divergence.
Market Context:
NASDAQ remains in a trending environment with controlled pullbacks. Current positioning shows willingness from larger participants to defend the zone rather than liquidate. As long as price remains above the absorption block, bullish continuation remains the higher-probability play.
Trade Logic:
Entered on absorption confirmation. If price reclaims the imbalance above, I expect continuation toward liquidity at the previous session high.
Invalidation is below the absorption block, where passive buyers failed.
Summary:
Smart money absorbed sell pressure at demand, trapped shorts, and rotated the auction higher. Bias remains long until structural invalidation.


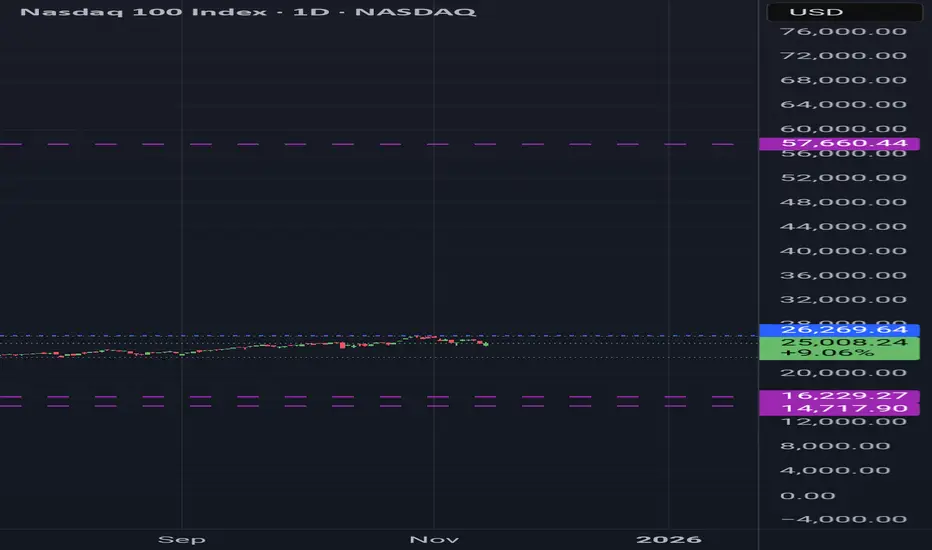
DECODED RESISTANCE ANALYSIS NDX (NASDAQ)DECODED RESISTANCE ANALYSIS NDX (NASDAQ)
After testing the support at $14,717 in Q4 2026 (as mentioned yesterday in my post), the stock market will rise to reach a new high over the next four years, with the DECODED resistance at $57,660, marking the end of the first Grand cycle.
Once the first Grand cycle ends, a huge correction will occur. The market will turn bearish and decline over the next 19 years, forming lower highs. During this period, the market will drop to the support level $16,229.
The second Grand pattern will form around 2050/2051.
I see what others call impossible, every support and resistance I draw is already written. I do not predict, I decode, even in uncharted areas.
This message is for educational purposes only. Always DYOR.
NAS100US100 4H CHARTUS100 4H — Price reacting near 0.382 Fib (25,484) after impulsive move. Current zone may act as inducement for deeper liquidity sweep into 0.5/0.618 (25,394–25,304). Watching for displacement and BOS above 25,741 to confirm bullish intent. If price sweeps 0.618 and leaves bullish PA, that’s my POI for long setups.

$QQQ: Doubtful Low The QQQ is currently showing a lower high and a lower low, indicating a likely corrective Zig Zag pattern, with wave C only slightly longer than wave A. The 1x1 Extension is positioned at 586. Last Friday's promising bounce was halted at the horizontal resistance level of 613.
The RSI has reached the same area where previous bounces occurred during the rally from the April low. The bulls need to demonstrate that last Friday's low can serve as a springboard for a recovery.

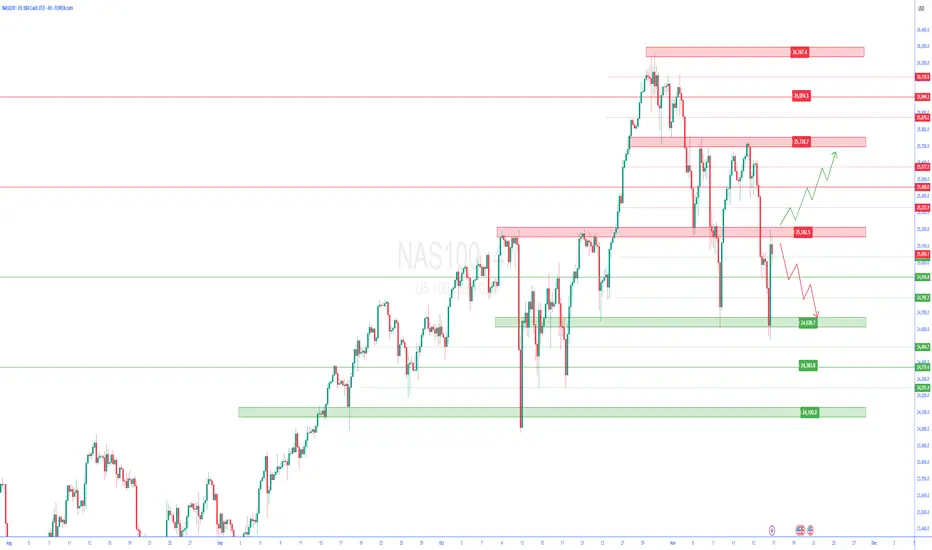
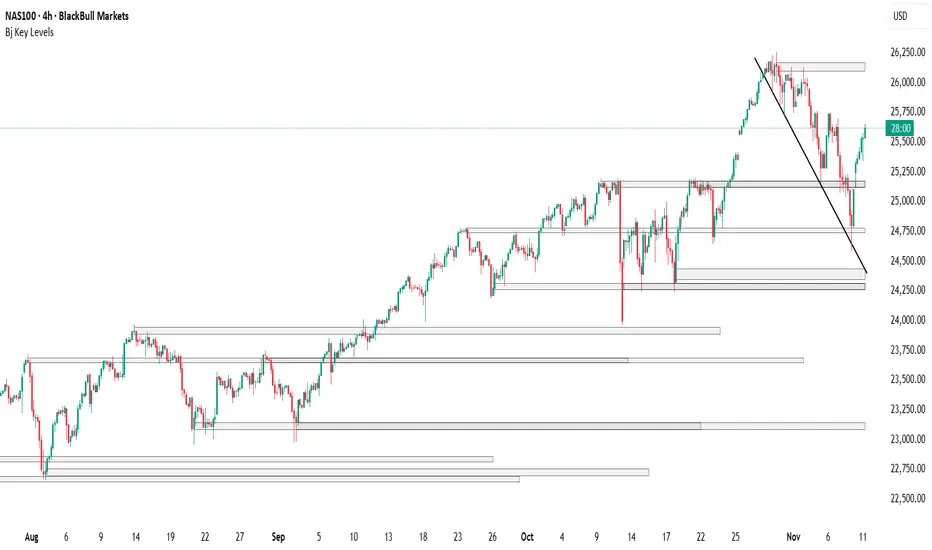
nas100 4h🔹 Overall Outlook and Potential Price Movements
In the charts above, we have outlined the overall outlook and possible price movement paths.
As shown, each analysis highlights a key support or resistance zone near the current market price. The market’s reaction to these zones — whether a breakout or rejection — will likely determine the next direction of the price toward the specified levels.
⚠️ Important Note:
The purpose of these trading perspectives is to identify key upcoming price levels and assess potential market reactions. The provided analyses are not trading signals in any way.
✅ Recommendation for Use:
To make effective use of these analyses, it is advised to manually draw the marked zones on your chart. Then, on the 15-minute time frame, monitor the candlestick behavior and look for valid entry triggers before making any trading decisions.
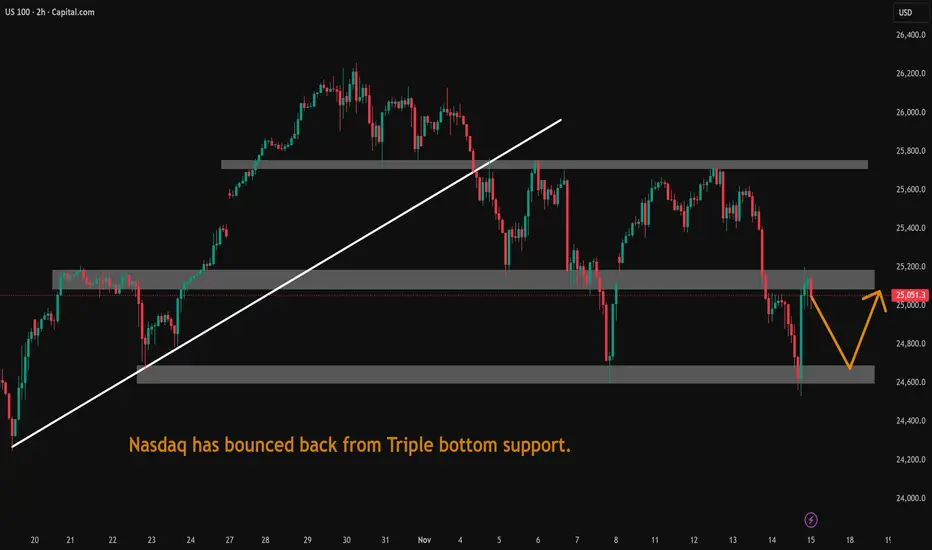
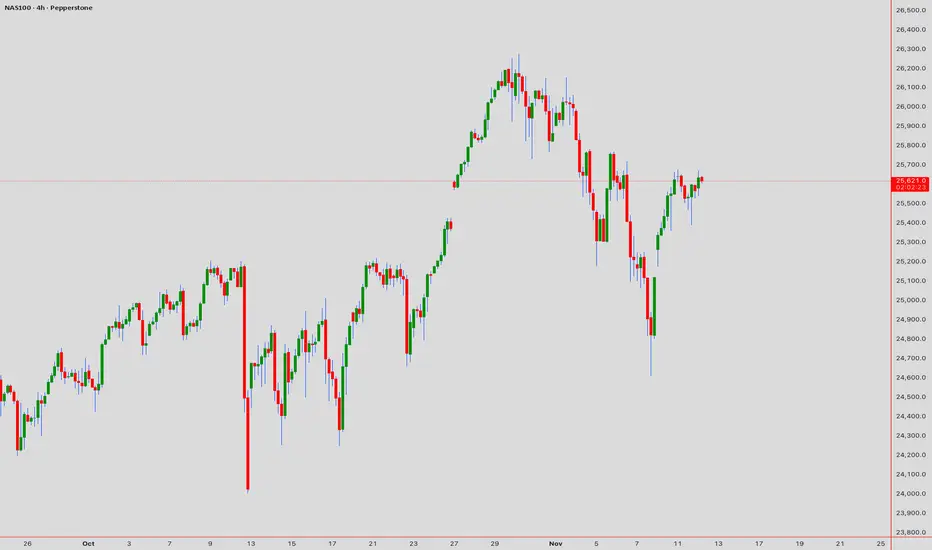
Nasdaq has bounced back from Triple bottom support.Nasdaq has bounced back from Triple bottom support. Next week may also be volatile.
US100 Free Signal! Sell!
Hello,Traders!
US100 is reacting inside the horizontal supply, where bearish orderflow continues to cap every rally attempt. With liquidity sitting below the prior swing lows, price is positioned for a corrective push lower.
--------------------
Stop Loss: 25,210
Take Profit: 24,901
Entry Level: 25,048
Time Frame: 2H
--------------------
Sell!
Comment and subscribe to help us grow!
Check out other forecasts below too!
Disclosure: I am part of Trade Nation's Influencer program and receive a monthly fee for using their TradingView charts in my analysis.

US100 Buy Trade within RangeUS100 has bounced back from its support and is now going to test the resistance. We can take a 1:1 long setup within this range.
Trendline Break and double bottom The price has broken out of a bearish trendline followed by 2 pullbacks that formed a double bottom pattern and now the price looks to make a higher high and continue long
WE ONLY TRADE PULLBACKS
Comment your thoughts
USTEC - Shorts - In the money!!!!🔥 USTE/15 — Morning Sell Trades Explained (Who Caught These With Us?)
This morning our system printed two clean SELL signals — both highlighted on the chart.
📉 Sell #1 — Momentum Flush
Price tapped into a short-term premium zone and immediately rejected.
Our system triggered the orange SELL candle right at the top of the move.
Within minutes, momentum collapsed and delivered a clean downside push.
📉 Sell #2 — Premium Retrace + Rejection
After the first drop, price pulled back into our sell zone again.
The system flagged a second SELL opportunity (again marked in orange).
The rejection was instant — textbook continuation setup.
Both entries respected the exact rules of the system:
✔️ Trend alignment
✔️ Premium pricing
✔️ Momentum shift
✔️ Clear rejection candle
No guessing. No emotion. Just execution.
💬 Who caught these sells with us today?
Drop a comment below if you took the trades — or if you’re testing the system and saw the same signals!

NASDAQ IS BEARIcHcheck out this , on the higher time frame the price seems to be bearish and the market couldn't puch higher than the previous Lower high , so we expect the market to rebalance after grabbing enough liquidity

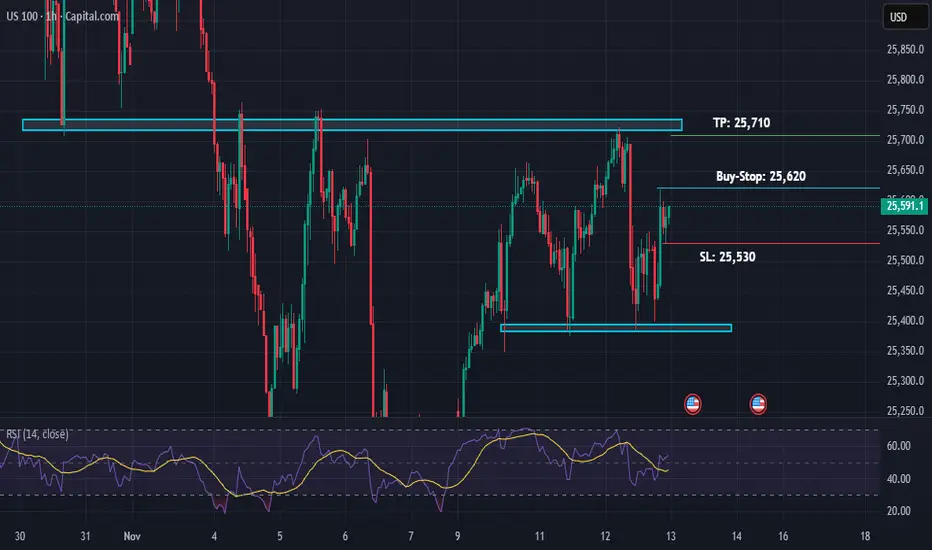
NAS100: Threshold Analysis & Decision FrameworkNAS100: Threshold Analysis & Decision Framework | November 12
Reference Point: 25,625 | 08:45 UTC+4
MARKET PREMISE
The Nasdaq 100 has stabilized within a confined bandwidth, presenting traders with a defined set of bifurcated outcomes. The micro-structure reveals a market in the midst of accumulation, where directional bias remains contested between competing institutional flows.
TECHNICAL ASSESSMENT MATRIX
Primary Trend (Dow Theory Lens): Uptrend remains intact; lower-bound support at 25,500 preserves bullish structure. Failure to maintain this floor signals potential regime shift.
Pattern Development: A Symmetrical Triangle is in formation across the 1H/4H timeframes. Contraction suggests breakout imminent—directional confirmation required.
Elliott Wave Interpretation: Wave IV consolidation underway. Upon completion, Wave V upleg anticipated toward fresh resistance territories.
Harmonic Configuration: Potential bearish Bat pattern exists if price recedes; conversely, completion of bullish Crab pattern supports upside continuation above 25,750.
INDICATOR CONFLUENCE TABLE
| Indicator | Timeframe | Status | Signal |
|-----------|-----------|--------|--------|
| Ichimoku Kumo | 4H | Price-Kumo Contact | Neutral-to-Bullish |
| RSI(14) | 4H | ~50 Median | Energy Stored |
| VWAP Proximity | Intraday | At Fair Value | Equilibrium |
| EMA(50) Stack | 1H | Bullish Alignment | Support Intact |
| Bollinger Squeeze | 30M | Band Tightening | Volatility Expansion Pending |
OPERATIONAL TRADE MATRIX
Bullish Engagement (Primary):
- Activation: Hourly close above 25,700 (Triangle apex breakout)
- Entry Coordination: 25,720–25,750
- Protective Stop: 25,580
- Profit Sequencing: 25,900 (T1) → 26,150 (T2)
- Risk-Reward Ratio: 1:2.4
Bearish Contingency (Secondary):
- Activation: Sustained close below 25,500 (Foundation breach)
- Entry Coordination: 25,480–25,450
- Protective Stop: 25,650
- Profit Sequencing: 25,250 (T1) → 25,000 (T2)
- Risk-Reward Ratio: 1:1.8
GANN TEMPORAL OVERLAY
Key cyclical windows on the 4D chart suggest consolidation resolution within the 12–15 hour window. Volume profile at the 25,650 level indicates potential liquidity pool; breakouts through this zone warrant heightened position management.
TRADE DIRECTIVE: Await breakout confirmation with concurrent volume expansion. Triangle compression suggests potential catalytic move. Disciplined position-sizing essential given binary outcome structure.
NASDAQ Long ConfirmationsShould price pullback to dig deeper into the highlighted support, look for long confirmations.

HELPFUL SUPPORT AND RESISTENCE INDICATORS & FVGI find these helpful and free as support and resistence thought id share

HELPFUL SUPPORT AND RESISTENCE INDICATORSI find these helpful and free as support and resistence thought id share
Close callWas waiting for this setup, everything ready, then price just left me behind, anyone in this?

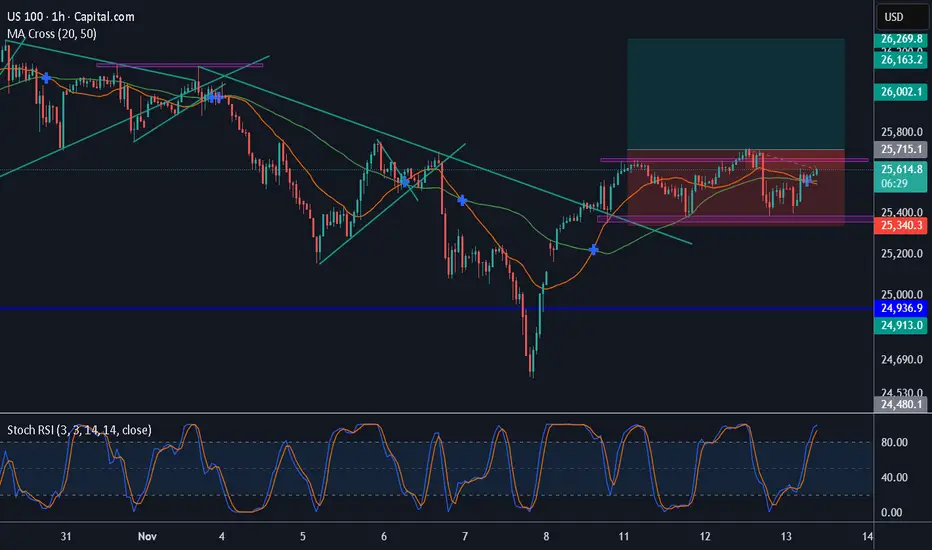
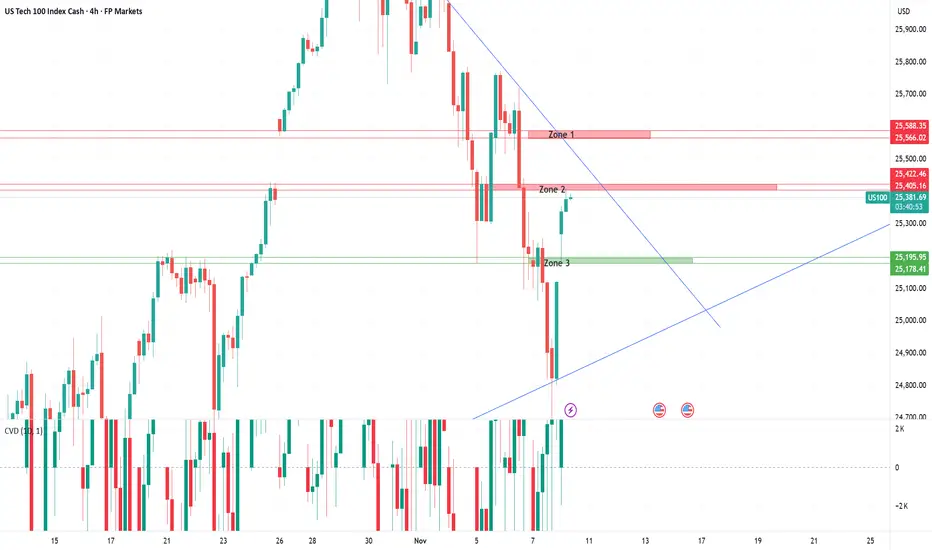
US100 – Trading within a battle of supply and demandUS100 – 4H Technical Zone Analysis
Overall, it remains challenging to define high-probability trading zones in the current environment. Price action is taking place near all-time highs, where volatility is elevated and historical reference points are limited. With sentiment shifting rapidly on macro headlines and thin data visibility, traders should treat each reaction zone with caution and focus on confirmation rather than anticipation.
Zone 1: Former Demand Turned Resistance
This area previously attracted strong buying interest, but sellers have since regained control, forcing price back below the level. The zone now acts as a clear resistance area where supply is likely to re-emerge. A confirmed rejection here would reinforce short-term bearish structure, while a clean break and hold above could signal that buyers are reclaiming dominance.
Zone 2: Minor Reaction Zone / Potential Supply Area
This zone represents a less-defined reaction area where a previous price gap formed, suggesting potential for renewed selling pressure if price revisits it. However, given the lack of strong historical structure, traders should approach this zone with caution and look for clear confirmation before positioning around it.
Zone 3: Former Supply Turned Support
This level previously acted as a ceiling where sellers pushed price lower before a decisive breakout occurred. Since that move, the area has flipped into a supportive base, marking the first meaningful demand zone beneath current price. As long as price holds above Zone 3, the broader structure remains constructive; a confirmed break below would indicate that buyers are losing control.
Macro Overview
The Nasdaq-100 continues to trade near record highs, supported by a mix of resilient economic data, easing inflation pressures, and improving global risk sentiment. The broader tone remains constructively bullish, though investors are increasingly aware that the rally is being sustained more by optimism than by hard data.
Last week’s key drivers included renewed progress in U.S.–China trade talks and a strong set of tech earnings, which reinforced confidence in the growth and AI-led segments of the market. Softer-than-expected inflation readings added fuel to the rally by reviving expectations of potential Fed rate cuts in early 2026. However, policymakers have since pushed back on those assumptions, warning that rate reductions are not guaranteed and that the central bank will remain data-dependent.
At the same time, the ongoing partial U.S. government shutdown continues to delay key macro releases such as employment and CPI reports, leaving both investors and policymakers with limited visibility. This data vacuum makes markets unusually sensitive to headlines and Fed commentary.
Personal Account vs Prop firm TradingHere’s where a lot of traders miss the point.
Prop firms sound good on paper — funded accounts, big leverage, short-term payout structure. That’s attractive to retail and newer traders. But let’s be honest — true SMC traders see deeper.
A prop firm is a classroom. A personal account is freedom.
⚖️ Prop Firms:
• Beginner-friendly, structured, and can help build discipline early.
• But they come with strict rules — max drawdown, time limits, no weekend holds, no high-impact news trading.
• These rules can kill genuine SMC plays, because Smart Money often holds setups that develop midweek and deliver through Friday.
• Some prop firms even close trades automatically during volatile pullbacks — meaning your well-timed institutional entry could be cut off early.
Prop firms test you on rule-following, not market mastery.
💼 Personal Accounts:
• You control risk, timing, trade management, and exposure — full freedom.
• You can hold trades through the weekend, manage partials your way, and let multi-day structures complete.
• You can size positions sustainably — not recklessly, but with intent — and manage equity growth over time.
• It demands mastery, discipline, and emotional control — but that’s the essence of becoming a true trader, not a funded participant.
“Prop firms build discipline. Personal accounts build legacy.”
🧭 My Take:
I respect prop firms — they have their place. But I’m a personal account believer.
Why? Because Smart Money Concepts require freedom to express trade ideas dynamically, without artificial restrictions.
A true SMC trader isn’t trying to pass a challenge — he’s trying to understand and move with the market.
Prop firms serve the student. Personal accounts serve the master.
✍️ Closing Statement
“The real education starts when you stop testing history and start studying live footprints.
Prop firms can train your discipline, but personal mastery is built when your decisions shape your own equity.
Trading is not about probabilities — it’s about reading precision, cause, and intent. That’s the Smart Money way.”

NASDAQ 100-15m Bullish Setup/RiskyChartStructure Breakdown:
Liquidity Sweep: The equal lows taken out near 25,050 indicate engineered liquidity collection.
Displacement: Bullish impulse broke short-term structure, confirming buyers stepping in.
Fair Value Gap (FVG): The shaded blue zone marks the imbalance target where price may rebalance before deciding next direction.
Target Zone: 25,420–25,450 (FVG midpoint / supply area)
Invalidation: A clean 15m close below 25,050 would invalidate bullish bias.
Setup Type: Liquidity Sweep + Displacement + FVG Target
Entry Idea: Buy within the discount range (gray zone) after bullish confirmation
Take Profit: 25,420
Stop Loss: Below 25,050
Risk–Reward: ≈ 1:3 potential

US100 FREE SIGNAL|SHORT|
✅US100 is pushing towards the premium supply zone and after a liquidity sweep above short-term highs we will expect continuation toward the next downside inefficiency as sell-side liquidity gets targeted on Monday!
—————————
Entry: 25,115.5$
Stop Loss: 25,200$
Take Profit: 24,900$
Time Frame: 3H
—————————
** SHORT🔥
✅Like and subscribe to never miss a new idea!✅
