SPY Reaches 2-year Final Target #3 (670) and DropsTrading Fam,
I promised a video update this week. However, due to unforeseen issues with my streaming app, I have opted for a static post instead. Apologies but I'll go through updates on our chart, explaining where we are, and where we might be headed next.
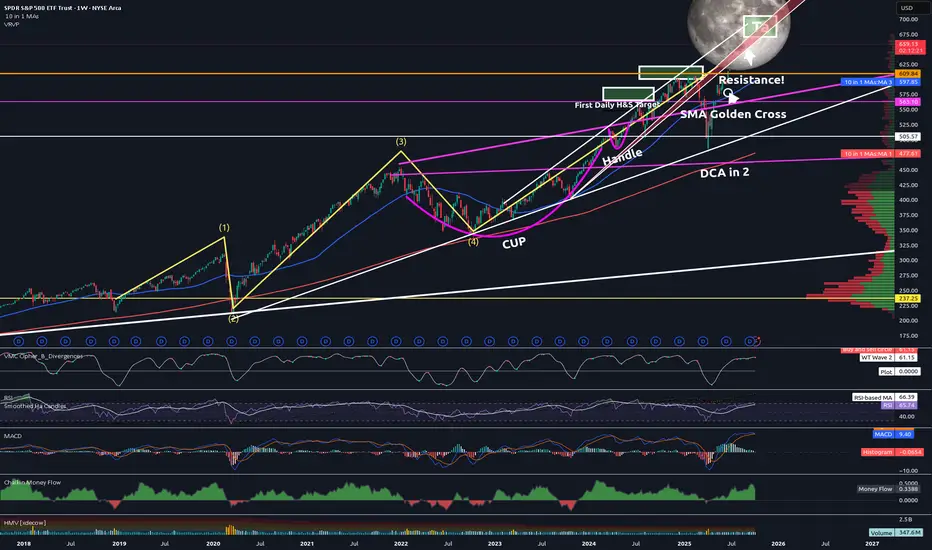
We'll start here with the weekly. I want you to focus in on the yellow Elliot Wave pattern. All along I have stated that I am no Elliot Wave expert. However, I seem to have gotten it right this time ...at least so far.
The first wave starts around Dec. of 2018. We dipped harshly during COVID and that completed our wave (2). The third wave is often long and extended and we hit our top in Jan. 2022. Wave (4) then gave us our dip and the start of our Cup and Handle seen in pink. I don't know much but I do know wave (5) is often equal or greater than (3). I started looking for a final target for wave (5). My Cup and Handle soon offered that target to me.
So now let's zoom into the daily:
You can see Target #1 was nearly hit. You'll remember I sold here due to nearly touching that white uptrend. I waited for the dip back into support (RED) and re-entered focusing in on Target #2 which also coincided with price hitting that white trendline and being rejected. We bounced on that red support again and double-topped. This time we broke through our red support and came all the way down to another support which I expected to hold (white). It did. I then knew we were on our way to Target #3. But I've stated all along that I did not think we'd break back above that previous red support which now has become massive resistance. So far, I have been right. The Cup and Handle pattern also gave me that 670-700 target. Nailed that as well.
Could we go higher? Absolutely. That's what blow-off tops do. They often surprise the market with one final wild ride. Everyone piles in out of FOMO. And I have expected a final price of up to $700 SPY all along. Will this happen? Remains to be seen. But my experience has taught me that we are near the top. And since, I am satisfied with a price of $670 being that this is the beginning of my third and final target box, I pulled most of my personal money out a few days ago. My main goal now is to avoid greed and preserve capital. That is what I will do until the market tells me otherwise.
I want to take one final look at our monthly chart:
See that thick white trendline that starts in 2009? That is the beginning of our secular bull market. This next part is going to sound insane but that is often the case when you read what I write, we could technically drop all the way down to SPY 300, over 55% from where we are right now, and STILL be in a bull market! Can you imagine how many traders will start to scream that the world is ending? And yet, technically the market will remain bullish. Crazy to think about, but definitely worth noting.
✌️Stew
Trade ideas
$SPY | Controlled Correction Before the Next Impulse⚙️ AMEX:SPY | Controlled Correction Before the Next Impulse
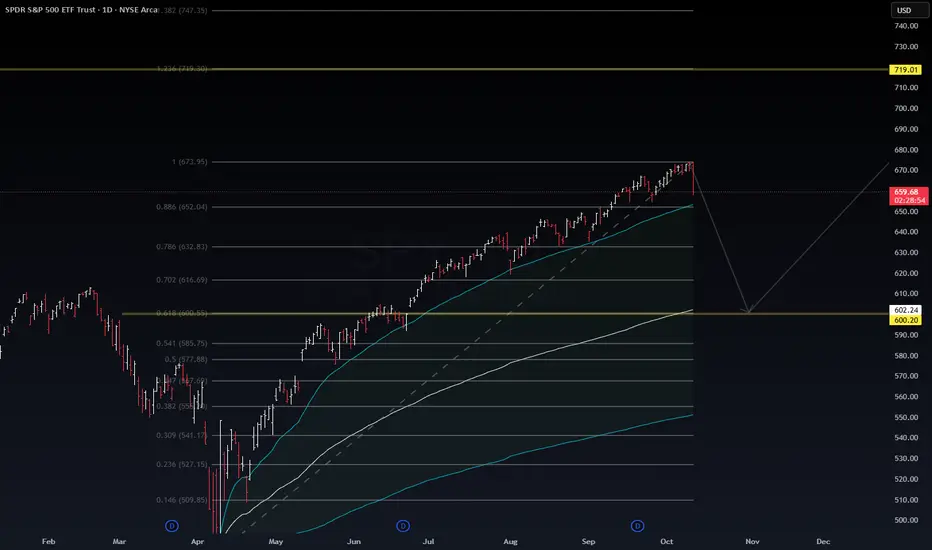
The market just rejected the 0.886 Fib (≈ $673) after months of consistent accumulation and trend extension.
This type of rejection usually signals the transition from a markup phase → corrective rebalancing, often aligning with institutional reallocation or short-term risk repricing.
Technical Overview
Current: $659.4 (rejection from $673)
Support Zone: $610 – $602 → 0.5–0.618 retracement zone
Macro Target: $719 – $747 → 1.236–1.382 Fib extension zone
Momentum: RSI rolling down from overbought; structure confirming controlled decline
Confluence:
50MA & 200MA convergence near $610
Previous breakout base at same zone (April–May support memory)
VolanX DSS Bias
🧭 Short-term: Bearish retracement toward $610 – $602
📈 Mid-term: Accumulation expected before a renewed impulse toward $719+
🧩 Long-term: Structure remains bullish unless we close below $585
Macro Outlook
A correction here isn’t a crash — it’s the necessary reloading before the next leg.
Liquidity sweep + sentiment reset → Q1 2026 could trigger the next cycle rally.
For now, the VolanX system tracks downside liquidity at $610 and $585 before upside recalibration.
Trading Insight
Bearish Play: Short / Put Spread 660→610 (30–45DTE)
Bullish Reversal Play: Long / Call Spread 680→720 (post-610 confirmation)
Risk Management: Maintain macro patience; scaling beats chasing.
VolanX DSS Outlook:
“Liquidity precedes expansion. Rebalancing now, rally later.”
#SPY #VolanX #SmartMoney #MacroAnalysis #Fibonacci #WaverVanir
Opening (IRA): SPY January 16th -575P... for a 5.94 credit.
Comments: Laddering out ... . Targeting the strike paying around 1% of the strike price in credit. Will look to add at intervals, assuming I can get in at strikes/break evens better than what I currently have on and/or roll out short put at 50% max.
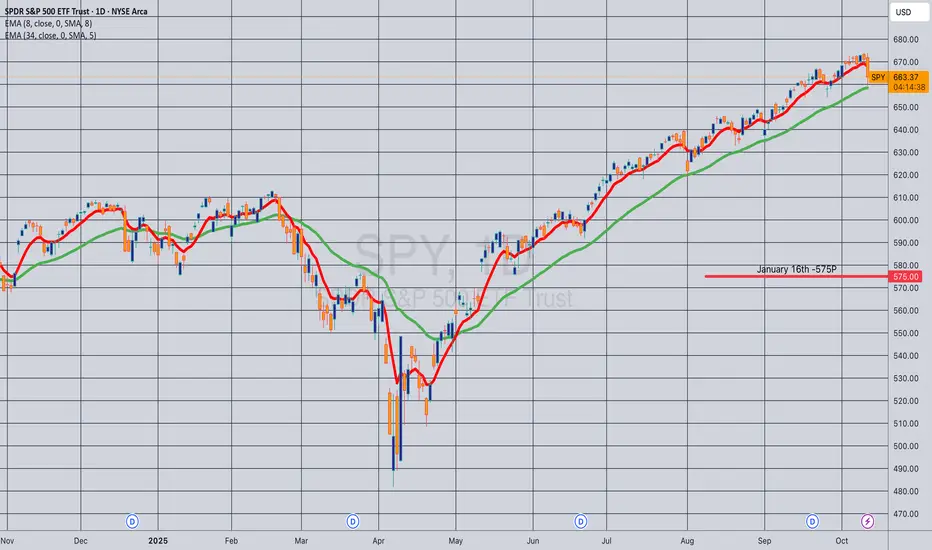
Opening (IRA): SPY December 19th -605P... for a 6.47 credit.
Comments: On second thought, going to ladder out a bit here on weakness plus higher IV. Targeting the strike paying around 1% of the strike price in credit.
Will look at add at intervals, assuming I can get in at strikes better than what I currently have on and/or roll out at 50% max.

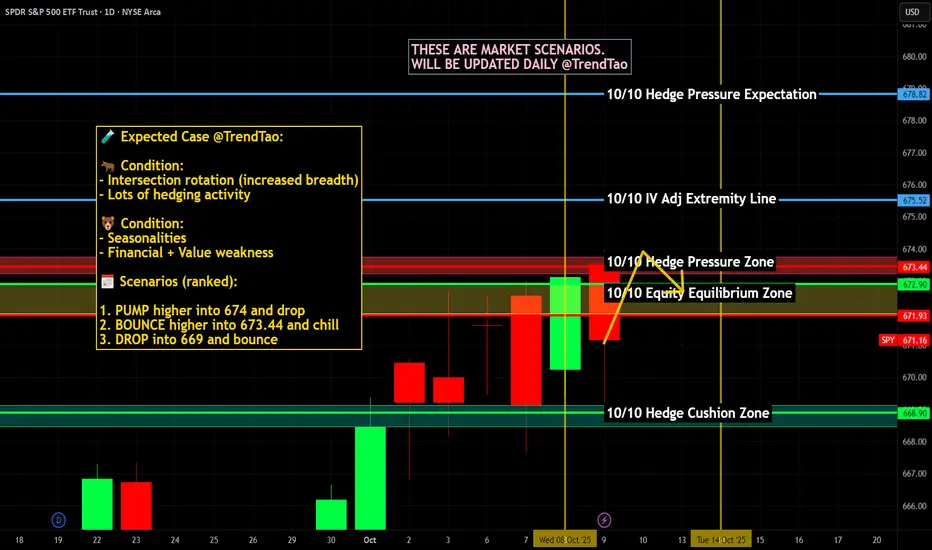
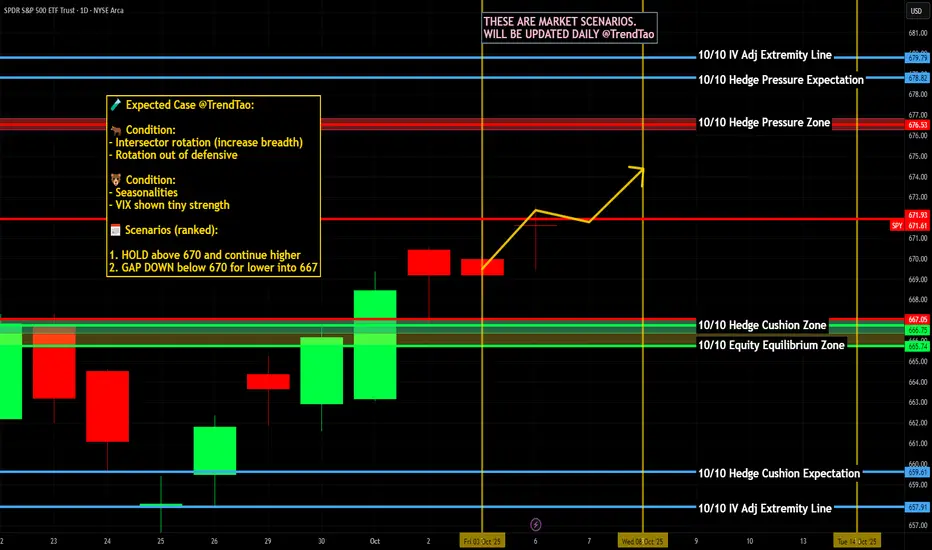
$SPY / $SPX Scenarios — Friday, Oct 10, 2025🔮 AMEX:SPY / SP:SPX Scenarios — Friday, Oct 10, 2025 🔮
🌍 Market-Moving Headlines
🚩 Consumer pulse check: UMich prelim sentiment drops back into focus — inflation expectations will steer bond yields & risk tone.
📉 Shutdown drag: Budget data may stay delayed — leaving traders to anchor on Fed commentary & macro positioning.
💬 Fed watch: Goolsbee’s remarks could frame how policymakers interpret slowing sentiment versus resilient inflation.
💻 End-week flows: Re-balancing pressure + light liquidity could magnify afternoon swings in AMEX:SPY and $QQQ.
📊 Key Data & Events (ET)
⏰ 9:45 AM — Austan Goolsbee (Chicago Fed) opening remarks
⏰ 🚩 10:00 AM — UMich Consumer Sentiment (Prelim, Oct) — Forecast 60.4 | Prior 53.5
⏰ 2:00 PM — Monthly U.S. Federal Budget (Sept) subject to delay due to shutdown
⚠️ Disclaimer: Educational / informational only — not financial advice.
📌 #trading #stockmarket #SPY #SPX #Fed #Goolsbee #UMich #sentiment #budget #shutdown #bonds #Dollar #economy #megacaps
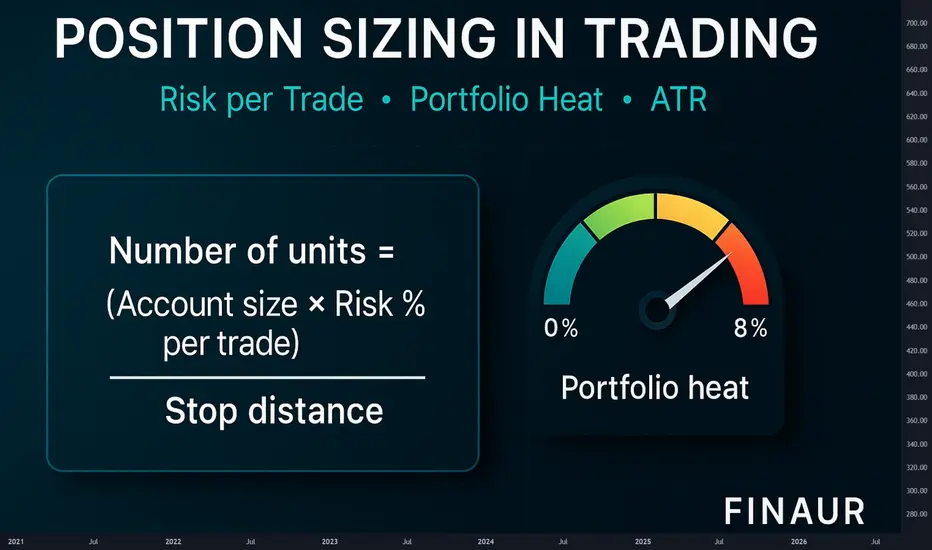
Why traders are losing money? Position Size PurposeWhy traders are losing money
Most traders do not lose because the market is hostile or because entries are bad. They lose because the size of each position is out of sync with account size, with volatility, and with a realistic pain threshold. They also stack correlated exposure until a normal downswing becomes a career ending drawdown. The fix is a repeatable sizing process that keeps losses small, keeps risk per trade constant across regimes, and caps total open risk across the book.
Root causes of loss clustering
Risk per trade that is too large for the real account balance that is available for trading
Stops that ignore volatility so a quiet week and a fast week carry the same unit count while loss size swings wildly
Portfolio heat that compounds across correlated positions in the same theme or factor
Inconsistent exits so a written stop is moved or ignored after the position is open
Scaling rules that add size before the trade earns the right to carry more risk
A review loop that tracks money rather than R so results are not comparable across instruments
One principle to anchor the lesson
Risk lives in the distance between entry and stop. Size lives in how much money you are willing to risk on that distance. Everything else is detail. When you fix these two elements the account stops bleeding from one mistake and the equity curve starts to respect your personal pain limits.
The unit formula in plain words
Units equals Account times Risk percent divided by Stop distance
Stop distance equals Entry minus Stop in price units
For futures or forex convert the distance to money with tick or pip value before you divide
Round the result to the venue step size
Percent risk formula and worked example
Set a realistic risk percent
Pick a range between zero point two five and one point zero percent of account per trade
If you are new stay closer to zero point two five
If you are experienced and you follow rules under pressure stay near zero point five to one point zero
Use only capital that is truly available for trading
Define the stop with intent
You can define a stop by price structure or by volatility. Structure is a level that invalidates the setup. Volatility is a multiple of the average true range. Both work if you keep the rule stable. The aim is not to predict a perfect level. The aim is to measure distance so you can compute size with precision and keep loss per trade constant in money terms.
Volatility aware sizing
When the average true range doubles you must expect larger swings. If you keep the same unit count the same entry to stop distance will cost twice as much. A simple way to neutralise this effect is to tie the stop to a multiple of the average true range and then let the unit count float. When volatility rises the unit count shrinks. When volatility calms the unit count grows. Risk per trade stays constant.
Practice example
Risk money equals one hundred
Stop distance equals three point zero in a calm regime
Units equals one hundred divided by three which is thirty three units rounded
If volatility doubles and the stop distance becomes six point zero the new unit count becomes sixteen units rounded
Loss per trade stays near one hundred in both regimes
Portfolio heat in clear numbers
Portfolio heat is the sum of risk money across all open trades as a percent of account. If you allow the sum to balloon during correlated trends you are betting the entire account on one theme. A simple cap keeps you in business.
Set a heat cap between four and eight percent of account
Count correlated positions as one theme for heat
If a new trade would push heat above the cap you must reduce size or defer the trade
Keep a cash buffer for slippage and gap risk
Heat includes correlated risk. Keep combined open risk under your limit
R multiple as the common unit
R is the unit that equals your risk per trade. If you risk one hundred then one R is one hundred. A two R gain is two hundred. A one R loss is one hundred. Because R normalises money across instruments and timeframes you can compare strategies without confusion. When you review your trades in R the mind stops obsessing about price and starts focusing on process.
Expectancy in words and numbers
Expectancy is the average R result per trade. It depends on win rate and payoff ratio. You do not need equations to grasp it. You can compute it with simple mental math.
Practice example A
Win rate equals forty five percent
Average win equals two point two R
Average loss equals one point zero R
For every ten trades wins contribute nine point nine R and losses subtract five point five R
Expectancy equals four point four R per ten trades or zero point four four R per trade before fees
Practice example B
Win rate equals thirty five percent
Average win equals three point zero R
Average loss equals one point zero R
For every ten trades wins contribute ten point five R and losses subtract six point five R
Expectancy equals four point zero R per ten trades or zero point four R per trade before fees
The shape of expectancy changes when volatility changes. If you keep risk per trade constant and let the unit count respond to stop distance expectancy measured in R will be more stable across regimes. That stability translates into better position control and calmer decision making.
Why money management fails in practice
Traders set a risk percent but do not compute units from entry and stop before the order
They move the stop after position entry and invalidate the size calculation
They add to losers because the entry feels almost right and average down risk with no plan
They never reduce size after a loss streak so the book enters a feedback loop where a normal downswing becomes a spiral
They treat wins as proof of skill and losses as anomalies rather than counting both in R and accepting variance
A position sizing workflow you can follow every time
Write the setup and the trigger in one line
Define the stop with a structure rule or with a multiple of the average true range
Measure the stop distance in price units
Select the risk percent that fits your current equity and your mental state
Convert the stop distance to money if the instrument uses ticks or pips
Compute units as Account times Risk percent divided by Stop distance
Round to the venue step size and check that the notional fits practical constraints
Place the order only after the number of units is in the ticket and the stop is written
Scaling with intent
Scaling is not a trick to force a trade to work. Scaling is a way to stage risk through time. The rule is simple. Add size only after the trade earns the right to carry more risk. Reduce risk when momentum fades or when volatility rises.
One simple scale plan
Enter half size when volatility is rising or when the theme is crowded
Add the second half only after the trade moves one R in your favour
Move the stop to reduce open risk when the second half is added
Do not exceed the heat cap across the book after the add
Compute size. Check heat. Execute only if rules align
Comparator versus buy and hold
Buy and hold does not respect a personal pain limit. It lets drawdown float with price. A sized trade fixes the maximum loss in money terms at the start. The difference is not ideology. The difference is the choice to survive.
Practice scenario
Price falls ten percent after entry in a fast regime
A buy and hold position shows a ten percent account drawdown if one position equals the entire account
A sized trade with one percent risk shows a one percent account drawdown by design
The sized trade can take many attempts because capital is preserved for the next signal
Kelly fraction and optimal f cautions
Kelly and optimal f are powerful in theory. They aim to maximise growth for a known edge. Real trading edges drift and sample sizes are small. Full Kelly creates deep drawdowns and can trigger a behavioural spiral. If you decide to use these methods treat the fraction as a ceiling rather than a target and remain near half Kelly or less. Always measure drawdown in R and reduce size after a loss streak.
Loss streak protocol
Loss streaks are part of variance. A simple protocol keeps them from damaging your decision cycle.
After four consecutive losses reduce risk per trade by half
Freeze adds and focus on clean entries only
Review the last ten trades in R and tag any rule violations
Return to the base risk percent only after a new equity high or after a full week of clean execution
Heat management across themes
The book is a living system. A theme can be a sector a factor a style or a macro driver. If four positions express the same theme treat them as one for heat. The market does not care that the tickers differ. Correlation in stress is the rule. The heat cap is your defence against that correlation.
Fees and slippage discipline
Small edges die from friction. If your average win is near one R and your average loss is near one R you must protect that edge by keeping fees and slippage small. Choose venues with adequate liquidity. Avoid market orders during news bursts. Use limit orders to control entry and exit where practical. Assume a realistic round trip fee in your backtests so that live results match expectations.
Journaling that actually helps
Your journal should capture rules and numbers rather than emotions alone. Use a compact template.
Setup name and trigger
Entry price and stop price
Risk money and unit count
Reason for the stop placement
Exit reason and realized R
Any deviation from the plan
Practice drills to build fluency
Speed matters during live markets. These drills train your sizing reflexes.
Drill one. Percent risk to units
Account equals twenty thousand
Risk equals one percent which is two hundred
Stop distance equals zero point eight
Units equals two hundred divided by zero point eight which is two hundred fifty units
Drill two. Volatility step change
Risk equals one hundred fifty
Stop at two average true range equals three point two which gives forty six units rounded
If the average true range rises by fifty percent the stop becomes four point eight and units become thirty one rounded
Loss per trade remains near one hundred fifty
Drill three. Futures or forex conversion
Risk equals three hundred
Stop equals twenty ticks
Tick value equals twelve point five
Stop distance in money equals two hundred fifty
Contracts equals three hundred divided by two hundred fifty which is one contract with a small buffer for slippage
Drill four. Heat check
Four open trades at one percent risk each looks like four percent heat
If three of them are the same theme treat them as one for heat
Effective heat is closer to three percent and a new trade in that theme should be deferred
Checklist before every order
Is the setup valid according to the written rule
Is the stop defined by structure or by a multiple of the average true range
Have you measured the stop distance correctly
Is the risk percent chosen and written on the ticket
Are units computed from Account times Risk percent divided by Stop distance
Does the book stay under the heat cap after this order
Are you in a loss streak that requires reduced size
Common myths to retire
Myth. Bigger size proves conviction. Reality. Bigger size proves you have abandoned process
Myth. A tight stop is always better. Reality. A stop that ignores volatility will be hit by noise
Myth. Averaging down improves price. Reality. Averaging down expands risk without proof that the idea is valid
Myth. A few big winners will save the month. Reality. A few big losers can end the year
How to adapt across timeframes
The rules above are timeframe agnostic. Shorter timeframes require tighter execution and more attention to fees. Longer timeframes require more patience and a wider cash buffer for gaps. In both cases the math does not change. You measure distance. You set risk money. You compute units. You respect the heat cap. You review in R.
Edge drift and regime change
Edges do not vanish overnight. They drift when the crowd learns the pattern or when macro drivers shift. Your sizing process makes you resilient to drift. Because risk per trade is fixed a flat or negative edge bleeds slowly and gives you time to notice and step back. If you see expectancy in R slide over a thirty or fifty trade sample reduce size and review the rule set before you push the gas again.
Putting it all together
A trader who sizes by feel can enjoy a series of quick gains and then give it back in one week. A trader who sizes by rule can be wrong half the time and still grow steadily. The difference is not superior prediction. The difference is the choice to define loss before entry to respect volatility and to cap heat so a cluster of normal losers does not become a personal crisis.
A compact template you can copy
Setup name and timeframe
Entry trigger in one sentence
Stop rule. Structure or two average true range or another clearly written rule
Account and risk percent
Stop distance in price units and in money
Units computed and rounded to step size
Heat check across the book and across the theme
Planned targets in R and exit rules
Bottom line
Risk per trade must be small and stable
Stops must respect volatility
Portfolio heat must remain inside a hard cap
Review results in R and adjust size after loss streaks
Let the unit count float with volatility so risk money per trade remains constant
Education
Education and analytics only. Not investment advice. Test every rule with historical data before risking capital. The lesson below is theory with practice drills you can apply to any liquid instrument and any timeframe.
Possible Cracks formingSpy would need to get under 665 for there to be any change in character (the 18ma). High yield is showing weakness - a possible recession sign. Gold still strong, but could be stalling here above 4k. BTC may be in a topping process.

SPY at critical point. If we are bullish things may get crazy.So SPY has been in a large channel since the Jan 2018 Trump Top. (Anyone remember that crazy time?) 401k was pumping and then a huge snap back to reality. Well we had covid crash and spending sprees and inflation panic and build back better and tariff wars and now euphoria.
So I think a pullback is in order here... but what if it isn't?
So for fun I figure what if we break out of the channel? We could have a large blow-off top based on the measured move. We could in theory get up to a 75% single year return for the SNP500 (April 2025 to April 2026) Has that ever happened? It would be wild, and is technically speaking in the cards. I think if it did happen it would be the top of the bubble, and if we did swing and do the measured move on the opposite side of the channel we would end up down near the inflation panic of 2022 accumulation zone, also possible depending on a debt bomb that causes social safety-net cuts (See current shutdown) and possible AI bubble pop.
It can happen.
Keep an eye out and be careful out there.
:)

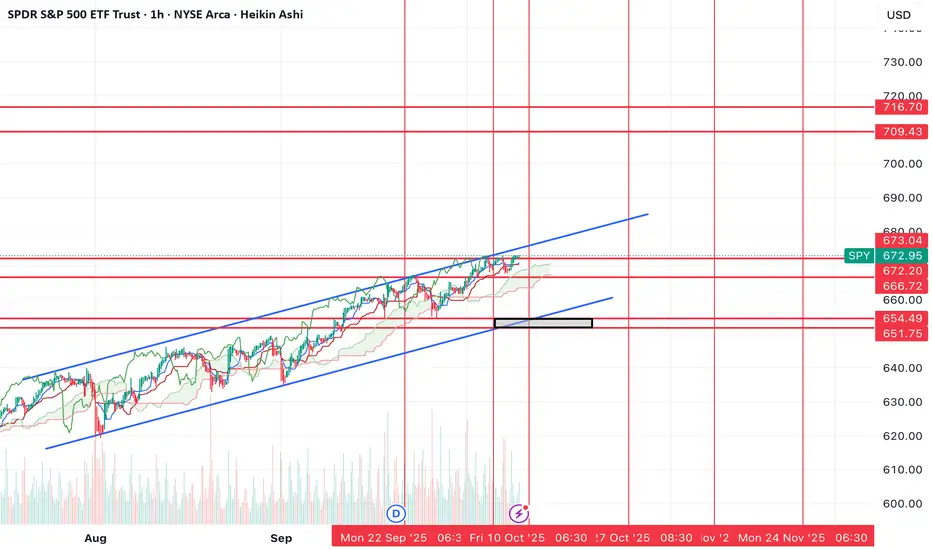
2-3% selloff incoming? Down to $651-655? Then BTD to $700+We've finally hit my target of $672 and while I still think we'll get downside after hitting this target, I don't think the sell will be as dramatic (yet).
I know everyone got bulled up after the price action today, but I think it's wise to be cautious here. Both the chart and the flows are telling me that we're likely to see a bearish move before we see more upside in markets.
I'm not looking for anything crazy, but I think 2-3% down to that $651-655 level is likely.
Then I think that will be a dip buying opportunity and that it's likely that many stocks (including SPY) can see new highs.
I've marked off new resistance levels should this idea play out.
Losing the support levels on the chart would be a caution for lower prices.
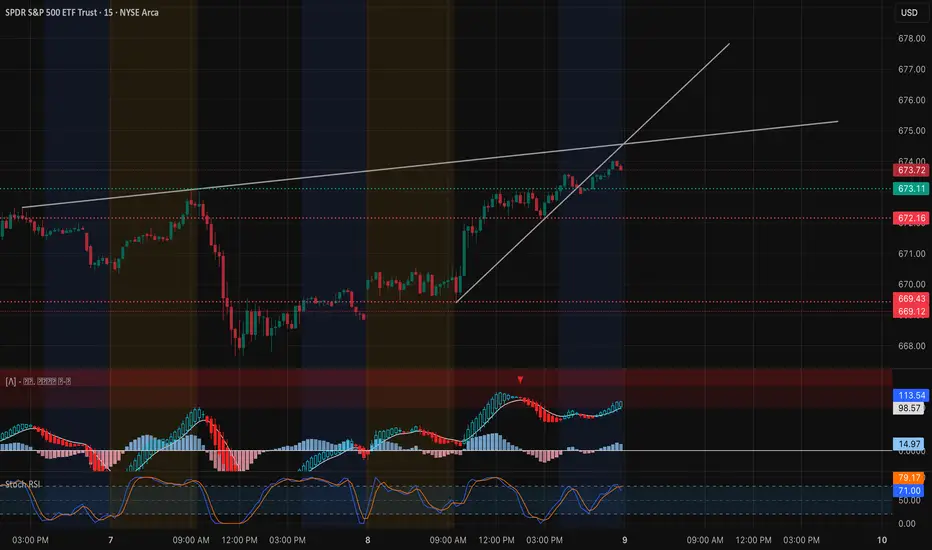
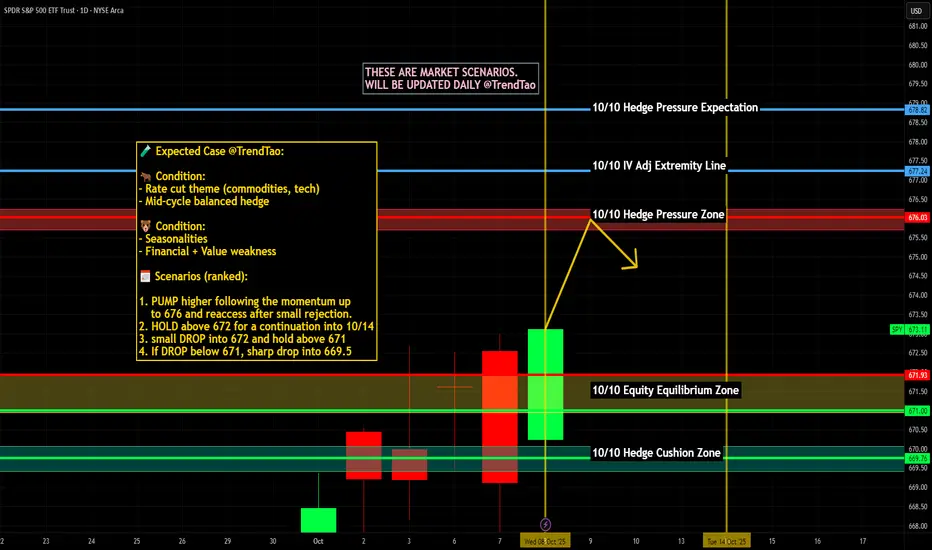
SPY Oct. 9 — Bulls Testing $674 ResistanceEyes on Breakout Toward 676+ 🚀
SPY continues to climb within a strong ascending channel after reclaiming the $670 zone, with bullish structure confirmed through multiple BOS (Break of Structure) and CHoCH points on the 15-minute chart. Price is consolidating just below $674 — the key gamma resistance and intraday supply zone.
MACD shows solid bullish momentum with expanding histogram bars, and the Stoch RSI is elevated but still holding steady, suggesting continuation potential if buyers push through $674. A minor CHoCH printed earlier near $672.1 confirms short-term consolidation before the next leg up.
On the 1-hour chart, SPY remains in a clean uptrend, supported by strong HVL footing near $669, while the highest positive Net GEX / Gamma Wall sits at $673–$675, right where current price is testing. The range compression between $669 and $674 signals that volatility expansion could be imminent.
Support and Resistance Levels:
* Immediate Resistance: $673.72 → $675.0
* Major Resistance (Gamma Wall): $676.5 → $678.0
* Immediate Support: $672.16 → $671.0
* Key Support Zone: $669.4 → $667.5
GEX & Options Sentiment (1H GEX Chart):
* The highest positive Call Gamma concentration lies around $673–$676, forming the current resistance magnet.
* Strong Put Support remains between $665–$667, reinforcing the bullish gamma floor.
* IVR (15.4) is relatively low, suggesting stable volatility conditions; Puts at 56.8% indicate some hedging but not enough to cap upside momentum.
* As long as SPY stays above $669, dealer hedging flows favor gradual upward bias toward $676+.
Trade Scenarios:
Bullish Setup:
* Entry: Above $674 breakout
* Target 1: $676
* Target 2: $678
* Stop-Loss: Below $671.5
* Rationale: Breakout from channel top with bullish MACD momentum and supportive GEX flow could fuel a push toward higher gamma resistance zones.
Bearish Setup:
* Entry: Below $671 breakdown
* Target 1: $669
* Target 2: $667
* Stop-Loss: Above $673.5
* Rationale: A rejection at $674 with fading momentum could trigger a quick pullback to retest lower support and refill liquidity gaps.
SPY continues to trend strong with clear bullish control. A breakout above $674 could open the door to $676–$678, while staying above $669 keeps the bias upward. Traders should watch for volume confirmation on the breakout or a false move back into range.
Disclaimer:
This analysis is for educational purposes only and does not constitute financial advice. Always do your own research and manage your risk before trading.
If anyone needs me to TA any stock, PM me.
$SPY / $SPX Scenarios — Thursday, Oct 9, 2025🔮 AMEX:SPY / SP:SPX Scenarios — Thursday, Oct 9, 2025 🔮
🌍 Market-Moving Headlines
🚩 Powell spotlight: The Fed Chair’s morning remarks set the tone for risk sentiment — traders watching for policy bias hints.
💬 Fed overload: Bowman, Kashkari, Barr, and Daly dominate the docket — expect intraday rate-path chatter.
📉 Shutdown shadows: Jobless Claims* and Inventories* may face data delays; market liquidity remains headline-driven.
💻 Macro rotation: AMEX:SPY trades tightly to yield moves; tech leadership faces cross-currents as real rates stay firm.
📊 Key Data & Events (ET)
⏰ 🚩 8:30 AM — Fed Chair Jerome Powell opening remarks
⏰ 🚩 8:30 AM — Initial Jobless Claims (Oct 4) subject to delay
⏰ 8:35 AM — Michelle Bowman (Fed Vice Chair for Supervision) welcoming remarks
⏰ 8:45 AM — Michelle Bowman speech
⏰ 10:00 AM — Wholesale Inventories (Aug)* subject to delay
⏰ 12:45 PM — Neel Kashkari + Michael Barr discussion
⏰ 3:45 PM — Michelle Bowman speech
⏰ 4:10 PM — Mary Daly (SF Fed) speech
⏰ 9:40 PM — Mary Daly evening remarks
⚠️ Disclaimer: Educational/informational only — not financial advice.
📌 #trading #stockmarket #SPY #SPX #Fed #Powell #Bowman #Kashkari #Barr #Daly #joblessclaims #bonds #Dollar #shutdown #economy #megacaps
SPY: Walking a fine lineIts been a while since I have done a comprehensive written post, mostly because I don't generally have much to talk about.
But buckle up buttercups because its going to be a long one. I got lots to talk about.
Everyone's favourite little SPY. Or, as I like to call it as of this year, this abomination of man. Its up to some serious nonsense currently. But before we get into that, let's just recap on some of my most recent video ideas.
Monthly Outlook
My bias is Bullish.
Mostly because SPY only goes up, but also because we have a bullish gap probability on the month (as well as the average October return being 1.54%) and we are currently over the bullish conditional (being over which increases the probability of hitting high targets).
Let's just recap the monthly with the Seasonally adjusted monthly levels for SPY:
We can see we are clearly overly the bullish threshold, with gap probability biased towards the upside.
Now let's take a closer look at the statistics from recent. Since fake crosses are a thing and SPY has been known to cross on fakeouts:
Now these backtest results are slightly skewed because:
a) These levels are based on October, while how pinescript does the backtest is just each month of recent. The actual backtest results isolated for October I have shared with you in my previous October outlook, but this just gives you a feel for kind of the follow through, we can see that there is better follow through on bearish breaks than bullish breaks, but 15% of bullish crosses fail.
But:
b) The bull market trendline is well in intact, albeit it has not been tested recently (you can see this in the main chart but I will reproduce here for convenience):
c) Our last test of the BMTL (my new abbreviation for Bull market trend line) was on Sept 2nd, with an average of 21 days between re-tests. We are now pushing at 26 days since our last re-test.
This is all fine and dandy, but SPY is showing some trend fatigue and some aeras of concern. We can see the trend fatigue from the PA itself, but here are some quantiative measures of SPY's actual trend (I will add the results for QQQ s well):
I have listed on the daily and hourly. The results are not ideal. The 2 biggest concerns here are:
a) In both cases, entropy is very high, especially on the hourly timeframe (> 0.70). As Entropy approaches 0.75 the probability of a transition / change increases. Not only that, but high entropy causes chaotic price action. Entropy can be seen as a kind of measurement of chaos. The higher the number (the closer to 1) the more chaotic the system is. While it does show as improving, the value is incredibly elevated, especially on the hourly timeframe. This is critical because this greatly increases trader's risk exposure, especially in day trading (the fake breakdown we saw and then reclaim is an example of high entropy and chaos). It urges caution with positions in either direction.
c) The next big red flag is the fleeting volume. This has been consistently visible over the past 2 weeks. What this means is that as price goes up, Volume was not increasing (i.e. there really are no new buyers being enticed). As of this week, its actually fleeting Volume, which means as price goes up, Volume declines. Flat volume are signs of stable trends and can signal that price discovery and harmony has been met. However, declining volume in the face of upward (or even downward) movement raises concerns of trend fatigue / exhaustion.
The rest of the data is so-so, with the exception of QQQ showing structural weakness (i.e. the uptrend is showing signs of faltering).
In general, these metrics would lead one to believe that we are at trend fatigue but is important to understand that trend fatigue does not always = trend correction or selling. Trend fatigue can manifest in different ways, of course selling/pullback is one of them, but other ways are consolidation and more volatile and chaotic price action. We can't be sure which outcome it will do (selling/ consolidation / volatility) but we can be sure that risk exposure will be substantially augmented when you are trading fatigued trends.
But wait, there's more!
In addition to SPY and QQQ's fatigued states, we are seeing increasingly looming fatigue in the market, most notably via chart patterns.
For those who have followed me, you know I love Bulkowski patterns. I have even trained my own Bulkowski model on the top 130 patterns (65 bullish and 65 bearish).
To put it to good use, I created a screener that would screen the top tickers of the indices and have started tracking this. Here are some interesting results:
SPY:
Between yesterday and today, there has been a 3.6% increase in bearish patterns. QQQ slight increase but mostly unremarkable:
Not a significant increase but creeping up with a huge portion of the holdings displaying bearish chart patterns.
Shorter timeframe
With the government shutdown still in effect, the market hasn't had the cycles of news release and the semblance of reality checks it gets from time to time. Perhaps that can be used as the excuse of why SPY broke down from an incredibly bearish wedge, only to reclaim it today:
The government shut down can also account for the increase in entropy. The market has been left "in the dark" and "blinded to reality checks". Though these reality checks tend to be short lived they still do have an initial impact and have helped us pullback in the past.
There is no end in sight for the shut down and thus the market is flying blind and just being left to its own devices.
As such, except the chaos to continue.
But in the shorter timeframe (i.e. into end of week), here are my thoughts and where we currently stand now:
SPY has snagged PL1 on the week and bounced there. We are now at the "Most likely high target" (orange line) with the next anticipated move to 675 (PH1).
If we surpass that, the anticipation is continuation up to 678 on the week (PH2).
There are no outstanding high probability downside targets.
There are some noteworthy things, such as:
a) SPY printed a bearish Heikin Ashi setup on the Daily
Though this is likely to be invalidated.
With a move a bit higher into the end of this week and a bit higher into next week, we would theoretically make a bearish HA setup on the Weekly:
Lots of bearish stuff showing up though its always shaken off and ignored.
The reality is the market is walking a fine line with this elated exuberance that doesn't really make sense if you consider the underlying economic instability. But alas, irrational markets are a hallmark I know quite well. Though since my nascence into the tradingsphere in 2018, this is the most irrational market I have ever traded in my life!
TLDR
As of now, looking for SPY to continue up to 675 and if that is exceeded, next step is 678.19.
Market is walking on a tightrope and may lose its footing at any moment, so be prepared and position accordingly.
As always, not advice and Safe trades!

Bias stays upWe may pullback with the Fomc Minutes today but a test of the low with a bullish divergence on the RSI may be all that is needed to head up to new highs. The Vix is also at a decision point.

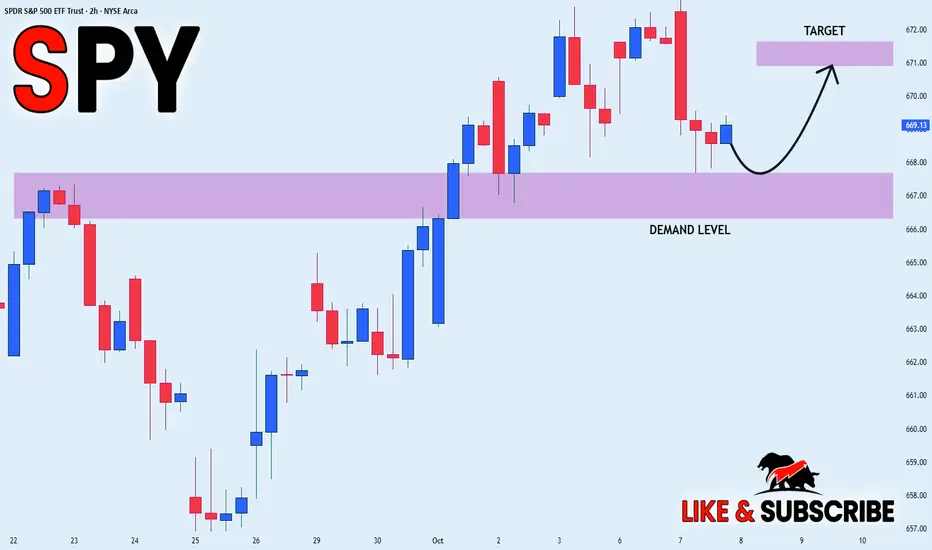
SPY STRONG UPTREND|LONG|
✅SPY showing a strong bullish structure with clear rejections from the demand level. Price continues to form higher lows, confirming institutional support and momentum toward the 671$ target zone. Time Frame 2H.
LONG🚀
✅Like and subscribe to never miss a new idea!✅
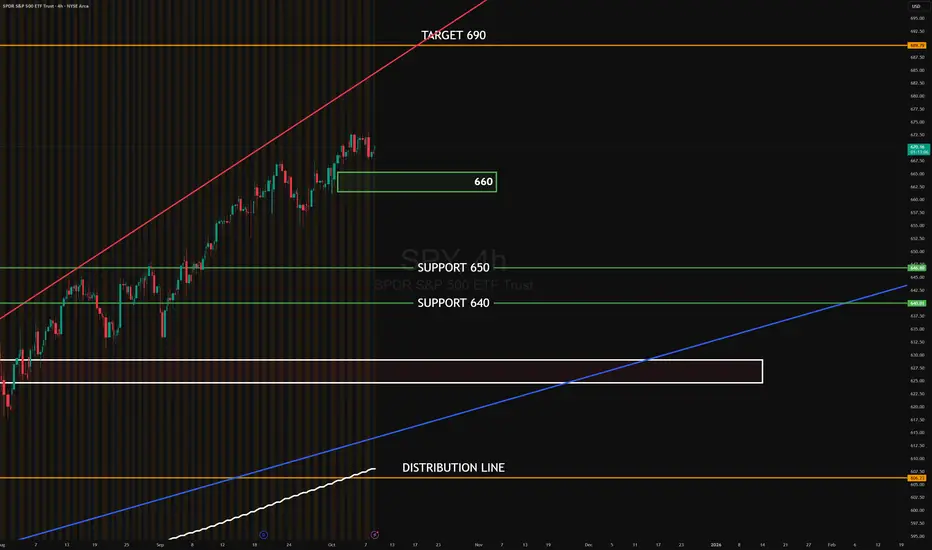
SPY OCT 2025SPY 4H — After the latest push, price is pausing below recent highs. Buyers keep absorbing dips into 660, while sellers are distributing near 675–680. Above 660, the structure still favors continuation toward the upper channel.
Target to the upside: 690
Target to the downside: 660 first; if lost, 650 → 640
#SPY #globaltrade #investment #investing #stockmarket #wealth #realestate #markets #economy #finance #money #forex #trading #price #business #currency #blockchain #crypto #cryptocurrency #airdrop #btc #ethereum #ico #altcoin #cryptonews #Bitcoin #ipo
$SPY / $SPX Scenarios — Wednesday, Oct 8, 2025🔮 AMEX:SPY / SP:SPX Scenarios — Wednesday, Oct 8, 2025 🔮
🌍 Market-Moving Headlines
🚩 FOMC Minutes drop: Traders zero in on the Fed’s tone around balance sheet runoff and rate-cut timing clues.
📉 Macro sentiment reset: Bond yields + USD volatility remain key — equities tracking real-rate shifts post-minutes.
💬 Fed chorus continues: Barr, Kashkari, and Goolsbee headline a dense speaker lineup shaping policy narrative.
💻 Tech leadership check: Mega-caps face another liquidity test as macro dominates tape action.
📊 Key Data & Events (ET)
⏰ 9:20 AM — Alberto Musalem (St. Louis Fed) remarks
⏰ 9:30 AM — Michael Barr (Fed Governor) speech
⏰ 🚩 2:00 PM — FOMC Minutes (September Meeting)
⏰ 3:15 PM — Neel Kashkari (Minneapolis Fed) speech
⏰ 5:45 PM — Michael Barr (Fed Governor) remarks
⏰ 7:15 PM — Austan Goolsbee (Chicago Fed) speech
⚠️ Disclaimer: Educational/informational only — not financial advice.
📌 #trading #stockmarket #SPY #SPX #FOMC #Fed #Powell #Barr #Kashkari #Goolsbee #minutes #bonds #Dollar #economy #megacaps

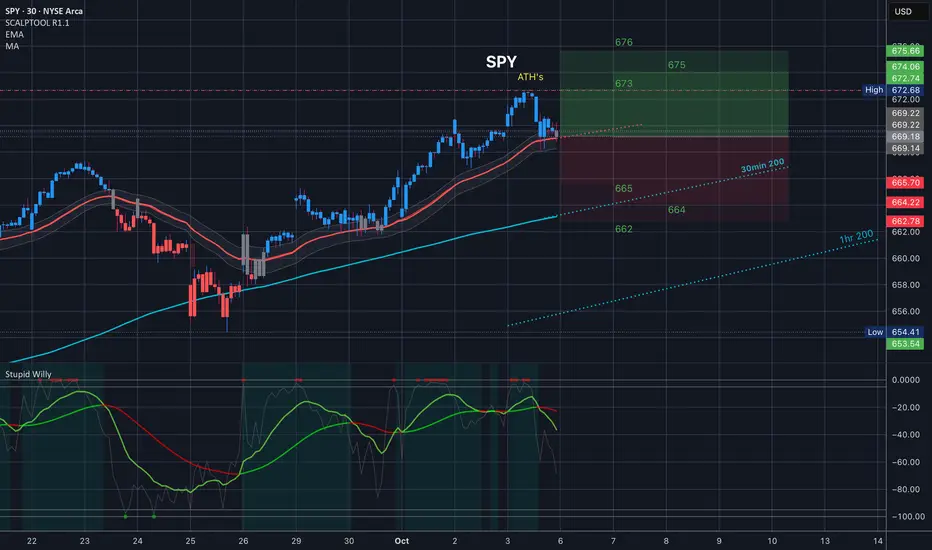
$SPY Near Term Downtrend Confirmed
The Sell signal that we got on Friday was confirmed resistance.
Keep an eye on 671 for resistance / bear call spreads - and look to 30min 200 for support for now

SPY : Stay heavy on positionsSPY : Stay heavy on positions (2x leverage)
Entering a risk-on, high-volatility zone.
In stay light on positions zones, I hold SPY(+QQQ) and reduce exposure.
In stay heavy on positions zones, I increase allocation using a mix of SSO(+QLD) and TQQQ.
** This analysis is based solely on the quantification of crowd psychology.
It does not incorporate price action, trading volume, or macroeconomic indicators.

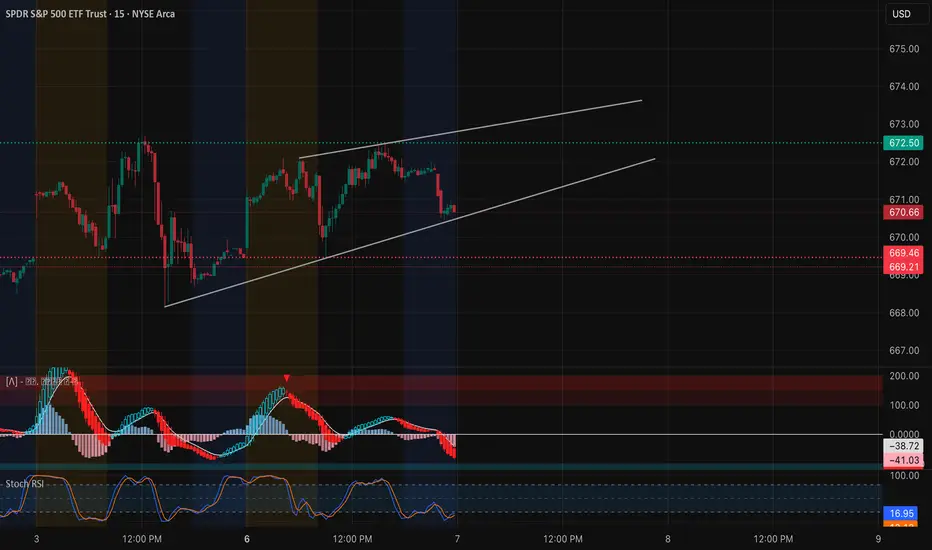
SPY Oct 7 – Bulls Defending the Channel! Watch $672 for Confirm15-Min Chart Analysis (Intraday Trading Setup):
SPY is holding a clean ascending channel structure, consolidating near $670.66 after a mild pullback from the upper resistance zone around $672.50. This intraday pattern shows controlled bullish momentum with shallow retracements — a healthy signal for trend continuation if buyers hold the lower channel.
The MACD is cooling off with red histogram bars, indicating a short-term correction phase rather than full reversal. Stoch RSI near 17 suggests oversold territory, implying potential for a bounce from lower trendline support around $669–$670.
If SPY defends $669, it sets up a possible intraday rebound toward $672.50–$674.00. A breakout above $674 could trigger momentum buying toward $676–$678, completing the next leg of the channel.
However, if SPY loses $668 with volume, it may retest $665–$664 where the next liquidity and minor gamma support reside.
1-Hour GEX Confirmation (Options Sentiment Insight):
The 1-hour GEX landscape reinforces this short-term bullish bias:
* Highest positive NETGEX / CALL wall sits at $674–$675, forming a strong gamma magnet above current price.
* Major PUT walls are clustered around $664–$665, providing sturdy downside defense.
* GEX distribution shows balanced positioning, with dealer exposure slightly net positive, suggesting controlled bullish momentum and lower volatility.
This alignment indicates a likely range expansion to the upside if SPY maintains the $669–$670 base. The gamma structure continues to compress volatility while gradually pulling price toward the $674–$675 region.
My Thoughts:
SPY remains technically constructive above $669, with buyers absorbing every minor dip inside the rising channel. The setup favors a continuation play rather than breakdown — unless there’s a high-volume rejection at $672.
A sustained reclaim above $672.50 would signal that bulls are ready to retest the gamma magnet zone at $674–$675. Conversely, breaking below $668 would be the first warning of weakness, especially if accompanied by rising volume and a MACD crossover.
Momentum and gamma both point to a slightly bullish-to-neutral environment — ideal for disciplined scalps and controlled call positions rather than aggressive swings.
Options Outlook (Oct 7–11):
* Bullish setup: Consider 672C or 675C (Oct 11 expiry) if price holds above $670 and reclaims $672.50 with bullish momentum.
* Bearish setup: Consider 668P if SPY breaks below $668 with confirmed volume spike and MACD crossover.
* IV insight: IVR 15.4, IVx 13.9 — both low, making options relatively cheap for directional trades this week.
Conclusion:
SPY’s trend remains orderly and bullish as long as $669 holds. Watch for a breakout above $672.50 to confirm a run toward $674–$676, with gamma levels acting as the next resistance. A drop below $668 would flip sentiment short-term bearish. Stay patient and let price action confirm the breakout direction.
Disclaimer: This analysis is for educational purposes only and does not constitute financial advice. Always do your own research and manage your risk before trading.
$SPY / $SPX Scenarios — Tuesday, Oct 7, 2025🔮 AMEX:SPY / SP:SPX Scenarios — Tuesday, Oct 7, 2025 🔮
🌍 Market-Moving Headlines
🚩 Shutdown overhang: The U.S. Trade Deficit release remains at risk; traders lean on Fed commentary for macro tone.
📉 Rates + dollar watch: Treasury yields stay elevated ahead of FOMC Minutes (Wed); AMEX:SPY sensitivity to TVC:DXY remains high.
💬 Fed parade: Five speakers on deck — market parsing for any shift in post-Powell narrative.
💻 Tech + liquidity: $AAPL/ NASDAQ:MSFT flows continue driving AMEX:XLK rotation amid tightening liquidity backdrop.
📊 Key Data & Events (ET)
⏰ 🚩 8:30 AM — U.S. Trade Deficit (Aug)
⏰ 10:00 AM — Raphael Bostic (Atlanta Fed) speech
⏰ 10:05 AM — Michelle Bowman (Fed Vice Chair for Supervision) remarks
⏰ 10:45 AM — Stephen Miran (Fed Governor) speech
⏰ 11:30 AM — Neel Kashkari (Minneapolis Fed) speech
⏰ 3:00 PM — Consumer Credit (Aug)
⚠️ Disclaimer: Educational/informational only — not financial advice.
📌 #trading #stockmarket #SPY #SPX #Fed #Powell #Bostic #Bowman #Kashkari #Miran #tradebalance #shutdown #bonds #Dollar #megacaps #economy
October 6 - October 10 2025For this week, my bias is neutral/leaning bearish, however I will not fight the trend if my technical indicators give clear bullish signals. I believe the government will stay shut down for a while, as both parties are at an impasse and the administration will use the shutdown as an opportunity to advance its agenda against the federal workforce and non-aligned spending programs, rather than make concessions early on. Unless the opposition is willing to abandon its position with little to no gain, the possibility of this ending soon remains low in my view. Official economic data is currently on hold, so for the time being the stock market is operating with little fundamental basis and as a result, technicals could carry more weight.
1. Macro
Data from the Federal Reserve is currently delayed or on an indefinite hold, making the Real Yield of bonds ambiguous. Regardless, not much has changed since last week. The Dollar is starting out slightly above average but still flat - which should continue since there will be no policy changes or inflation data during the shutdown.
Yields have remained relatively flat but the 10Y yield is rising at a faster pace than the 3M yield, which can be seen on the bottom left chart that shows the spread. I’m not reading into the technicals too much here, however it will be important to see if this makes a higher high (spread widening, 10Y rising and/or 3M falling) or a lower low (spread tightening/inverting). Neither would be a particularly good sign but the former would likely be better received than the latter when it comes to stocks. As with the dollar, I think yields will remain relatively flat for the same reasons, which will prevent bond-market moves from being a driver.
My sentiment on commodities is roughly the same. Gold continues to rally, Oil may be in a downtrend, Copper ripped higher, and Corn stayed flat. Aside from Gold, I do not see anything on the charts of these commodities to provide a clear indication of a change in the growth or inflation outlook.
2. FX
Nothing new and worthy of note here. Yield spreads in the US and Britain (Black, Red) remain tight compared to elsewhere, but the higher yield may be a tailwind keeping the dollar steady. Over the past three months, the dollar has performed sightly better proportionately compared to other currencies, however it is still down significantly on the Year.
3. Risk
The top left chart is the option-adjusted spread of High Yield and Investment Grade corporate bonds indexed to 100. I’m not seeing an upside movement developing here yet (risk-off signal). On the middle chart, S&P Futures continue to significantly underperform Gold, fueled by the Gold rally and S&P making incremental gains. On the top right, I am starting to track the $NQ1!/YM1! spread to see how the mega caps are performing against companies in more traditional industries. Here it is clear that ever since the market bottomed in April, Nasdaq has been significantly outperforming the Dow Jones, however it appears this spread is set to tighten - either by Dow rising while Nasdaq stays flat/falls or Nasdaq falling proportionately more than Dow.
Notice how the Nasdaq/Dow curve started to flatten around the same time that Gold started to significantly outperform the S&P. I think this is an indicator that growth stocks will see pressure in the near future, and that we may currently be seeing rotation into safer sectors . This is evident in the outperformance of Industrials, Financials, Healthcare, and Utilities compared to growth sectors like Tech last week.
4. Options Chain
Gamma flip-flopped last week, making options data a misleading indicator unless you’re really in the know. With little fundamental backing, I expect dealers will assert more control than what is typical. Friday ended with most of the calls on volume getting taken out while paying some puts. Heading into this week, gamma on AMEX:SPY should keep the price from rising above $672 or falling below $665 on Monday .
5. Bias
I’m going to split these screenshots up to make it easier to see what I’m looking at.
On my technical indicator chart, last week’s Weekly CVD (black) did not see a strong directional movement, although it remained below the zero line for most of the week, suggesting order flow favored the sell side despite the price reaching new ATHs.
Anchored OBV also suggests that last week was a battle between both sides.
Line break is great as a momentum indicator and has been flipping between both sides since October 1st. CME_MINI:ES1! will need to make a new ATH and break above the resistance and close on the 1h timeframe to print a bullish bar, so right now I think the momentum is more to the downside.
On Renko, which is my main chart, taking a purely technical read using the Wyckoff Method, I think this structure is bullish overall unless we see a swift move to the bottom of the range. Otherwise, it is fairly likely that we will at least see a pull back into the range. VWAP is set to Monthly to show we’re still above but could see a trend shift in the monthly frame of reference by breaking below it. How the price respects this range will be important to watch.
Lastly, when looking at the 4h chart on VIX, it appears to be coiling although it has remained mostly flat. VIX is outperforming its on volatility and the volatility of bonds, suggesting that any spikes are not part of larger risk-off positioning yet.
——————
My overall interpretation for this week is that although the Macro side remains roughly unchanged, I still retain my bias that the market is positioning for disappointing growth and clearly continues to show a preference for gold over stocks (heavy hedging). The absence of data reports due to the shutdown that could have validated these concerns (notably payrolls) have allowed dealers to assert more control over the price. For this reason, I will keep a close eye out for any changes and will adjust if the technicals on my Bias chart support a bullish position, but for now my near-term short target is to move back down to $666 .
SPY Coiling Below Gamma Wall — Volatility Loading Into Oct. 6 Market Overview (15-Min Chart)
SPY finished Friday consolidating within a tight descending channel after a strong early session rejection from $672.60–$673, forming a potential bullish flag structure. Price action shows a short-term base developing near $669, with visible liquidity defense and lower wicks suggesting buyers are absorbing pressure.
The MACD histogram is starting to flatten after a deep red phase, while both MACD lines are curling upward — a subtle momentum shift hinting at possible recovery attempts early in the session. Meanwhile, the Stoch RSI is elevated, indicating SPY may attempt another push toward the upper trendline before confirming direction.
This setup paints a picture of compression after expansion, with price resting right below key gamma resistance — a classic sign that the next impulse move could define the week’s tone.
GEX Confirmation (1H Chart Insight)
The 1-hour Gamma Exposure (GEX) data adds crucial institutional context: the highest positive NET GEX and CALL resistance sits near $672–$673, precisely where SPY faced rejection. This confirms that dealers are currently hedging defensively, making that zone a strong ceiling unless sustained volume breaks through.
Below, the PUT support wall is dense between $666–$667, marking the key gamma floor. Dealers’ short gamma positioning means a sharp move below could trigger delta-hedge selling, accelerating volatility.
With IVR at 15.8 and IVX avg 13.6, implied volatility remains low — signaling a potential volatility expansion ahead. Notably, PUT positioning at 64.2% suggests sentiment is still cautious, but this imbalance could amplify a short-cover rally if bulls reclaim momentum above $670.
Trade Scenarios for the Week (Oct. 6–11)
Bullish Case:
If SPY breaks and sustains above $671, it may unlock a clean run toward $673.20 and potentially $676, where the 3rd Call Wall aligns.
* Entry: Above 671
* Target 1: 673.2
* Target 2: 676
* Stop-Loss: Below 668
Bearish Case:
If SPY fails to reclaim 671 and breaks below $667, the path opens toward $665, the next major gamma pocket. Watch for accelerated selling if that level gives way.
* Entry: Below 667
* Target 1: 665
* Target 2: 662
* Stop-Loss: Above 670
Option Insights
The GEX structure shows compression between 667–672, signaling that SPY is coiling before a breakout. With PUT dominance, a short squeeze scenario becomes possible if price holds above $670 and dealers unwind short delta exposure.
Traders could look at call spreads (671–676) for upside momentum confirmation or put spreads (667–662) if downside pressure persists. The low IVR supports directional debit plays with defined risk.
My Thoughts
SPY is sitting at the crossroads of gamma and structure. The $669–$672 zone defines this week’s battlefield — a breakout above could spark a quick volatility pop toward $676+, while a rejection and break below $667 reopens the path to $665 support.
Momentum indicators are neutralizing, suggesting a larger move is imminent. I’ll be watching Monday’s open for a decisive candle: a clean break outside the channel will likely set the trend for the rest of the week.
This is one of those “calm-before-the-storm” setups where positioning and timing will matter more than prediction.
Disclaimer:
This analysis is for educational purposes only and does not constitute financial advice. Always perform your own due diligence and manage risk responsibly before trading.

$SPY Tomorrow's Trading range 10.6.25
We closed right at the 35EMA so that is righ in the middle and will be a key level. 30min 200MA is just underneath the bottom of the implied move so if for whatever reason we come near it look to it as a support to pop us back into the implies move. And of course above us we have ATH's.
Just .5% implied tomorrow so don't get crazy...