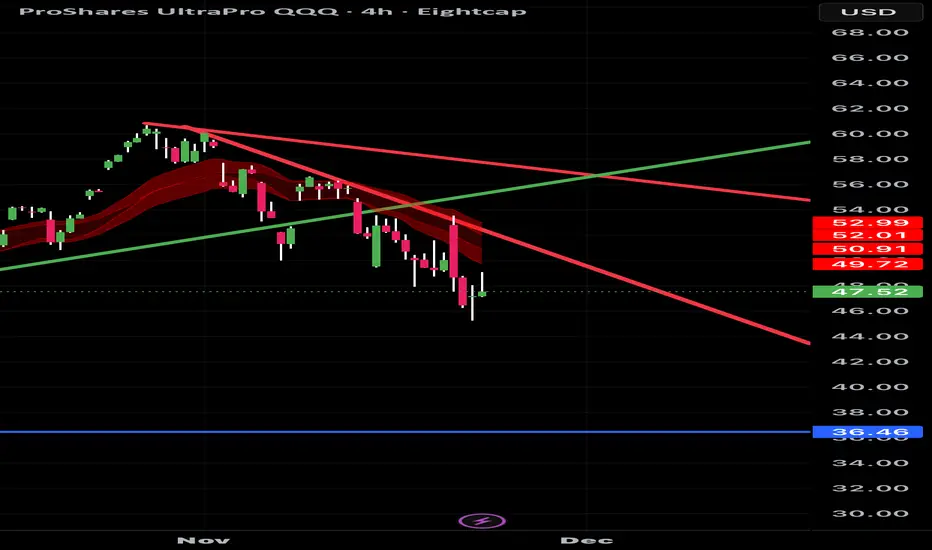
Short trend line Simple trend line break is looking short from here until we break back above the downward trend line.
Trade ideas
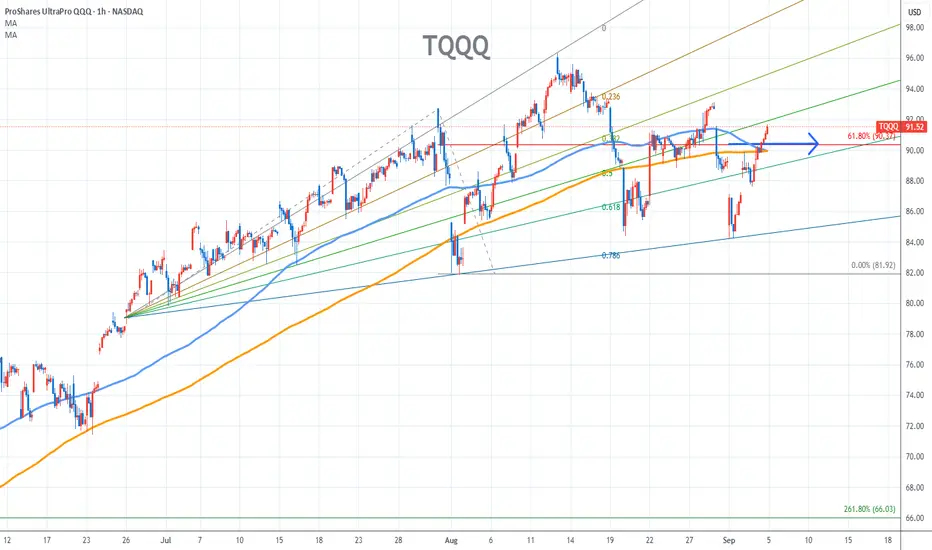
TQQQ Stock Chart Fibonacci Analysis 090425Trading Idea
1) Find a FIBO slingshot
2) Check FIBO 61.80% level
3) Entry Point > 90/61.80%
Chart time frame:B
A) 15 min(1W-3M)
B) 1 hr(3M-6M)
C) 4 hr(6M-1year)
D) 1 day(1-3years)
Stock progress:A
A) Keep rising over 61.80% resistance
B) 61.80% resistance
C) 61.80% support
D) Hit the bottom
E) Hit the top
Stocks rise as they rise from support and fall from resistance. Our goal is to find a low support point and enter. It can be referred to as buying at the pullback point. The pullback point can be found with a Fibonacci extension of 61.80%. This is a step to find an entry-level position. 1) Find a triangle (Fibonacci Speed Fan Line) that connects the high (resistance) and low (support) points of the stock in progress, where it is continuously expressed as a Slingshot, 2) and create a Fibonacci extension level for the first rising wave from the start point of the slingshot pattern.
When the current price goes over the 61.80% level, that can be a good entry point, especially if the SMA 100 and 200 curves are gathered together at 61.80%, it is a very good entry point.
As a great help, TradingView provides these Fibonacci speed fan lines and extension levels with ease. So if you use the Fibonacci fan line, the extension level, and the SMA 100/200 curve well, you can find an entry point for the stock market. At least you have to enter at this low point to avoid trading failure, and if you are skilled at entering this low point, with the fibonacci6180 technique, your reading skill of to chart will be greatly improved.
If you want to do day trading, please set the time frame to 5 minutes or 15 minutes, and you will see many of the low points of rising stocks.
If you prefer long-term range trading, you can set the time frame to 1 hr or 1 day
TQQQ Momentum Meets Options Flow | $92 Call YOLO?”
# 🚀 TQQQ Weekly Options Trade Idea (2025-09-03)
### 📊 Market Recap
* **Weekly RSI**: 🔥 70.9 (bullish)
* **Daily RSI**: 😐 49.7 (neutral)
* **Options Flow**: 💎 Strongly bullish (C/P = 1.78)
* **Volume**: 📉 0.9x (weak confirmation)
* **VIX**: ✅ Favorable (\~16–17)
👉 **Models Split:**
* 🐻 Gemini → **NO TRADE** (daily/weekly misaligned, weak volume).
* 🐂 Claude, Llama, DeepSeek → **BUY \$91.50–92.00 CALL** (tight stop, quick exit).
---
### ✅ Consensus Trade Setup
```json
{
"instrument": "TQQQ",
"direction": "call",
"strike": 92.0,
"expiry": "2025-09-05",
"entry_price": 0.65,
"profit_target": 1.15,
"stop_loss": 0.35,
"size": 1,
"confidence": 0.66,
"entry_timing": "open"
}
```
---
### 🎯 Trade Details
* 📌 **Strike**: \$92 CALL
* 💵 **Entry**: 0.65 (ask @ open)
* 🎯 **Target**: 1.15 (+77%)
* 🛑 **Stop**: 0.35 (–46%)
* 📅 **Expiry**: Sep 5 (2 DTE)
* 📈 **Confidence**: 66%
* ⏰ **Max Hold**: Exit by Thu EOD (⚠️ avoid Friday gamma)
---
⚠️ **Risks**
* Weak weekly volume = 🚨 reduced conviction
* Daily RSI neutral → rally may stall
* Theta burn + gamma whipsaws with 2 DTE ⚡
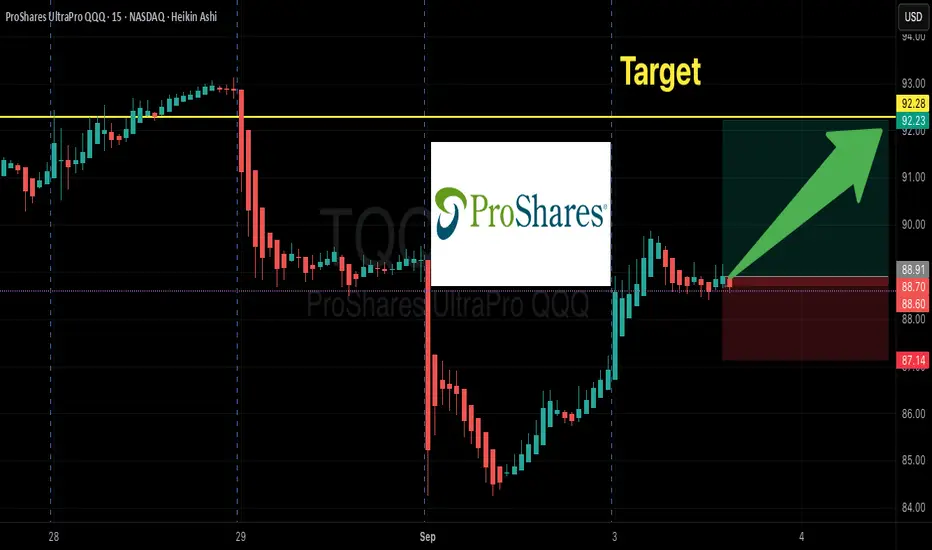
ProShares UltraPro QQQ (TQQQ) LONGThe Technology Sector Continues to Break Records
The tech sector keeps setting new highs, and alongside individual stocks, it's a great idea to consider investing in an ETF that mirrors the profits of the NASDAQ 100 index. One of the most attractive options is TQQQ - it’s more affordable than the index itself, yet offers similar growth potential aligned with the entire tech sector.
I expect continued growth through the end of the year, assuming the geopolitical landscape remains relatively stable.
From a technical standpoint, those looking to minimize risk might prefer to wait for a retest of previous highs. However, my approach is to gradually build a position both before the breakout and after the retest of the highs.
A classic technical analysis pattern -the cup formation, also supports the bullish case for entry. As George Soros wrote in his book: “What moves the market : our expectations or the events themselves?” I’d say it’s both. The key is not to miss the wave.
P.S. Don’t forget: with TQQQ, you also receive dividends - a nice bonus while riding the trend.
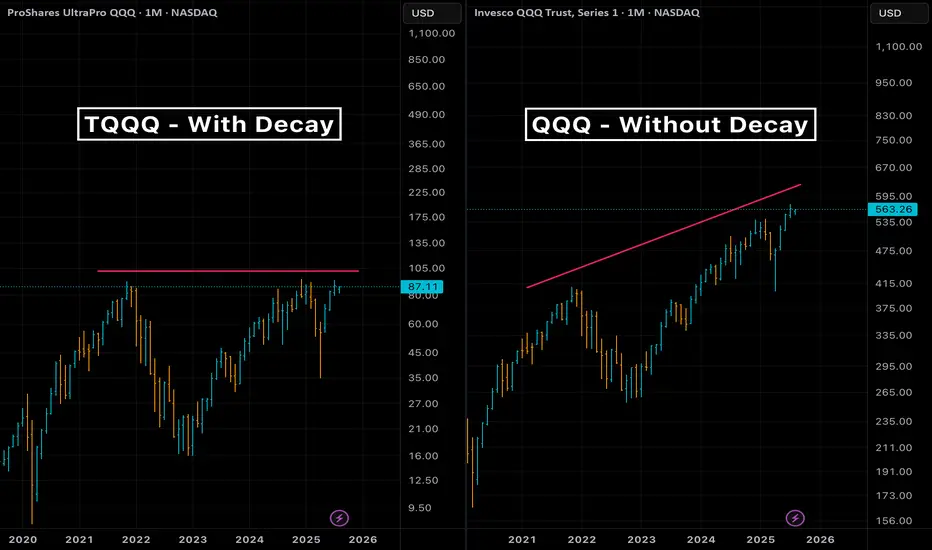
Turning leveraged ETF decay into preyWelcome to this guide on harnessing the natural decay in leveraged ETFs as a strategic edge, rather than fighting against it. We’ll assume you have a basic understanding of options and are comfortable using at-the-money (ATM) strikes as a conservative reference point—advanced users can tailor strike selection to their own edge.
Overview of Leveraged ETFs
What they are and how they reset
• Leveraged ETFs (e.g. NASDAQ:TQQQ , NASDAQ:SQQQ ) aim to deliver a constant multiple (×2 or ×3) of daily returns of an index.
• Inverse ETFs provide –2× or –3× daily exposure without using options.
• Daily reset and compounding create path dependency, leading to “decay” over multi-day holds.
The Decay Mechanism
A quick reminder
• Volatility drag (aka “gamma decay”) causes leveraged ETFs to underperform their stated multiple over longer horizons in sideways or choppy markets.
• The longer you hold beyond one day, the more cumulative leak you face.
Using Decay as a Tailwind
• Rather than avoiding decay, structure trades to benefit from it when your directional bias is robust.
• Combine traditional technical setups with the telescoping of leverage + decay to magnify returns on the correct market view.
• Small notional capital can control large effective exposure via a leveraged ETF + ATM option.
Strategy Execution
• To short the market : buy long puts on a bullish leveraged ETF (e.g. NASDAQ:TQQQ puts).
• To go long the market : buy long puts on an inverse leveraged ETF (e.g. NASDAQ:SQQQ puts).
• Use ATM options for defined risk and to capture both directional move and extra tailwind from ETF decay.
• Position size example: controlling $10k of market exposure might only require $200–$500 in option premium, depending on expiry.
Time Horizon for Decay Tailwind
• Empirically, decay compounds meaningfully over more than one trading day.
• Short-term horizons (2–5 trading days) often capture a useful drift without excessive market risk.
• Back-test your preferred ETF to find the sweet spot for your volatility regime.
High-Volume ETFs to Watch
Bear (inverse) ETFs:
• AMEX:BITI • AMEX:LABD • NASDAQ:SQQQ • AMEX:TZA • AMEX:SOXS • AMEX:SPXS
Bull (long) ETFs:
• AMEX:BITU • AMEX:LABU • NASDAQ:TQQQ • AMEX:TNA • AMEX:SOXL • AMEX:SPXL
Closing Thoughts & Disclaimers
This tutorial highlights how to position decay as a tailwind when your outlook aligns with market direction. Leveraged instruments and options carry amplified risks—only trade with capital you can afford to lose and always define your risk parameters before entry.
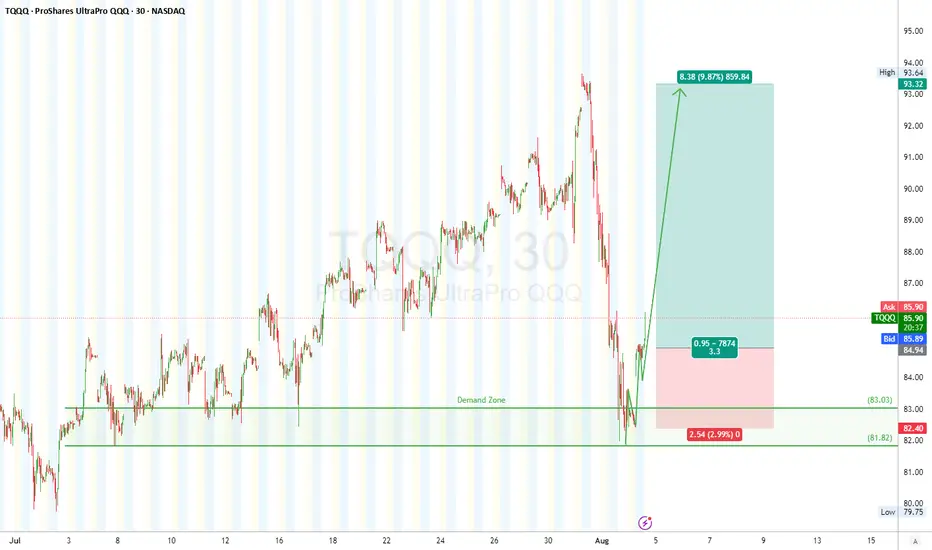
TQQQ Long SetupTQQQ 30-min Chart
Classic textbook move — 5-wave dump, corrective ABC grind, RSI divergence, and now we’re gunnin’ for that sweet Wave (3) explosion. Bulls sniped the bottom like sharpshooters at \$82–83. Strap in — this one’s cookin’ for a breakout!
### 🟩 **Demand Zone (Reversal Area)**
* Strong **demand zone** between **\$82.40 – \$83.75**, confirmed by previous price reactions and RSI divergence.
* Price reacted perfectly at this demand zone, tagging bottom at **\$81.82**.
### 🟥 **Supply Zone (Target Area)**
* Initial resistance/supply around **\$93.30 – \$94.00** — end of Wave (1) structure and prior sell-off zone.
### 🧾 **Trade Setup (Long)**
* **Entry:** \$84.06 (already triggered)
* **Stop Loss:** \$81.82 (beneath the low of Wave (2))
* **Take Profit:** \$93.30 (top of Wave (1) — valid for Wave (3) rally)
* **Risk/Reward:** \~**1:3.3** (Solid R\:R setup)
*“The goal of a successful trader is to make the best trades. Money is secondary.”* — Alexander Elder
### ⚠️ **Disclaimer**
This analysis is for educational purposes only and not financial advice. Always do your own research and manage risk accordingly. Trade safe! 💼📉
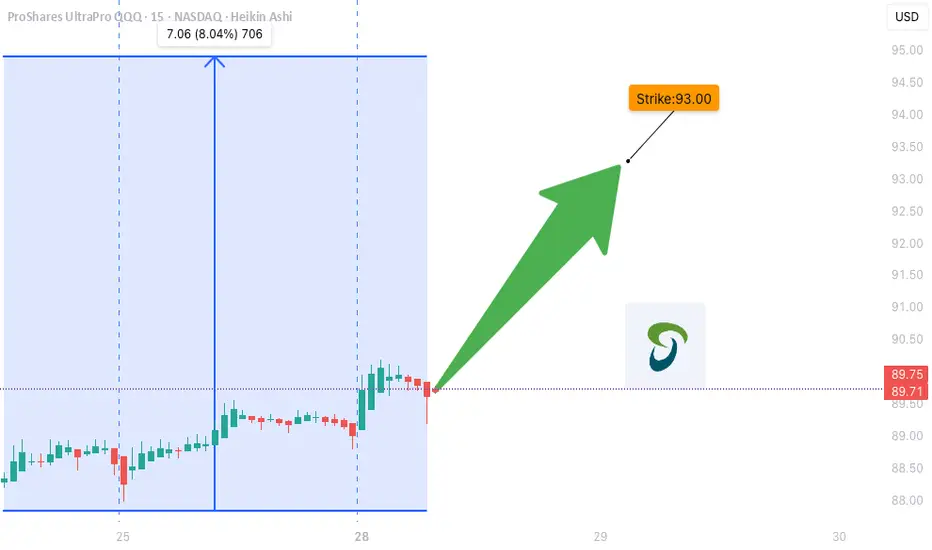
TQQQ WEEKLY TRADE IDEA (07/28/2025)
**🚀 TQQQ WEEKLY TRADE IDEA (07/28/2025) 🚀**
**Triple-Leveraged Momentum Play — But Watch the Volume Trap!**
---
📈 **Momentum Snapshot:**
* **Daily RSI:** 75.0 ⬆️
* **Weekly RSI:** 70.1 ⬆️
🔥 Bullish across **all timeframes** = strong trend confirmation
📊 **Options Flow:**
* **Call Volume:** 24,492
* **Put Volume:** 18,970
* **C/P Ratio:** **1.29** → Institutional bias = **Bullish**
📉 **Volume Concern:**
* Weekly volume = **0.8x** previous week
⚠️ Weak participation could limit breakout strength
🌪️ **Volatility Environment:**
* **VIX < 20** → ✅ Great for directional plays
---
🔍 **Model Consensus Recap:**
✅ All reports agree on bullish momentum
✅ Favorable volatility = cleaner setups
⚠️ Volume is the only red flag
📌 Final Take: **Bullish, but be tactical**
---
💥 **RECOMMENDED TRADE SETUP (Confidence: 75%)**
🎯 **Play:** Buy CALL Option
* **Strike:** \$93
* **Expiry:** Aug 1, 2025
* **Entry Price:** \~\$0.79
* **Profit Target:** \$1.58 (🟢 2x Gain)
* **Stop Loss:** \$0.39 (🔻 50% Risk)
📆 Entry Timing: Market Open
📏 Position Size: 2–4% of account
---
⚠️ **Key Risks to Watch:**
* 🔍 **Volume Trap**: Weak volume = fragile follow-through
* ⚡ **Gamma Risk** into expiry → price may swing quickly
* 📉 Avoid chasing — stick to setup, use stop-loss
---
📌 **JSON FORMAT TRADE DETAILS (Automation-Ready):**
```json
{
"instrument": "TQQQ",
"direction": "call",
"strike": 93.0,
"expiry": "2025-08-01",
"confidence": 0.75,
"profit_target": 1.58,
"stop_loss": 0.39,
"size": 1,
"entry_price": 0.79,
"entry_timing": "open",
"signal_publish_time": "2025-07-31 09:29:00 UTC-04:00"
}
```
---
**TL;DR:**
✅ RSI momentum = 🔥
📈 Call flow = ✅
⚠️ Volume = 🟡 Caution
🎯 \ NASDAQ:TQQQ breakout play for the bold
💬 Are you riding the 3x bull, or waiting for confirmation?
\#TQQQ #OptionsTrading #MomentumSetup #UnusualOptionsFlow #TradingView #TechStocks #QQQ #LeveragedETF
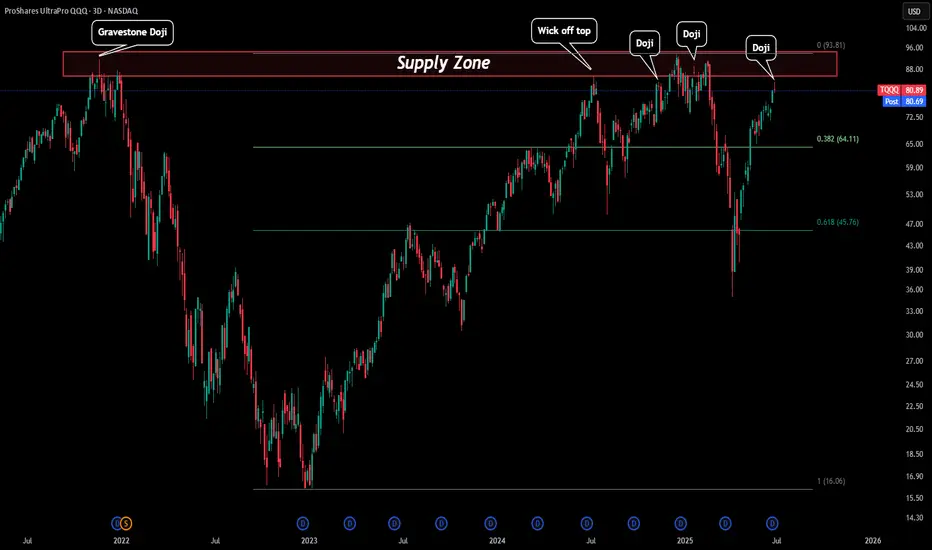
TQQQ - Red Days Ahead?TQQQ just created a 3D doji. The reason this is important is everytime we have seen reversal candles close to or in our red box (Supply zone) usually we see selloffs follow.
Price came very close to the red box and created a 3D reversal doji that could signal some downside price action. If this is to occur the first level to watch would be our 0.382 Fibonacci level around $65.
$TQQQ - $78 ishHey guys, the AI helped me ride the wayve from 68 all the way to 76. With a small pullback the AI says we'll see something around the range of 77.5 ish, closer to 78 quite soon.
Would buy all opporutnites below the 75 range. Anything below 72.5 is a crazy buy and anything below $70 for the moment means one asks their relatives for a small loan of 1 billion dollars for a quick investment.
Will be sharing the AI with the public once it's ready for public consumption.

$TQQQ Weirdly mildly bullishDon't understand why, don't care. My AI gave of a partial bullishness signal for tomorrow onwards for TQQQ. It believes this a buy the dip moment (Unless it changes it's mind for whatever reason).
This is a signal on 3 out of 16 of my 3.6 sharpe models which is fairly bullish. I also had a UVXY call buy suggestion for today which i acted on which weirdly worked out intraday.
Expected move is around ~$4-7 dollars up, more likely on the lower end of that but i can't be sure. All i know is that the AI says up so i'm in.
I've dipped my feet a bit at these levels and waiting for more of my models to say BUY before i fully dip in. Several other tickers like CVNA and MARA flashed BUY today as well which is a nice extra confirmation, but not as good as if all 16 of my TQQQ models flash BUY which they haven't yet.

$TQQQ - Small moonThe AI has been triggered on TQQQ and UVXY. Calls on TQQQ and puts on UVXY.
The models i have on these have a sharpe of around 3.4-3.6 which means these are almost guaranteed money making trades as long as your entry point is good.
I'm waiting for confirmation before i go in but i'm likely to enter this trade really hard. The AI suggests ITM Calls at around 57.5 and 60 a month out. You can trade QQQ for this as well for similar equivalent strikes and expiries.

TQQQ Day Trade Plan for 04/29/2025TQQQ Day Trade Plan for 04/29/2025
📈 55.10 55.60
📉 52.10 51.60
Thanks to all my followers! Truly appreciate the support!
Please like and share for more ES/NQ levels Tues & Thurs 🤓📈📉🎯💰
*These levels are derived from comprehensive backtesting and research and a quantitative system demonstrating high accuracy. This statistical foundation suggests that price movements are likely to exceed initial estimates.*

NASDAQ Long Term: Deep in Bear MarketAn indicator works until it does not.
The SMA256 on the DAY chart of NASDAQ (QQQ/TQQQ) )has been respected multiple times as both supports and resistances since the end of COVID bullish run starting 2022.
For long-term trend-following traders, this chart shows we are now deep in the bear market (trend reversal happened in early March), stop placing long positions until the next trend reversal is clear.

Opening (IRA): TQQQ April 4th 70 Covered Call... for a 68.05 debit.
Comments: Starter position in the first weekly in April ... .
Metrics:
Buying Power Effect/Break Even: 68.05
Max Profit: 1.95
ROC at Max: 2.87%
50% Max: .98
ROC at 50% Max: 1.44%
Will generally look to take profit at 50% max, add at intervals assuming I can get in at strikes better than what I currently have on, and/or roll out short call if my take profit is not hit.

Opening (IRA): TQQQ April 17th 60 Covered Call... for a 57.91 debit.
Comments: Adding at strikes better than what I currently have on ... . Here, going lower net delta by selling the -84 call against shares to emulate the delta metrics of a 2 x expected move 16 delta short put, but with the built-in defense of the short call.
Metrics:
Buying Power Effect/Break Even: 57.91/share
Max Profit: 2.09
ROC at Max: 3.61%
50% Max: 1.05
ROC at 50% Max: 1.82%
Will generally look to take profit at 50% max, add at intervals if I can get in at strikes better than what I currently have on, and/or roll out short call if my take profit is not hit.

Buy and Sell zones for TQQQ Showing Same Sell Signals as SP500
TQQQ buy and sell zones showing in green and red. Yellow is where there is likely to be chop. The monthly starts to give clarity and confirmation of the key tend breaks and the appropriate response from the market this week.
These sell zones correlate nicely with the SP500. I would add to my shorts around Thursday and SP500 Friday's highs.

Short-Term Gamble on a NASDAQ Bounce Using TQQQIn this quick update, I’m taking a speculative short-term trade on a possible NASDAQ recovery after a steep sell-off. Was the market oversold—at least for a day? Maybe. Do I think the pain is over for the longer term? Probably not.
I’m using NASDAQ:TQQQ , a 3x leveraged ETF that tracks the NASDAQ-100 (the top 100 non-financial stocks in the NASDAQ). This means if the index moves up 2%, TQQQ should theoretically gain roughly 6%, and vice versa on the downside. Leveraged ETFs like this are high-risk, time-sensitive instruments—they’re designed for short-term trades, not buy-and-hold investing.
The idea here is that after a sharp drop, institutions might step in to scoop up oversold tech stocks, creating a brief rebound. If that happens, TQQQ could give me amplified upside. But this is purely a gamble—I’m under no illusion that the market has bottomed. In fact, I expect more downside ahead.
I entered in the after-hours session once some of the heavy bearish volume faded, and I’ve set a tight 5% stop-loss to manage risk. Yes, I could get shaken out by an early dip before any rebound, but the stop is there to protect me if the sell-off continues.
This is a high-risk, short-term trade—buyer beware. If you’re considering TQQQ, understand the risks: decay from daily resetting leverage, extreme volatility, and the potential for rapid losses.
I’ll update on how this plays out. Wish me luck in the comments below 😁
Real question is where to take profit...

Opening (IRA): TQQQ May 16th 51 Covered Call... for a 48.05 credit.
Comments: Adding at a strike better than what I currently have on, selling the -75 delta call against shares to emulate the delta metrics of a 25 delta short put, but with the built-in defense of the short call.
Metrics:
Buying Power Effect/Break Even: 48.05
Max Profit: 2.95
ROC at Max: 6.14%
50% Max: 1.48%
ROC at 50% Max: 3.07%
Will generally look to take profit at 50% max, add at intervals if I can get in at strikes better than what I currently have on, and/or roll out short call at 50% max.

TQQQ Stock Chart Fibonacci Analysis 032225Trading Idea
1) Find a FIBO slingshot
2) Check FIBO 61.80% level
3) Entry Point > 59/61.80%
Chart time frame: B
A) 15 min(1W-3M)
B) 1 hr(3M-6M)
C) 4 hr(6M-1year)
D) 1 day(1-3years)
Stock progress: C
A) Keep rising over 61.80% resistance
B) 61.80% resistance
C) 61.80% support
D) Hit the bottom
E) Hit the top
Stocks rise as they rise from support and fall from resistance. Our goal is to find a low support point and enter. It can be referred to as buying at the pullback point. The pullback point can be found with a Fibonacci extension of 61.80%. This is a step to find entry level. 1) Find a triangle (Fibonacci Speed Fan Line) that connects the high (resistance) and low (support) points of the stock in progress, where it is continuously expressed as a Slingshot, 2) and create a Fibonacci extension level for the first rising wave from the start point of slingshot pattern.
When the current price goes over 61.80% level , that can be a good entry point, especially if the SMA 100 and 200 curves are gathered together at 61.80%, it is a very good entry point.
As a great help, tradingview provides these Fibonacci speed fan lines and extension levels with ease. So if you use the Fibonacci fan line, the extension level, and the SMA 100/200 curve well, you can find an entry point for the stock market. At least you have to enter at this low point to avoid trading failure, and if you are skilled at entering this low point, with fibonacci6180 technique, your reading skill to chart will be greatly improved.
If you want to do day trading, please set the time frame to 5 minutes or 15 minutes, and you will see many of the low point of rising stocks.
If want to prefer long term range trading, you can set the time frame to 1 hr or 1 day.

TQQQ stock Chart Fibonacci Analysis 031725Trading Idea
1) Find a FIBO slingshot
2) Check FIBO 61.80% level
3) Entry Point > 59/161.80%
Chart time frame: B
A) 15 min(1W-3M)
B) 1 hr(3M-6M)
C) 4 hr(6M-1year)
D) 1 day(1-3years)
Stock progress: A
A) Keep rising over 61.80% resistance
B) 61.80% resistance
C) 61.80% support
D) Hit the bottom
E) Hit the top
Stocks rise as they rise from support and fall from resistance. Our goal is to find a low support point and enter. It can be referred to as buying at the pullback point. The pullback point can be found with a Fibonacci extension of 61.80%. This is a step to find entry level. 1) Find a triangle (Fibonacci Speed Fan Line) that connects the high (resistance) and low (support) points of the stock in progress, where it is continuously expressed as a Slingshot, 2) and create a Fibonacci extension level for the first rising wave from the start point of slingshot pattern.
When the current price goes over 61.80% level , that can be a good entry point, especially if the SMA 100 and 200 curves are gathered together at 61.80%, it is a very good entry point.
As a great help, tradingview provides these Fibonacci speed fan lines and extension levels with ease. So if you use the Fibonacci fan line, the extension level, and the SMA 100/200 curve well, you can find an entry point for the stock market. At least you have to enter at this low point to avoid trading failure, and if you are skilled at entering this low point, with fibonacci6180 technique, your reading skill to chart will be greatly improved.
If you want to do day trading, please set the time frame to 5 minutes or 15 minutes, and you will see many of the low point of rising stocks.
If want to prefer long term range trading, you can set the time frame to 1 hr or 1 day.

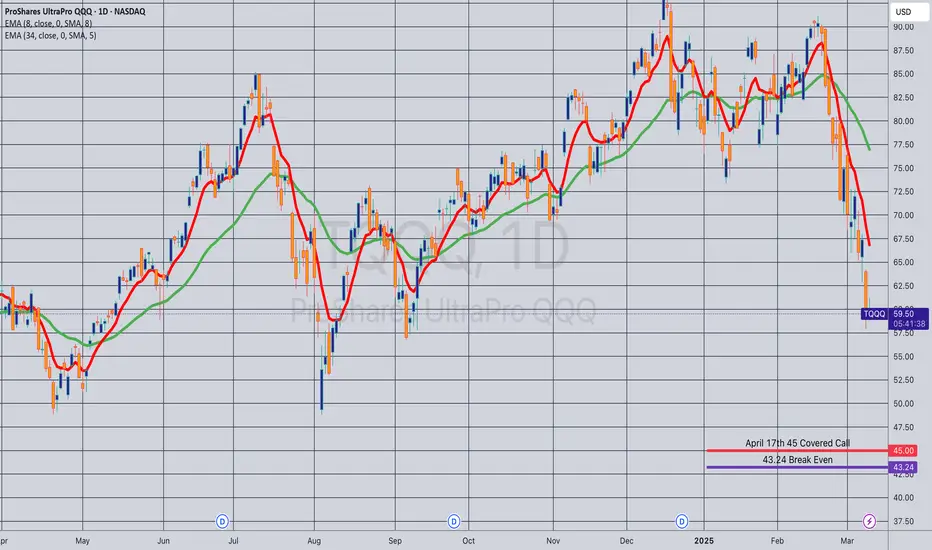
Opening (IRA): TQQQ April 17th 45 Covered Call... for a 43.24 debit.
Comments: Adding to my position at break evens better than what I currently have on, but going a little bit less aggressive net delta-wise, selling the -84 delta call against shares to emulate the delta metrics of a 2 x expected move short put, but with the built-in defense of the short call.
Metrics:
Buying Power Effect/Break Even: 43.24
Max Profit: 1.76
ROC at Max: 4.07%
50% Max: .88
ROC at 50% Max: 2.04%
Will generally look to take profit at 50% max, add at intervals if I can get in at break evens better than what I currently have on, and/or roll out short call if my take profit is not hit.
TQQQ. Did we just find a top ?Did we find a top in the stock market ? Will the bulls be able to reclaim their support line ? Let's see !
www.tradingview.com

TQQQ found it's direction today?Going for a mid-day win with TQQQ up to the midpoint of the fan wedge.
