TQQQBounce to run up 25 range resistance before possible correction to the lower 20 bounce to a catbounce drop possibility to the 13 range
Trade ideas

UP, UP AND AWAY FOR TQQQLets go baby, we are at the bottom, making new lows! Only way to go from here is 62.90 by July!
-SPECIAL NOTES-
1. I trade this stock with a very small percentage of my money, I am not dumb.
2. There is a ton of controversy on this stock, in my opinion it should only be day traded, not long term due to volatility decay.
3. Since there is so much misinformation on leveraged stocks, I decided to test $50 every 2 weeks from my paycheck and buy like a robot. NO EMOTIONS INVOLVED. This is a Dollar Cost Averaging (DCA) strategy I am choosing to do.
4. Please be careful with your money and don't go all in because I said the stock is going to go up, it is still just guessing and learning.
Thank you!

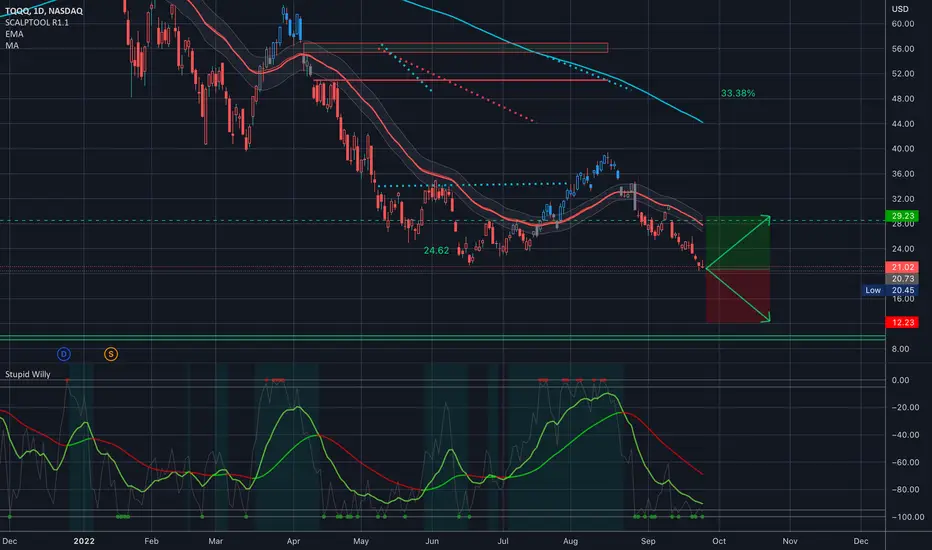
$TQQQ Analysis, Key levels & Targets $TQQQ Analysis, Key levels & Targets
I took a small TQQQ position, just 100 shares, at 20.73…
I’m either taking profit at 29.23 for 41%, or I’m doubling my position at 12.23. No in between.

TQQQ PITCHFORK SETUPWe have a nice pitchfork setup going on. Should see a momentum swing up from here.

TQQQ after inflation drop 7 days laterTQQQ still hasn't recovered. News coming out tomorrow is the FOMC, causing the flat run. Hopefully Feds do not cause this market to drop further, I believe they will not want to do that. Nevertheless market is calm before the storm.

TQQQ Head and Shoulders Forming hello world
TQQQ forming a Head and Shoulders continuation pattern with a break line at around 25.20. The intermediate uptrend represented by the blue trend line was broken and retested and we are now trading just above the neckline. First target would be below 22 with further downside possible. I 've kept the investment strategy as neutral because I would want to see a break of the neck at 25.20 before getting short.

TQQQ , LONGTook TQQQ longs in TFSA and SWING account today right at close on the signal .
Profit taking is different for both but exit signals and stops are same . I am only going to post the Swing details here as to not overcomplicate...
Entry 38.84
Stop 29.08
PT1 - 32.6 Sell 1/4 , stop up
PT2 - 34.36, Sell 1.4
Sell 1/4 after PT2 is filled on first hourly WD
Sell final 1/4 on WD .
TQQQ drop due to 8.3% inflation expected 8.1%Wanted to document this drop for my personal record keeping. This is a pre market drop, will post another with aftermarket trend for analysis. 09/13/22 CPI data effects.

qqe and sss are long but there is some doubtwe can look at signals all day and say theyre bullish, but the reality is that they are only bullish until they're not. this means thatwhen facts change you have to change the trade to meet the trend. i would trade a break of this pivot as bullish, and staying below it as bearish. we could follow the green or red path. sell if qqe or sss go red.

TQQQ, 4 HrsNASDAQ:TQQQ
Disclaimer : I am not a financial advisor nor a registered investment professional. This content is for entertainment purposes only and is not investment, tax, or financial advice. Always do your own diligence and research. You are solely responsible for all investment, tax, and financial decisions that you make.

we are plotting a larger volume of a smaller movesideways trading is more than likely the norm until further notice daily, and ive marked out the rangebound timezone cycle as well as kept the swing target low and pivot.

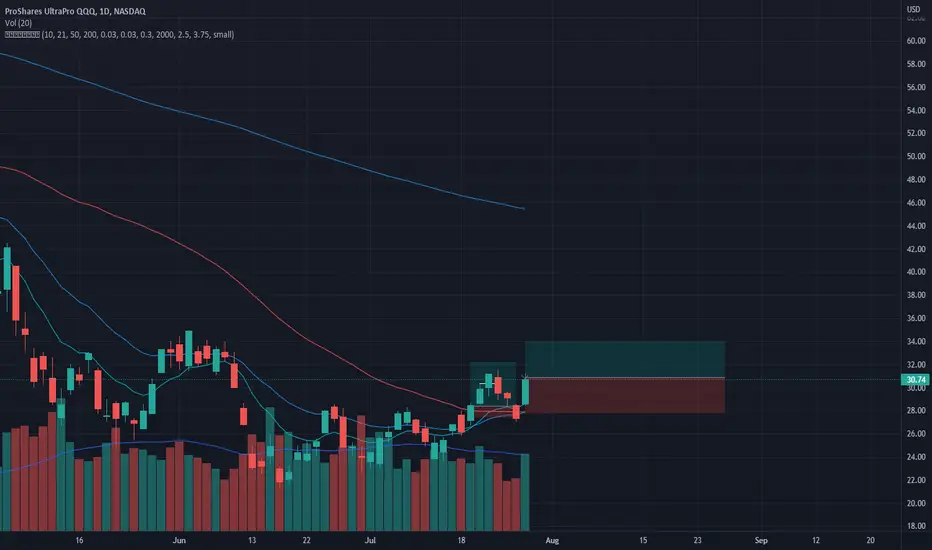
TQQQ PlanTQQQ broke the descending channel, and is retesting it now. And it seems oversold. It might be a good opportunity.
Not financial advice. Do your own research.

Long term prediction for TQQQ Long Term prediction for TQQQ , risky making a prediction this far out but with total world fundamentals being negative i don't see us returning into a bull market BUT there is a bullish scenario in this TA but im waiting on a few things to unfold before posting, PLEASE if your a expert at elliots wave theory and u have pointers please let me know. Thanks! www.tradingview.com

its pretty obvious the fed seems determined to tank this markettechnology is not playing the feds game, and they are rubbing elbows with china especially where semiconductors are concerned. the dollar is the worlds reserve currency, and big corporations dont like a populace with buying power. the job of the reserve banks is to assist borrowers while preserving the lenders capacity, and with this particular administration volatility seems to be the most profitable route. this means one thing. the bear market rally everyone feared is here. im predicting a dead cat bounce followed by continued downside.


TQQQ TRENDTQQQ still looking good with a full recovery for July 2024 at $86. I personally have been testing the DCA theory on this for a little while now with $100 a month. So far it is the best performing stock I own. Performing backtest this seems too good to be true, only time will tell and I got that. (don't mind the date and price, I put that there to remind me when I drew the trend lines for each time frame using the FEOP theory)

Pending GDP announcements we could see this...I think GDP will be luke warm at best and we'll not retest the low, nor create a new one because most of our current condition has been priced in.

rangebound trading cant last bear flag or breakoutprice action daily nasdaq is ranging around the lows with the bounce not escaping vertical gravity, and the candlestick pattern forming either a bear flag or a bullish reversal. if we cross above pivot im looking at upper horizontals as resistance, and if we cross below it im looking at lower horizontals as support.

Looking to go long TQQQ soonMonthly stochastic for TQQQ and price are low.
Weekly stochastic is currently overbought after 6 weeks of buying. Waiting for things to selloff, then looking to go long at the right price.
Setup to follow.

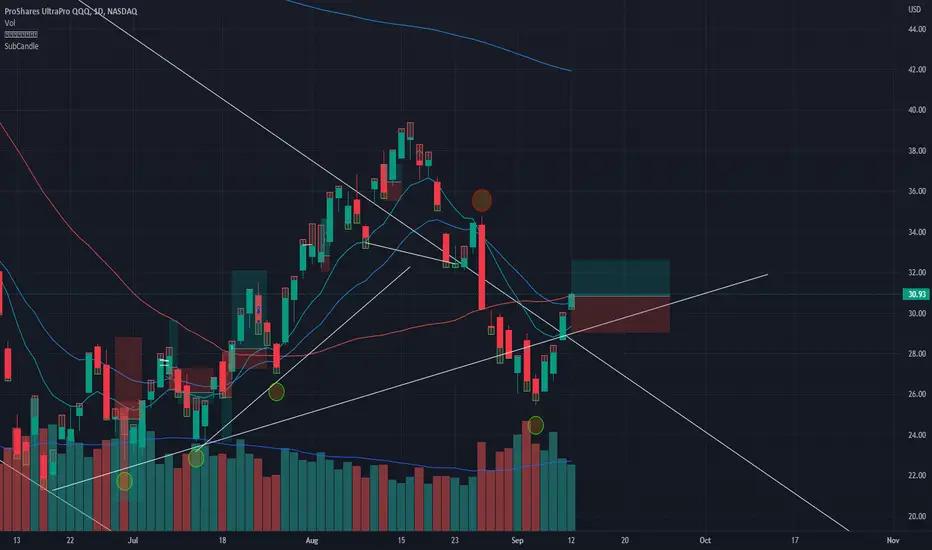
TQQQ , LONG ( TFSA ACCOUNT ) Back in at end of day after getting stopped last one .
30.89 in
Stop 27.83
Pt 1 - 33.95, sell 1/6 , raise stop to half risk
Pt 2 - 37.02 , sell 1/6 , run balance

looks like gap down and bounce could go both wayswere off the lows for the session in the nasdaq, nq1!, and ndx, and creating a slightly higher low than yesterday. we have retested sss moving average, and nearly crossed signal to the upside. if we fall beneath pivot i would look toward sss supply area, and lower horizontals. if we stay above pivot and TRAMA i would look for upper horizontals.
