TQQQ I Next long opportunity - following correction from 74.87Welcome back! Let me know your thoughts in the comments!
** TQQQ Analysis - Listen to video!
We recommend that you keep this pair on your watchlist and enter when the entry criteria of your strategy is met.
Please support this idea with a LIKE and COMMENT if you find it useful and Click "Follow" on our profile if you'd like these trade ideas delivered straight to your email in the future.
Thanks for your continued support!Welcome back! Let me know your thoughts in the comments!
Trade ideas

What happened today in the market?What happened today in the market?
At the beginning of the week, we knew that Friday would be one of the most important days of the month, as the unemployment rate report would be published, among other indicators. The result was favorable; the current rate stands at 4.1%, better than the forecast of 4.2% and the previous figure also at 4.2%. Additionally, news regarding the possibility of an agreement on the strikes at the most important ports in the U.S. contributed to an optimistic atmosphere.
Before the market opened, the indices surged upward. However, in the pre-market, we observed a particular behavior in the main ETFs, such as AMEX:SPY and $QQQ. In the case of NASDAQ:TQQQ , there was a price interruption of approximately $6 in $QQQ. This type of movement can leave many investors trapped due to the previous session's closures since they had open positions.
Despite the positive report and the overall optimistic sentiment, at the market's opening, the price remained sideways for about 25 minutes, during which many investors decided to take profits. This resulted in a pullback that wiped out the pre-market gains.
However, after that drop, the chart showed notable respect for the 61.8% Fibonacci retracement level, considered one of the most relevant levels. By respecting this level, the market experienced a new bullish impulse, better assimilating the profit-taking.

Weekly Seasonality Dynamic Kelly (Indicator Discussion)# Enhancing Trading Strategies with the Weekly Seasonality Dynamic Kelly Criterion Indicator
Amidst this pursuit to chase price, a common pitfall emerges: an overemphasis on price movements without adequate attention to risk management, probabilistic analysis, and strategic position sizing. To address these challenges, I developed the **Weekly Seasonality with Dynamic Kelly Criterion Indicator**. It is designed to refocus traders on essential aspects of trading, such as risk management and probabilistic returns, thereby catering to both short-term swing traders and long-term investors aiming for tax-efficient positions.
## The Motivation Behind the Indicator
### Overemphasis on Price: A Common Trading Pitfall
Many traders concentrate heavily on price charts and technical indicators, often neglecting the underlying principles of risk management and probabilistic analysis. This overemphasis on price can lead to:
- **Overtrading:** Making frequent trades based solely on price movements without considering the associated risks.
- **Poor Risk Management:** Failing to set appropriate stop-loss levels or position sizes, increasing the potential for significant losses.
- **Emotional Trading:** Letting emotions drive trading decisions rather than objective analysis, which can result in impulsive and irrational trades.
### The Need for Balanced Focus
To achieve sustained trading success, it is crucial to balance price analysis with robust risk management and probabilistic strategies. Key areas of focus include:
1. **Risk Management:** Implementing strategies to protect capital, such as setting stop-loss orders and determining appropriate position sizes based on risk tolerance.
2. **Probabilistic Analysis:** Assessing the likelihood of various market outcomes to make informed trading decisions.
3. **Swing Trading Percent Returns:** Capitalizing on short- to medium-term price movements by buying assets below their average return and selling them above.
## Introducing the Weekly Seasonality with Dynamic Kelly Criterion Indicator
The **Weekly Seasonality with Dynamic Kelly Criterion Indicator** is designed to integrate these essential elements into a comprehensive tool that aids traders in making informed, risk-aware decisions. Below, we explore the key components and functionalities of this indicator.
### Key Components of the Indicator
1. **Average Return (%)**
- **Definition:** The mean percentage return for each week across multiple years.
- **Purpose:** Serves as a benchmark to identify weeks with above or below-average performance, guiding buy and sell decisions.
2. **Positive Percentage (%)**
- **Definition:** The proportion of weeks that yielded positive returns.
- **Purpose:** Indicates the consistency of positive returns, helping traders gauge the reliability of certain weeks for trading.
3. **Volatility (%)**
- **Definition:** The standard deviation of weekly returns.
- **Purpose:** Measures the variability of returns, providing insights into the risk associated with trading during specific weeks.
4. **Kelly Ratio**
- **Definition:** A mathematical formula used to determine the optimal size of a series of bets to maximize the logarithmic growth of capital.
- **Purpose:** Balances potential returns against risks, guiding traders on the appropriate position size to take.
5. **Adjusted Kelly Fraction**
- **Definition:** The Kelly Ratio adjusted based on user-defined risk tolerance and external factors like Federal Reserve (Fed) stance.
- **Purpose:** Personalizes the Kelly Criterion to align with individual risk preferences and market conditions, enhancing risk management.
6. **Position Size ($)**
- **Definition:** The calculated amount to invest based on the Adjusted Kelly Fraction.
- **Purpose:** Ensures that position sizes are aligned with risk management strategies, preventing overexposure to any single trade.
7. **Max Drawdown (%)**
- **Definition:** The maximum observed loss from a peak to a trough of a portfolio, before a new peak is attained.
- **Purpose:** Assesses the worst-case scenario for losses, crucial for understanding potential capital erosion.
### Functionality and Benefits
- **Weekly Data Aggregation:** Aggregates weekly returns across multiple years to provide a robust statistical foundation for decision-making.
- **Quarterly Filtering:** Allows users to filter weeks based on quarters, enabling seasonality analysis and tailored strategies aligned with specific timeframes.
- **Dynamic Risk Adjustment:** Incorporates the Dynamic Kelly Criterion to adjust position sizes in real-time based on changing risk profiles and market conditions.
- **User-Friendly Visualization:** Presents all essential metrics in an organized Summary Table, facilitating quick and informed decision-making.
## The Origin of the Kelly Criterion and Addressing Its Limitations
### Understanding the Kelly Criterion
The Kelly Criterion, developed by John L. Kelly Jr. in 1956, is a formula used to determine the optimal size of a series of bets to maximize the long-term growth of capital. The formula considers both the probability of winning and the payout ratio, balancing potential returns against the risk of loss.
**Kelly Formula:**
\
Where:
- \( b \) = the net odds received on the wager ("b to 1")
- \( p \) = probability of winning
- \( q \) = probability of losing ( \( q = 1 - p \) )
### The Risk of Ruin
While the Kelly Criterion is effective in optimizing growth, it carries inherent risks:
- **Overbetting:** If the input probabilities or payout ratios are misestimated, the Kelly Criterion can suggest overly aggressive position sizes, leading to significant losses.
- **Assumption of Constant Probabilities:** The criterion assumes that probabilities remain constant, which is rarely the case in dynamic markets.
- **Ignoring External Factors:** Traditional Kelly implementations do not account for external factors such as Federal Reserve rates, margin requirements, or market volatility, which can impact risk and returns.
### Addressing Traditional Limitations
Recognizing these limitations, the **Weekly Seasonality with Dynamic Kelly Criterion Indicator** introduces enhancements to the traditional Kelly approach:
- **Incorporation of Fed Stance:** Adjusts the Kelly Fraction based on the current stance of the Federal Reserve (neutral, dovish, or hawkish), reflecting broader economic conditions that influence market behavior.
- **Margin and Leverage Considerations:** Accounts for margin rates and leverage, ensuring that position sizes remain within manageable risk parameters.
- **Dynamic Adjustments:** Continuously updates position sizes based on real-time risk assessments and probabilistic analyses, mitigating the risk of ruin associated with static Kelly implementations.
## How the Indicator Aids Traders
### For Short-Term Swing Traders
Short-term swing traders thrive on capitalizing over weekly price movements. The indicator aids them by:
- **Identifying Favorable Weeks:** Highlights weeks with above-average returns and favorable volatility, guiding entry and exit points.
- **Optimal Position Sizing:** Utilizes the Adjusted Kelly Fraction to determine the optimal amount to invest, balancing potential returns with risk exposure.
- **Probabilistic Insights:** Provides metrics like Positive Percentage (%) and Kelly Ratio to assess the likelihood of favorable outcomes, enhancing decision-making.
### For Long-Term Tax-Free Investors
This is effectively a drop-in replacement for DCA which uses fixed position size that doesn't change based on market conditions, as a result, it's like catching multiple falling knifes by the blade and smiling with blood on your hand... I don't know about you, but I'd rather juggle by the hilt and look like an actual professional...
Long-term investors, especially those seeking tax-free positions (e.g., through retirement accounts), benefit from:
- **Consistent Risk Management:** Ensures that position sizes are aligned with long-term capital preservation strategies.
- **Seasonality Analysis:** Allows for strategic positioning based on historical performance trends across different weeks and quarters.
- **Dynamic Adjustments:** Adapts to changing market conditions, maintaining optimal risk profiles over extended investment horizons.
### Developers
Please double check the logic and functionality because I think there are a few issue and I need to crowd source solutions and be responsible about the code I publish. If you have corrections, please DM me or leave a respectful comment.
I want to publish this by the end of the year and include other things like highlighting triple witching weeks, adding columns for volume % stats, VaR and CVaR, alpha, beta (to see the seasonal alpha and beta based off a benchmark ticker and risk free rate ticker and other little goodies.
//@version=5
indicator("Weekly Seasonality with Dynamic Kelly Criterion", overlay=false, max_labels_count=500)
////////////
// Inputs //
////////////
// User Inputs
int startYearInput = input.int(2015, "Starting Year for Analysis", minval=1900)
float capitalInput = input.float(10000, "Available Capital ($)", minval=0)
// User-defined inputs
float riskToleranceInput = input.float(1.0, "Risk Tolerance (0-1)", minval=0, maxval=1)
float maxDrawdownInput = input.float(20.0, "Maximum Drawdown (%)", minval=0)
float marginRateInput = input.float(0.5, "Margin Rate (0-1)", minval=0.01, maxval=1)
float maintenanceRateInput = input.float(0.25, "Maintenance Rate (0-1)", minval=0, maxval=1)
string fedStanceInput = input.string("neutral", "Fed Stance", options= )
// Options to display the results
bool showTableInput = input.bool(true, "Show Weekly Summary Table")
// Quarter Inputs
// Options to filter returns by specific quarters
bool q1Input = input.bool(true, "Q1")
bool q2Input = input.bool(false, "Q2")
bool q3Input = input.bool(false, "Q3")
bool q4Input = input.bool(false, "Q4")
/////////////////////////
// Function Definitions //
/////////////////////////
// Function to calculate adjusted Kelly Fraction based on Kelly Ratio, risk tolerance, and Fed stance
calculateAdjustedKellyFraction(float kellyRatio, float riskTolerance, string fedStance) =>
// Adjust Kelly Fraction based on risk tolerance
float adjustedKellyFraction = kellyRatio * riskTolerance
// Adjust based on Fed stance
float kellyAdjustment = fedStance == "dovish" ? 0.1 : fedStance == "hawkish" ? -0.1 : 0.0
adjustedKellyFraction := adjustedKellyFraction + kellyAdjustment
// Ensure Kelly fraction is within bounds
adjustedKellyFraction := math.max(math.min(adjustedKellyFraction, 1), -1)
adjustedKellyFraction
// Custom function to sum over an array
sumArray(float arr) =>
float total = 0.0
for i = 0 to array.size(arr) - 1
total += array.get(arr, i)
total
// Function to calculate standard deviation for returns
calculateStdDev(float returns) =>
int count = array.size(returns)
if count > 1
float avg = sumArray(returns) / count
float sumSqDiffs = 0.0
for i = 0 to count - 1
float val = array.get(returns, i)
float diff = val - avg
sumSqDiffs += diff * diff
float variance = sumSqDiffs / (count - 1)
math.sqrt(variance)
else
0.0
// Function to calculate Kelly Ratio
calculateKellyRatio(float returns) =>
float winCount = 0.0
float lossCount = 0.0
float totalWinReturn = 0.0
float totalLossReturn = 0.0
int n = array.size(returns)
for i = 0 to n - 1
float ret = array.get(returns, i)
if ret > 0
winCount += 1
totalWinReturn += ret
else if ret < 0
lossCount += 1
totalLossReturn += math.abs(ret)
float winProb = (winCount + lossCount) > 0 ? winCount / (winCount + lossCount) : 0.0
float lossProb = 1 - winProb
float avgWinReturn = winCount > 0 ? totalWinReturn / winCount : 0.0
float avgLossReturn = lossCount > 0 ? totalLossReturn / lossCount : 0.0
float kellyRatio = 0.0
if avgLossReturn != 0 and avgWinReturn != 0
float odds = avgWinReturn / avgLossReturn
if odds != 0
kellyRatio := winProb - (lossProb / odds)
kellyRatio
// Function to calculate Max Drawdown
calculateMaxDrawdown(float returns) =>
if array.size(returns) == 0
0.0
else
float peak = array.get(returns, 0) // Updated to use array.get
float maxDD = 0.0
float cumulativeReturn = 0.0
for i = 0 to array.size(returns) - 1
cumulativeReturn += array.get(returns, i) // Updated to use array.get
if cumulativeReturn > peak
peak := cumulativeReturn
float drawdown = peak - cumulativeReturn
if drawdown > maxDD
maxDD := drawdown
maxDDPercent = peak != 0 ? (maxDD / peak) * 100 : 0.0
maxDDPercent
/////////////////////////////////
// Data Retrieval and Processing //
/////////////////////////////////
// Initialize variables
var float weekReturnSums = array.new_float(52, 0.0)
var int weekReturnCounts = array.new_int(52, 0)
var int weekPositiveCounts = array.new_int(52, 0)
var float weekReturnSquares = array.new_float(52, 0.0)
var float allWeekReturns = array.new_float()
var int allWeekNums = array.new_int()
// Get weekly data using request.security
= request.security(syminfo.tickerid, 'W', )
// Detect new week
isNewWeek = ta.change(weeklyTime)
if isNewWeek
int weekNum = weekofyear(weeklyTime ) // Previous week number
int yearNum = year(weeklyTime )
if yearNum >= startYearInput
float prevWeeklyClose = weeklyClose
float currWeeklyClose = weeklyClose
float ret = (currWeeklyClose - prevWeeklyClose) / prevWeeklyClose * 100
// Update the arrays
int idx = weekNum - 1 // index in arrays
if idx >= 0 and idx < 52
// Sum of returns
sum = array.get(weekReturnSums, idx) + ret
array.set(weekReturnSums, idx, sum)
// Count of returns
count = array.get(weekReturnCounts, idx) + 1
array.set(weekReturnCounts, idx, count)
// Sum of squared returns
sumSq = array.get(weekReturnSquares, idx) + ret * ret
array.set(weekReturnSquares, idx, sumSq)
// Positive counts
posCount = array.get(weekPositiveCounts, idx)
if ret > 0
posCount += 1
array.set(weekPositiveCounts, idx, posCount)
// Store all returns and week numbers
array.push(allWeekReturns, ret)
array.push(allWeekNums, weekNum)
////////////////
// Visualization //
////////////////
if showTableInput and barstate.islast
// Prepare data for the table
var int selectedWeekNumbers = array.new_int()
var float avgReturnsArray = array.new_float()
var float stdDevArray = array.new_float()
var float posPercentsArray = array.new_float()
var float kellyRatiosArray = array.new_float()
var float adjustedKellyFractionsArray = array.new_float()
var float positionSizesArray = array.new_float()
var float maxDrawdownsArray = array.new_float()
for idx = 0 to 51
int weekNum = idx + 1
// Check if the week number is in the specified quarters
bool isInQuarter = (weekNum >= 1 and weekNum <= 13 and q1Input) or
(weekNum >= 14 and weekNum <= 26 and q2Input) or
(weekNum >= 27 and weekNum <= 39 and q3Input) or
(weekNum >= 40 and weekNum <= 52 and q4Input)
if isInQuarter
int count = array.get(weekReturnCounts, idx)
if count > 0
array.push(selectedWeekNumbers, weekNum)
float sum = array.get(weekReturnSums, idx)
float avgRet = sum / count
array.push(avgReturnsArray, avgRet)
float sumSq = array.get(weekReturnSquares, idx)
float variance = (sumSq - (sum * sum) / count) / (count - 1)
float stdDev = variance > 0 ? math.sqrt(variance) : 0.0
array.push(stdDevArray, stdDev)
// Positive percentage
int posCount = array.get(weekPositiveCounts, idx)
float posPercent = posCount / count * 100
array.push(posPercentsArray, posPercent)
// Extract returns for this week
float returnsArray = array.new_float()
for i = 0 to array.size(allWeekReturns) - 1
if array.get(allWeekNums, i) == weekNum
array.push(returnsArray, array.get(allWeekReturns, i))
// Kelly Ratio
float kellyRatio = calculateKellyRatio(returnsArray)
array.push(kellyRatiosArray, kellyRatio)
// Adjusted Kelly Fraction
float adjustedKellyFraction = calculateAdjustedKellyFraction(kellyRatio, riskToleranceInput, fedStanceInput)
array.push(adjustedKellyFractionsArray, adjustedKellyFraction)
// Leverage factor
float leverageFactor = marginRateInput > 0 ? 1 / marginRateInput : 1.0
// Max position size
float maxPositionSize = capitalInput * leverageFactor
// Position size
float positionSize = maxPositionSize * adjustedKellyFraction
// Ensure position size does not exceed max position size
positionSize := math.min(positionSize, maxPositionSize)
// Max Drawdown
float maxDD = calculateMaxDrawdown(returnsArray)
// Adjust position size if max drawdown exceeds maxDrawdownInput
if maxDD > maxDrawdownInput and maxDD != 0
positionSize := positionSize * (maxDrawdownInput / maxDD)
array.push(positionSizesArray, positionSize)
array.push(maxDrawdownsArray, maxDD)
// Limit the number of rows to fit within the table size limit
int maxRows = 49 // 49 data rows + 1 header row = 50 total rows
int totalRows = array.size(selectedWeekNumbers)
int numRows = math.min(totalRows, maxRows)
int startIndex = 0 // Display from the first selected week
// Create table
var table returnsTable = table.new(position.top_right, 8, numRows + 1, border_width=1)
// Set table headers
table.cell(returnsTable, 0, 0, "Week", bgcolor=color.gray, text_color=color.white)
table.cell(returnsTable, 1, 0, "Avg Return (%)", bgcolor=color.gray, text_color=color.white)
table.cell(returnsTable, 2, 0, "Volatility (%)", bgcolor=color.gray, text_color=color.white)
table.cell(returnsTable, 3, 0, "Pos %", bgcolor=color.gray, text_color=color.white)
table.cell(returnsTable, 4, 0, "Kelly Ratio", bgcolor=color.gray, text_color=color.white)
table.cell(returnsTable, 5, 0, "Adj Kelly Frac", bgcolor=color.gray, text_color=color.white)
table.cell(returnsTable, 6, 0, "Position Size ($)", bgcolor=color.gray, text_color=color.white)
table.cell(returnsTable, 7, 0, "Max Drawdown (%)", bgcolor=color.gray, text_color=color.white)
// Populate table
for idx = startIndex to numRows - 1
int row = idx + 1 // Adjust row index for the table
int weekNum = array.get(selectedWeekNumbers, idx)
float avgRet = array.get(avgReturnsArray, idx)
float stdDev = array.get(stdDevArray, idx)
float posPercent = array.get(posPercentsArray, idx)
float kellyRatio = array.get(kellyRatiosArray, idx)
float adjustedKellyFraction = array.get(adjustedKellyFractionsArray, idx)
float posSize = array.get(positionSizesArray, idx)
float maxDD = array.get(maxDrawdownsArray, idx)
// Week Number
table.cell(returnsTable, 0, row, str.tostring(weekNum))
// Avg Return (%)
table.cell(returnsTable, 1, row, str.format("{0,number,#.##}", avgRet))
// Volatility (%)
table.cell(returnsTable, 2, row, str.format("{0,number,#.##}", stdDev))
// Pos %
table.cell(returnsTable, 3, row, str.format("{0,number,#.##}", posPercent))
// Kelly Ratio
table.cell(returnsTable, 4, row, str.format("{0,number,#.####}", kellyRatio))
// Adj Kelly Frac
table.cell(returnsTable, 5, row, str.format("{0,number,#.####}", adjustedKellyFraction))
// Position Size ($)
table.cell(returnsTable, 6, row, str.format("{0,number,#.##}", posSize))
// Max Drawdown (%)
table.cell(returnsTable, 7, row, str.format("{0,number,#.##}", maxDD))

Opening (IRA): TQQQ Dec 20th 47 Covered Call.. for a 42.71 debit.
Comments: Since all my rungs are now out in Dec, adding one at lower break evens than what I currently have on, selling the -75 delta call against long stock to emulate a 25 delta short put, but with built-in short call defense.
Metrics:
Buying Power Effect/Break Even: 42.71
Max Profit: 4.29
ROC at Max: 10.04%
50% Max: 2.15
ROC at 50% Max: 5.02%

Are we seeing a repeat of past situations, or has the market truIf we look at ETFs like QQQ, we can notice price breaks between sessions, let's see where these interruptions occur.
First interruption this is a gap of $1.50, which represents an increase of approximately 2.6%, from $59 to $60.
Second interruption occurs between $63 and $66, which implies an increase of 3.5%.
On the chart, we can also observe a bullish channel that, due to the strength of the buyers, has not been respected, so far we could consider the price to be in a phase where it could take a break or pull back, which would be healthy for $QQQ.
We have seen similar behavior in stocks with low market caps, which experience a phenomenon known as "pump and dump", where they rise non stop and then fall, therefore, a break in the price is considered healthy.
Continuing with the analysis, in the past, the QQQ has shown patterns that are usually respected, although these can take days, weeks or even months to complete, for example, from July 16 to 17, there was a strong bearish opening that left a gap of $2.50 this pattern was repeated from July 23 to 24, and currently, the price has already completed half of that gap.
Based on previous patterns, we can assume that a bullish move in QQQ of approximately 2% is expected, around $1.50 upwards, considering this, it might be prudent to wait for that move to complete to enter a bearish position and take advantage of the pullback, especially since the price is at resistance at $72. normally, when price first hits resistance, it tends to pull back as buyers decide to take profits.
The Goldman Sachs Bull/Bear indicator is a cool way to check the market sentiment Currently, it is at 70% levels, indicating bullish sentiment and widespread optimism among investors However, this level can also be a cause for concern, as such a high indicator could signal a possible correction in the market. Although it is not an exact science and it is difficult to predict when a correction will occur, we can analyze historical examples to better understand its behavior
November 2007 during this period, there was a real estate boom and a strong economy, a context reflected in the film "The Big Short" at that time, the goldman sachs indicator was close to 70%, and shortly after, the market began to correct, kicking off the 2008 global financial crisis.
January 2020 the market was experiencing a continued rally due to optimism around monetary policy and widespread positive sentiment, however in February 2020, a sharp decline began due to the onset of the COVID-19 pandemic.
December 1999 the rise of technology companies during the dot-com bubble led to extremely optimistic sentiment in march 2000, the bubble popped, resulting in a prolonged decline in this case, the Goldman Sachs indicator was also close to 70%.
In my point of view, the market can rise a little more but it should have a final bullish impulse and be able to begin to retreat, historically september has been one of the weakest months of the year.

Opened (IRA): TQQQ Sept 20th 58 Monied Covered Call... for a 54.85 debit.
Comments: Added to my position at a strike/break even better than what I currently have on.
Metrics:
Buying Power Effect/Break Even: 54.85/share
Max Profit: 3.15 ($315)
ROC at Max: 5.74%
50% Max: 1.58 ($158)
ROC at 50% Max: 2.87%

Opened (IRA): TQQQ Sept 20th 53 Monied Covered Call... for a 50.14 debit.
Comments: Added another rung here on weakness/high IVR/IV (83/69.8), selling the -75 delta call against stock to emulate the delta metrics of a 25 delta short put with the built-in defense of the short call.
Will generally look to take profit on rungs at 50% max, roll out the short call for duration and credit if it doesn't hit at 21 DTE.

Opening (IRA): TQQQ Sept 20th 49 Monied Covered Call... for a 45.45 debit.
Comments: Last rung in Sept ... . Selling the -75 call against stock to emulate the delta metrics of a 25 delta long put with the built-in defense of the short call.
Metrics:
Break Even/Buying Power Effect: 45.45
Max Profit: 3.55 ($355)
ROC at Max: 7.81%
50% Max: 1.78 ($178)
ROC at 50% Max: 3.91%

TQQQ and Tech Stock Intraday SetupI noticed today that there was a solid intraday trade opportunity across many tech stocks. It had to be well-timed, but it wasn't insignificant.
While the large sell-off in the news is true, the data was a bit lagged in terms of a "today" trading opportunity that presented itself this morning on AMZN, TSLA, TQQQ, and several others for at least 1-2% upside with a reasonable risk/reward of 1:2.
I wonder if anyone other than myself took advantage of this setup today?

October 23, 2023We had seen this setup before the great surge of October 23, 2023, coinciding with data indicating that the Fed’s plan to curb inflation might be working. In September, we would then expect a rate cut.
Technically speaking, we have a Flag

TQQQ: over bought, wait for the negative divergence.Hello,
TQQQ is over bought with RSI above 80.
But not yet done with rally.
Look for the Negative divergence in RSI for shorting.
Tech is in super bull phase, be careful with puts/shorts.
Let's see if it can come down to fill those gaps.
Happy trading

$TQQQ heading into FOMC, earnings, electionVery important week for technicals. Tech/ AI has to either bounce here to determine bullish continuation; or crack under for bearish continuation. I personally prefer to day trade & swing trade the leveraged NASDAQ:TQQQ instead of NASDAQ:QQQ ; it has a cleaner pattern, and often better option contracts, imo.

TQQQ LEVELS FOR WEEK OF 7/29/24Trying to keep this as simple as possible.
Once price breaks outside of the Blue range, watch for possible retest of broken level and be ready to long or short into the green ranges.
Price may exceed green range targets, but it’s at least a strong help to make profit.

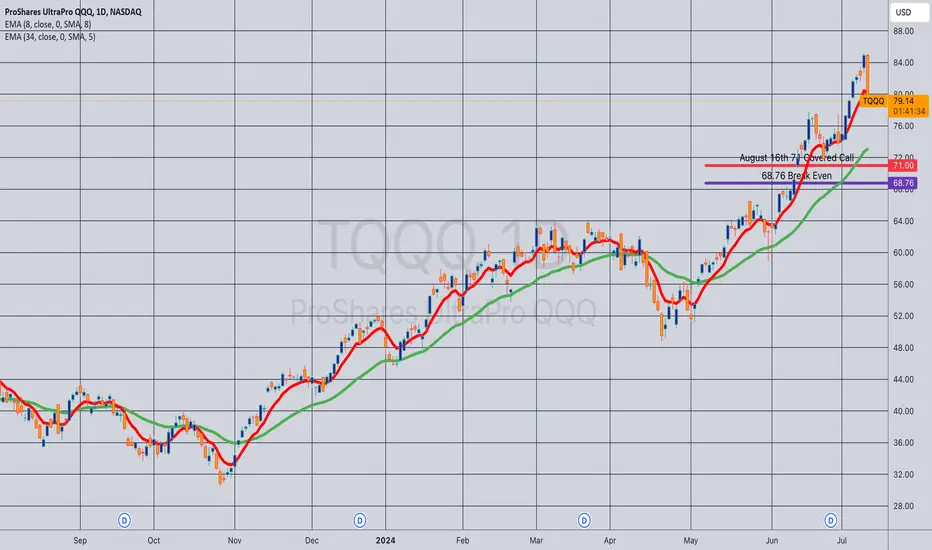
Opening (IRA): TQQQ August 16th 71 Covered Call... for a 68.76 debit.
Comments:
Buying stock and selling a -75 delta call against to emulate the delta metrics of a 25 delta short put with the built-in defense of the short call. As usual, this only makes sense in a cash secured environment where you don't get much BP relief going with the short put over the covered call; on margin -- stick with the short put.
Metrics:
Buying Power Effect/Break Even: 68.76/share
Max Profit: 2.24/contract
ROC at Max: 3.26%
50% Max: 1.12/contract
ROC at 50% Max: 1.63%
Will generally look to take profit at 50%, roll out the short call on side or break even test. (It's entirely possible that I will regret this trade later).
Opening (IRA): TQQQ July 19th 58 Monied Covered Call... for a 55.95 debit.
Comments: Going monied here, selling the -75 call against stock to emulate a 25 delta short put metrics while having built-in intraexpiry defense via the short call. More patient people will probably wait for weakness ... .
I'll generally look to roll out the short call on test or at 50% max/take profit on the entire setup as a unit at 50% of max.
Metrics:
Buying Power Effect/Break Even: 55.95
Max Profit: 2.05 ($205)
ROC at Max: 3.66%
ROC at 50% Max: 1.83%

Opening (IRA): TQQQ July 19th 53 Short Put... for a 1.77 credit.
Comments: Adding a short put element to my TQQQ covered call on weakness.

Opening (IRA): TQQQ June 28th 53 Monied Covered Call... for a 51.52 debit.
Comments: Re-upping in the June 28th expiry with a monied covered call, as there is no July yet. Selling the -75 delta call against a one lot to emulate the delta metrics of a 25 delta short put to have built-in defense via the short call and to take advantage of call side IV skew.
Metrics:
Buying Power Effect/Break Even: 51.52
Max Profit: 1.48
ROC at Max: 2.87%
ROC at 50% Max: 1.44%
Will generally look to take profit on the entire setup at 50% max.

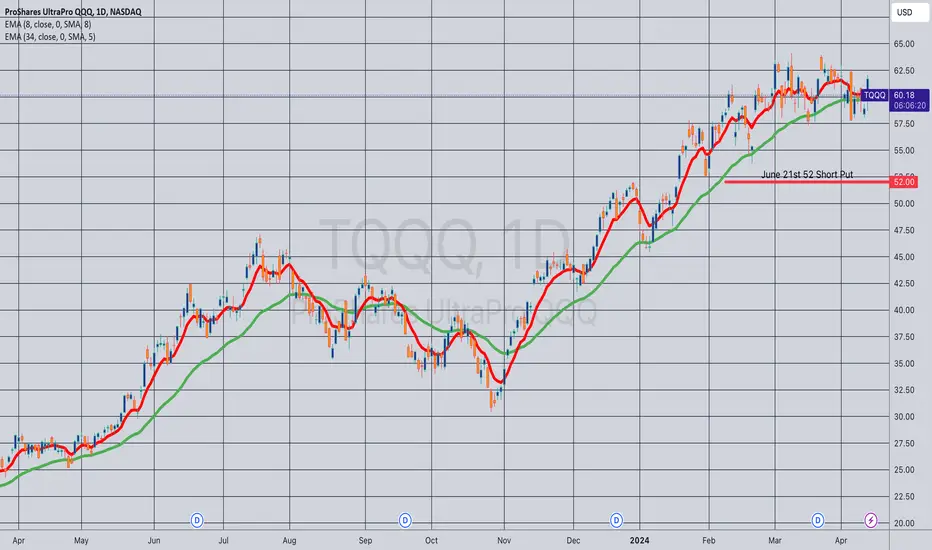
Opening (IRA): TQQQ June 21st 52 Short Put... for a 2.49 credit.
Comments: Adding to my TQQQ position on weakness ... . This is a bit longer-dated than I like to go with shorter duration premium selling, which I like to keep in that 45 DTE wheelhouse, but May has now only 35 days in it, and I like to stick to monthlies in all but the most options liquid underlyings.
Will generally look to take profit at 50% max. I'm fine with being assigned, then proceeding to sell call against if that occurs.
Metrics:
BPE/Break Even: 49.51
Max Profit: 2.49 ($249)
ROC at Max Profit: 5.03%
ROC at 50% Max: 2.51%
Delta/Theta: 24.36/3.37
Opened (IRA): TQQQ May 17th 55 Monied Covered CallBought a one lot of shares and sold an in-the-money -75 delta call to emulate a 25 delta short put to take advantage of call IV skew and to have built-in pro via the short call.
Metrics:
Break Even/Cost Basis in Shares: 52.71
Max Profit: 2.29 ($229)
ROC %-age at Max: 4.34%
ROC %-age at 50% Max: 2.17%
Will generally look to take profit at 50% max, add at intervals at a strike/cost basis better than what I currently have on should weakness present itself.

TQQQ 6/26/2023Keeping it simple
TQQQ Multi-time frame analysis
Daily chart – Long term
Pretty clean straight forward chart. In this one we can see the different stages of the market.
After topping out in Aug. ’18, price entered a “sideways” market between Aug.’18 – May’20. The “sideways” market was deemed an Accumulation stage after price broke upwards and entered Uptrend.
In May’20, price entered its Uptrend after breaking out of an Accumulation stage. During this time, you can see price respect the 200ema the whole way.
The Uptrend ran between May ’20 thru Nov.’21. After topping out Nov.’21, price starts to move sideways until it breaks below 200ema Jan.’22. This breakdown deemed the “sideways” market as a Distribution stage and confirms the start of the Downtrend.
Price has been in a Downtrend since and continues to make lower highs and lower lows. Facts that can’t be argued.
The price slide continued until it reached the breakout point of May’20. At this level it found support and bounced breaking above the 200ema and breaking above resistance and previous lower high.
Does this mean the Downtrend is over? Absolutely not. Why? This is the 1st time the previous lower high has been tested.
I will now look at some indicators to provide further confirmation.
The Stochastic indicator - has been Overbought for a while and it’s coming down while being at a resistance level. Bearish.
The MACD indicator - is crossing below its signal while price is at a resistance level. Bearish
Price rejection/ false breakout – Price was above the previous lower high price(Resistance) but has now fallen below it. This is very bearish as price is rejecting higher prices.
So currently we have the following: Downtrend + Oversold stochastic + Macd under signal + Price rejection
This equals to a high probability short trade. I will zoom into 15min chart for entry.
15min chart – Short term
Here we can get a closer look at what’s going on short term.
Price has been on an Uptrend (respecting 200ema) since May 5, ’23 and topped out June 15th 2023.
Here we can see the “Price rejection” we saw on the Daily chart and its a Head and Shoulders reversal pattern in the 15min chart!
As you can see, the neckline has been broken to confirm the Head and Shoulders reversal pattern.
Entering trade short.
Entry: 37.30
Stop loss: 41.05, -10.05%
Target #1: 27.70, +25.75%, 2.56 RR ratio
Target #2: 17.67, +52.63%, 5.23 RR ratio

TQQQ Tech 3X levarged ETF LONGOn this 15 minute chart, TQQQ is in an anchored VWAP band and volume profile breakout.
Near to the end of the regular market, the RSI indicator ran from deep oversold. After hours,
NVDA reported a sizable earnings beat. The AI machine learning and backtesting indicator
forecasts and uptrend continuation. I will get call options targeting $58 for Friday's expiration.
This is a risky play, price trend could reverse and there could be no time left to recover from
that reversal. The rewards for the trade going right could easily exceed 100%.

TQQQ - Cup awaiting Handle ?TQQQ on a weekly chart in 2021 ascended into a falling wedge. As part of the falling wedge,
it started the downside initial part of a cup and handle pattern. The reversal occurred 11
months ago with the upside completion of the cup back to 57.5 In the typical cup and handle,
the handle then forms in a 50% retracement of the height of the cup. the cup height measures
44.5 over a period of about 9 months. Notably relative volumes peaked at the bottom of the
pattern. Once the retracement is complete, bullish continuation should occur to the extent of
the height of the cup above the lip. That is to say an uptrend from 57.5 adding 44.5 to get to
102 more or less. But first the retracement and reversal must occur.
Accordingly, if this is an incomplete cup and handle, it forecasts a retracement of 44.5 divided
by 2 or to about 38 as shown by the Fib retracement tool. After that price must reverse
then overcome the resistance of the lip of the cup ( 57.5) and continue to 102.
Overall, this forecasts that a bearish crash is in store for TQQQ ( as well as QQQ from which
it is leveraged). Time will tell if this pattern has given an accurate forecast. In the meanwhile,
I will watch for signs of QQQ topping out on the weekly time frame after the same signs on
lower time frames. The alternative view is that TQQQ is building an even bigger cup
right now with the lip at about 88 when the price had a high pivot down on November 22, 2021.
So, do you see a bigger or smaller cup pattern or none at all?

TQQQ Bullish till its Not!The markets have given us some clear direction over the last few months, albeit we are at quite high levels and I would expect a pullback at some point.
There are 2 important clues here that are clearly visible on the chart.
The first is a continuous strong move up as illustrated in the channel. We can clearly see the supply and demand zones flipping once price is able to test important support and resistance.
The second is a pullback coming into the lower end of the channel, as well as the s/r flip from the previous range.
We are clearly still in an overall bull market, so it would be a terrible place to short below the lows, for the time being.
Until additional data points to lower prices, my bias will have to remain long. A break of market structure would change my bias and I will update my bias from there.
