US 30 POETENTIAL BULLISH RUNAfter setting a strong low on Friday, Dow Jones Industrial Average is likely to correct close to the rejection thus cueing for long entries. be on the lookout for those buys at around 45300. Buy stops at the current weekly high.
Trade ideas

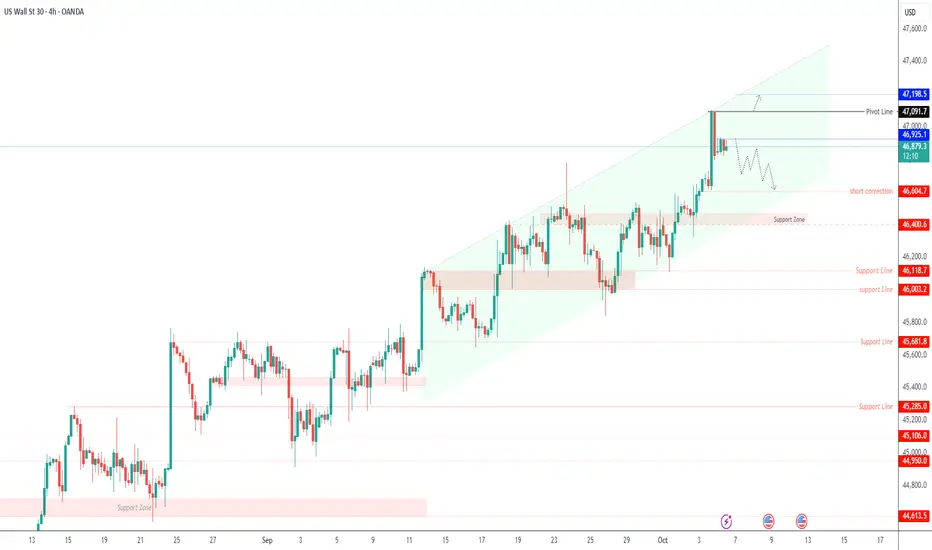
US30 – Short-Term Correction Expected After Record HighUS30 – Overview
The Dow Jones reached a new record high, but now shows signs of a short-term correction before the next move.
A minor pullback toward 46,680–46,610 is possible before the next directional breakout.
Technical Outlook
A break below 46,400 would confirm a shift to a bearish trend, with potential downside continuation.
On the other hand, a confirmed break above 46,925 would reinforce the bullish momentum, targeting 47,090 → 47,200 in extension.
Pivot: 46,925
Support: 46,680 – 46,600 – 46,400
Resistance: 47,090 – 47,200 – 47,350
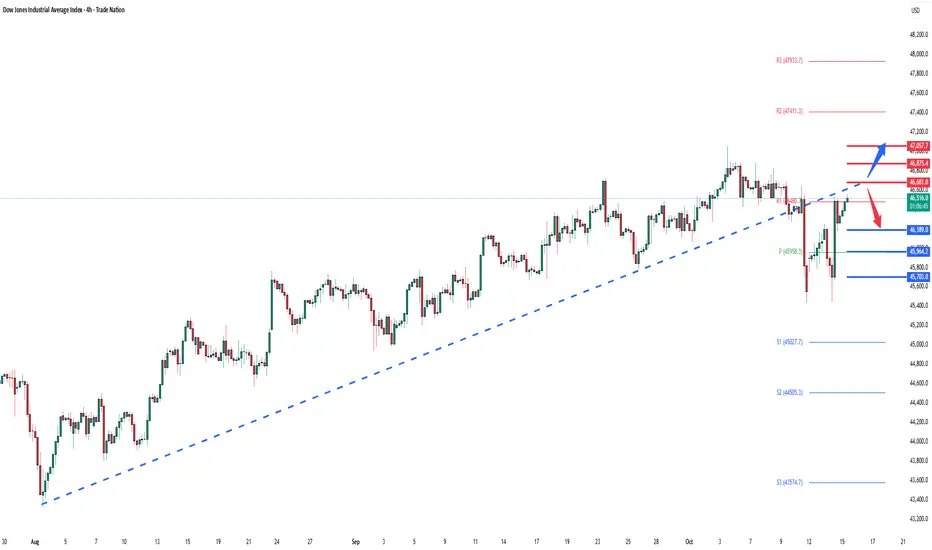
DowJones retest of pivotal 46680 level? Key Support and Resistance Levels
Resistance Level 1: 46680
Resistance Level 2: 46875
Resistance Level 3: 47060
Support Level 1: 46190
Support Level 2: 45965
Support Level 3: 45700
This communication is for informational purposes only and should not be viewed as any form of recommendation as to a particular course of action or as investment advice. It is not intended as an offer or solicitation for the purchase or sale of any financial instrument or as an official confirmation of any transaction. Opinions, estimates and assumptions expressed herein are made as of the date of this communication and are subject to change without notice. This communication has been prepared based upon information, including market prices, data and other information, believed to be reliable; however, Trade Nation does not warrant its completeness or accuracy. All market prices and market data contained in or attached to this communication are indicative and subject to change without notice.
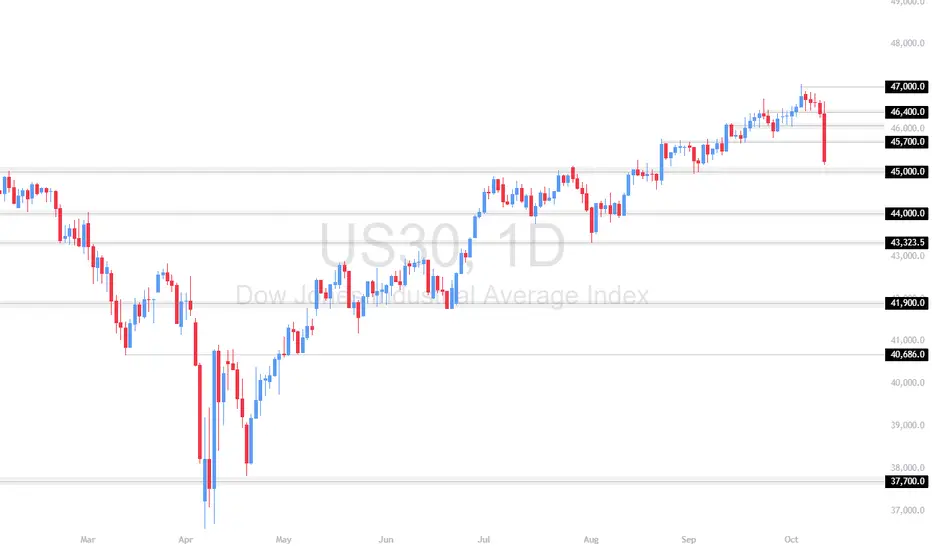
US30 – 45,000.00 Level Under Pressure: Wait or Act?After the sharp selloff that followed the tariff announcement shock, US30 broke below 46,400.00 and 45,700.00, plunging toward the key 45,000.00 psychological zone.
This level coincides with prior demand from mid-August and could act as the first real test of buyers’ strength after the October breakdown.
Support at : 45,000.00 🔽 44,000.00 🔽 43,323.50 🔽
Resistance at : 45,700.00 🔼 46,400.00 🔼 47,000.00 🔼
🔎 Bias:
🔼 Bullish: Only if 45,000.00 holds and price reclaims 45,700.00 — showing that buyers are defending the zone despite tariff fears.
🔽 Bearish: If price closes below 45,000.00 daily, momentum could accelerate toward 44,000.00 and 43,323.50 before November’s policy deadline.
📊 Fundamental Note:
Markets are hypersensitive to trade news. The tariff agreement between Trump and China (deadline Nov 1) is likely to dictate direction. Until clarity comes, volatility and uncertainty will dominate — meaning patience could be wiser than premature entries.
📛 Disclaimer: This is not financial advice. Trade at your own risk.
US30 - Potential LongHi Traders,
US30 has been in an UPTREND for a long time and looking for buy trades is only logical.
What now?
Wait for a retracement or a pull back
Look for lower time frame buy.
Good Luck
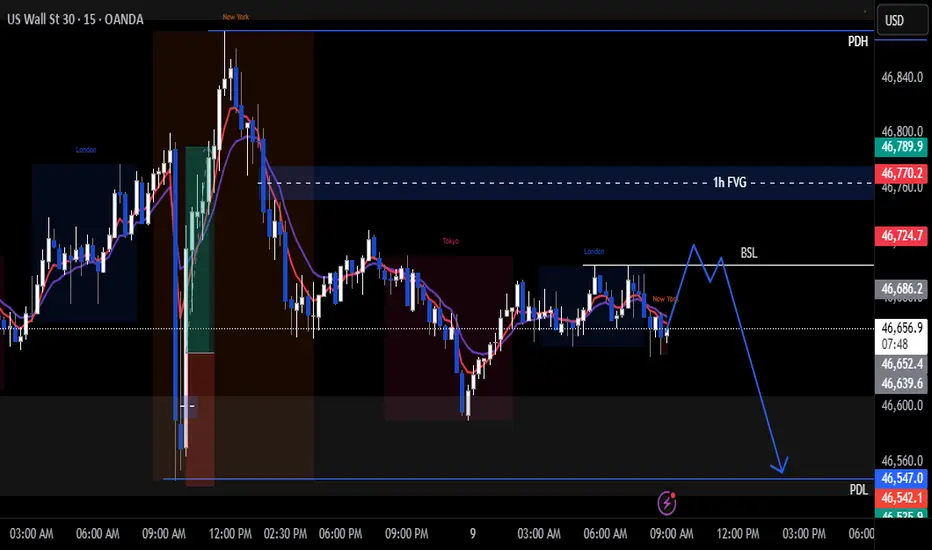
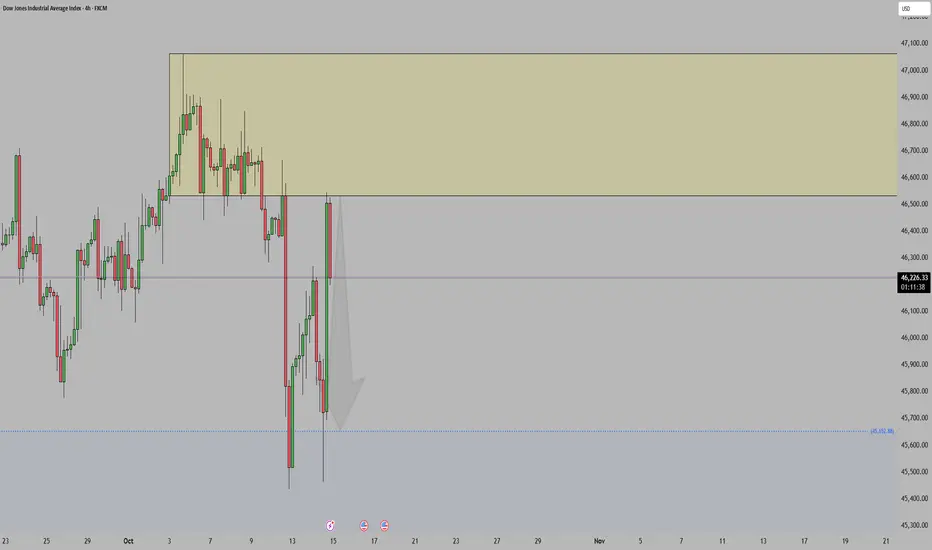
Us30 Trade Set Up Oct 10 2025Price pushed down hard yesterday confirming bearish structure and creating a 4h FVG and 1h FVG which i want to see price trade into, respect them and form internal 1m IFVG/CISD to target PDL
www.tradingview.com

Us30 Trade Set Up Secured 1500 Pips!Set Up played out perfectly with BSL being swept, CISD on the 1m and 5m to target PDL
cant get any cleaner then that

Us30 Trade Set Up Oct 9 2025overall i am bearish so i will be looking for sells after BSL/London highs get swept or the 1h FVG gets tapped to target PDL
www.tradingview.com
DOW JonesUS 30 - DJI Dow Jones
- Bullish Channel as an corrective pattern in Short Time Frame
- Break of Structure
- Demand Zone
- Completed " 1234 " Impulsive Waves
- RSI - Divergence

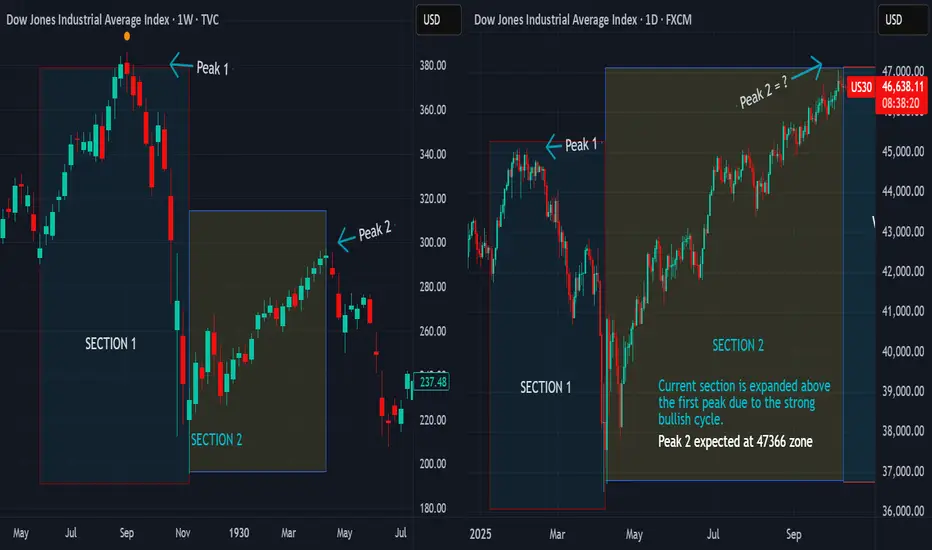
MARKETS AT CROSSROADS... THE STORIES OF TOMMORROWA picture is worth a thousand words.
We are comparing the 7-months cycle currently unravelling with its fractal counterparts that have repeated with striking periodicity in the past.
We will compare the trends that follow the completion of the cycle in each of the fractals.
Fractal 1 - (28/06/1965 - 07/02/1966) compared to (07/04/2025 to present)
Fractal 2 (19/10/1987 - 16/07/1990) compared to present
Fractal 3 (07/10/2002 - 16/10/2007) compared to present
In the last two shots, we have represented the entire 5-year cycle so we could see the entire picture for a clearer view. It is interesting to note that the last 7-months cycle is itself a fractal of the entire 5-year cycle.
There are several of them but we would represent only three to make the illustrations simpler.
FOR THE TRENDS THAT FOLLOW THE COMPLETION OF THESE FRACTALS...
April 1930 - July 1932
Feb 1966 - October 1966
July 1990 - October 1990
October 2007 - March 2009
5 out of 5 the market corrected at completion of this cycle. Also by observation the declines are sharp and the recoveries are massive, starting a second wave of hyper-bullish trends
TWO OCCASSIONS WHERE THE CORRECTION WAS PROLONGED
WHATS AHEAD...?
Markets are running into a correction, between October 2025 to February 2026, we expect wide asset classes and global indices to stage a correction. The correction should be quick and sudden which likely would complete in April 2026. A second wave of sharp bullish trend would follow into 2027. We expect a second correction that could start from Feb/March 2027 making a bottom in October 2027. This bottom will be the base for the next 5-year hyper-bullish trend completing the entire 13-year Cycle from 2020.
Follow and check back for the price levels breakdown
Trade safe and good luck.
The ugliest crash in our history close? I truly believe with western powers developing digital IDs and other technology, etc. to monitor and control the public... and in some cases replace the human race... it's in line with what I believe will be one of the biggest market crashes in human history, equal or bigger to 1929.
GET READY.
IT WILL HAPPEN WITHIN THE BLACK ZONE.
The powers in control know!
The 2030 Agenda is prepared for this.
And they are keeping the public distracted.
History repeats!
There is a purpose to everything!

US30DJI - Dow Jones
- Bullish Channel as an corrective pattern in Long Time Frame
- Break of Structure
- Fibonacci Level - 38.20% / 50.00%
- Completed " 12345 " Impulsive Waves and " A " Corrective Waves
- Demand Zone

US30 H4 | Bullish RiseDow Jones (US30) has reacted off the buy entry at 45,831.82, which is a pullback support and oculd potentially rise from this level to the take profit.
Stop loss is at 45,441.31, which is a pullback support.
Take profit is at 46,530.01, which is an overlap resistance.
High Risk Investment Warning
Trading Forex/CFDs on margin carries a high level of risk and may not be suitable for all investors. Leverage can work against you.
Stratos Markets Limited (tradu.com ):
CFDs are complex instruments and come with a high risk of losing money rapidly due to leverage. 65% of retail investor accounts lose money when trading CFDs with this provider. You should consider whether you understand how CFDs work and whether you can afford to take the high risk of losing your money.
Stratos Europe Ltd (tradu.com ):
CFDs are complex instruments and come with a high risk of losing money rapidly due to leverage. 66% of retail investor accounts lose money when trading CFDs with this provider. You should consider whether you understand how CFDs work and whether you can afford to take the high risk of losing your money.
Stratos Global LLC (tradu.com ):
Losses can exceed deposits.
Please be advised that the information presented on TradingView is provided to Tradu (‘Company’, ‘we’) by a third-party provider (‘TFA Global Pte Ltd’). Please be reminded that you are solely responsible for the trading decisions on your account. There is a very high degree of risk involved in trading. Any information and/or content is intended entirely for research, educational and informational purposes only and does not constitute investment or consultation advice or investment strategy. The information is not tailored to the investment needs of any specific person and therefore does not involve a consideration of any of the investment objectives, financial situation or needs of any viewer that may receive it. Kindly also note that past performance is not a reliable indicator of future results. Actual results may differ materially from those anticipated in forward-looking or past performance statements. We assume no liability as to the accuracy or completeness of any of the information and/or content provided herein and the Company cannot be held responsible for any omission, mistake nor for any loss or damage including without limitation to any loss of profit which may arise from reliance on any information supplied by TFA Global Pte Ltd.
The speaker(s) is neither an employee, agent nor representative of Tradu and is therefore acting independently. The opinions given are their own, constitute general market commentary, and do not constitute the opinion or advice of Tradu or any form of personal or investment advice. Tradu neither endorses nor guarantees offerings of third-party speakers, nor is Tradu responsible for the content, veracity or opinions of third-party speakers, presenters or participants.

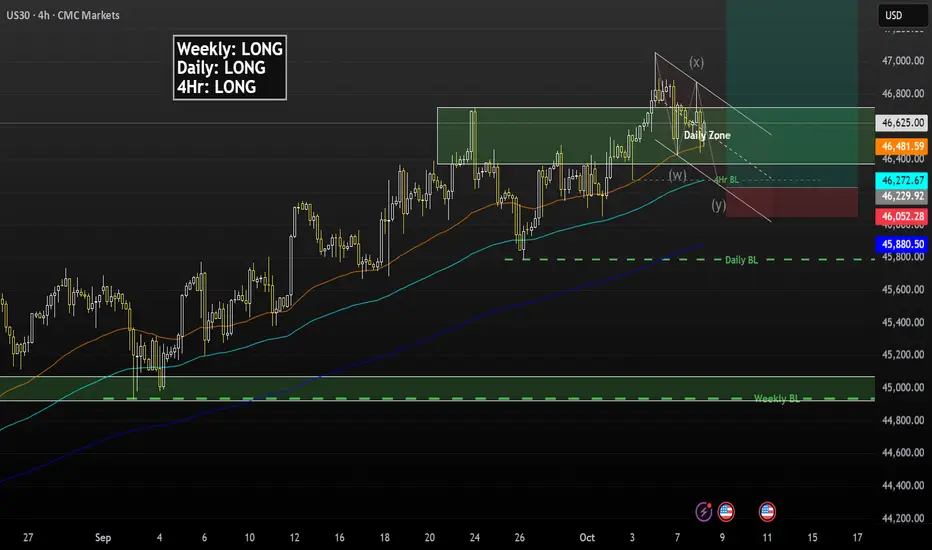
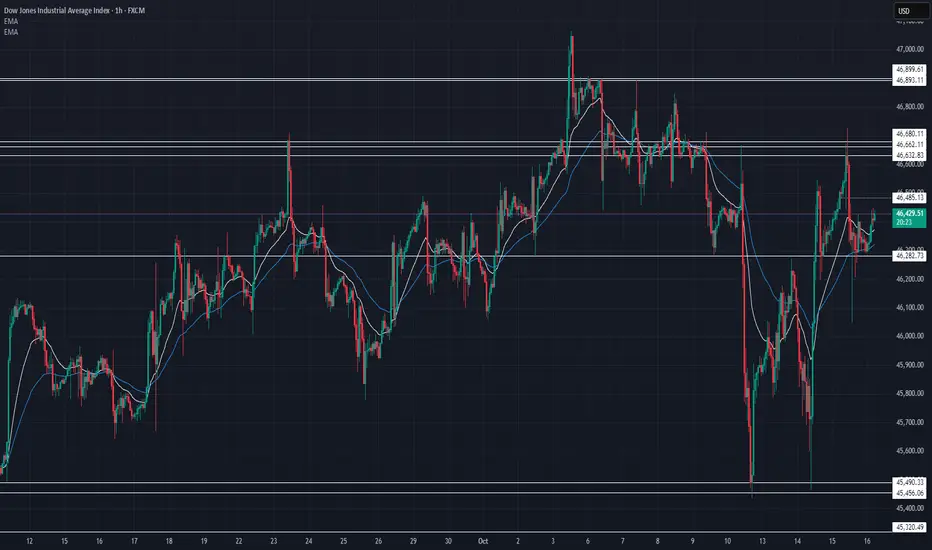
US30 Technical Breakdown – 10/16/2025📍 US30 Technical Breakdown – 10/16/2025
US30 showing strength again after defending the 46,200 zone 💪 Bulls holding control short-term but facing heavy resistance near 46,480–46,680. Market looks coiled for a breakout move soon ⚡️
📊 Market Behavior:
🔹 Strong bounce off 46,200 support zone
🔹 EMAs crossing bullishly on lower timeframes
🔹 Price retesting mid-range resistance — watching for momentum continuation
📌 Key Levels:
🔹 Resistance Zones:
46,485 → intraday barrier
46,632 → strong resistance
46,680 → breakout confirmation 🚀
46,893 → extended target
🔹 Support Zones:
46,282 → short-term support
46,200 → major pivot
45,837 → lower demand
🧠 Bias:
Bullish–Neutral 🟢
➡️ Above 46,680 → room toward 46,900
⬅️ Below 46,200 → momentum shift back to bears
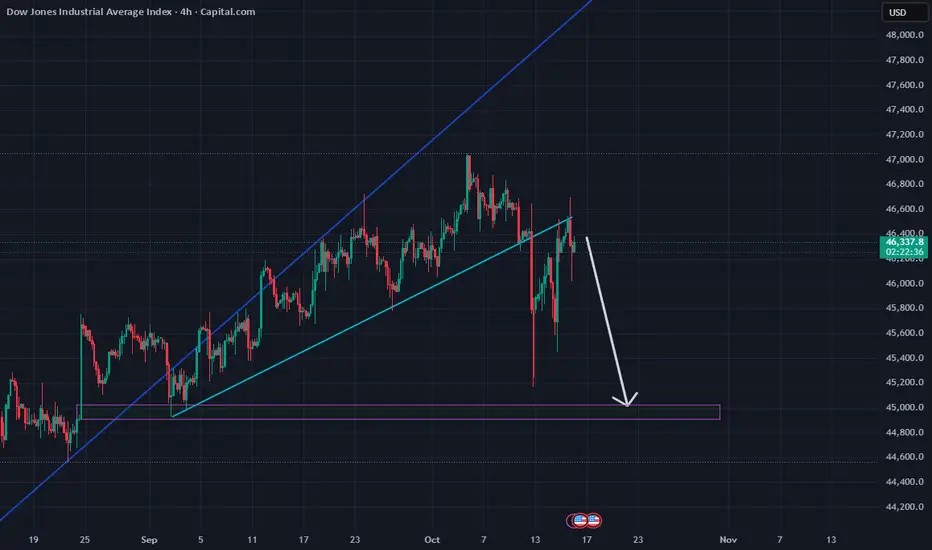
US30The Dow looks fragile. After running hard, momentum is slowing. It’s bumping into resistance zones while technicals suggest a pullback may be looming. If key support breaks, we could see a sharp slide.
Dow Jones (US30) Analysis:The Dow Jones index continues to move in a short-term bearish trend, currently testing a key support level around 46,300.
🔻 Bearish Scenario:
If the price breaks below 46,300 and holds, it may head toward the liquidity zone near 46,100.
🔺 Bullish Scenario:
If the index rebounds from the current support and breaks above 46,490, it could push higher toward 46,650.
📌 Best Buy Zones: On a rebound from 46,300 or 46,100
📍 Best Sell Zone: Below 46,300

Decrease in the first two days of the week and then a new highFor the next two days, the Dow Jones index will follow the trend shown. First, there will be a downward movement, and after the cycle closes, the movement will increase and grow towards a new price record at the ceiling.

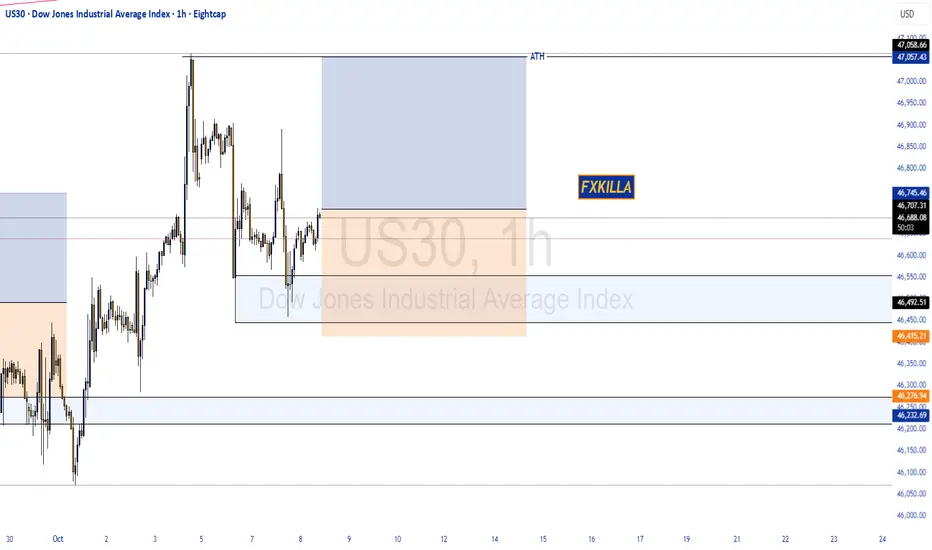
DOW JONES HIGH PROBABILITY SETUP SOON!!!🚨 DOW30 HIGH PROBABILITY BUY SETUP 🚨
* Here We Can See Clearly The Next Potential Move For US30 Coming Hours/Days.
* Keep Your Eyes Close On Your Trading Positions.
* Happy PIP Hunting Traders.
FXKILLA.
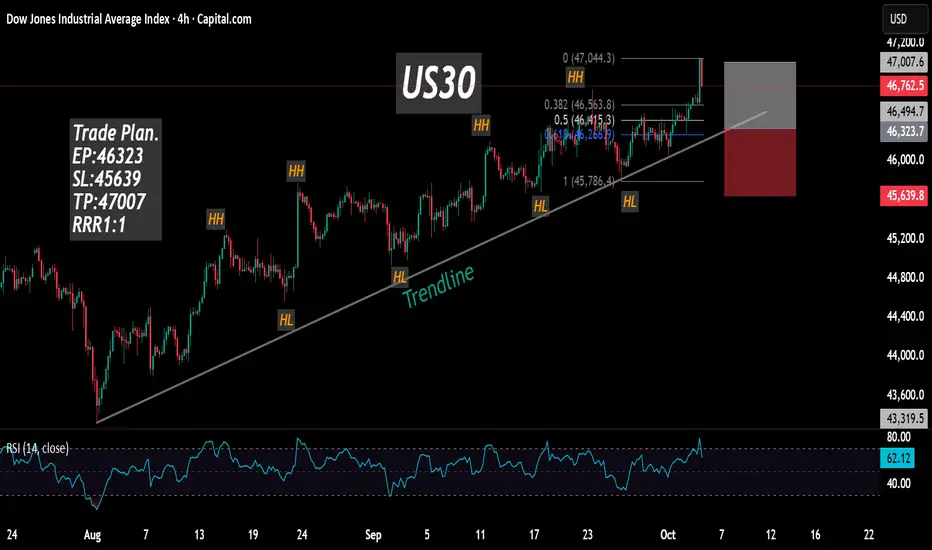
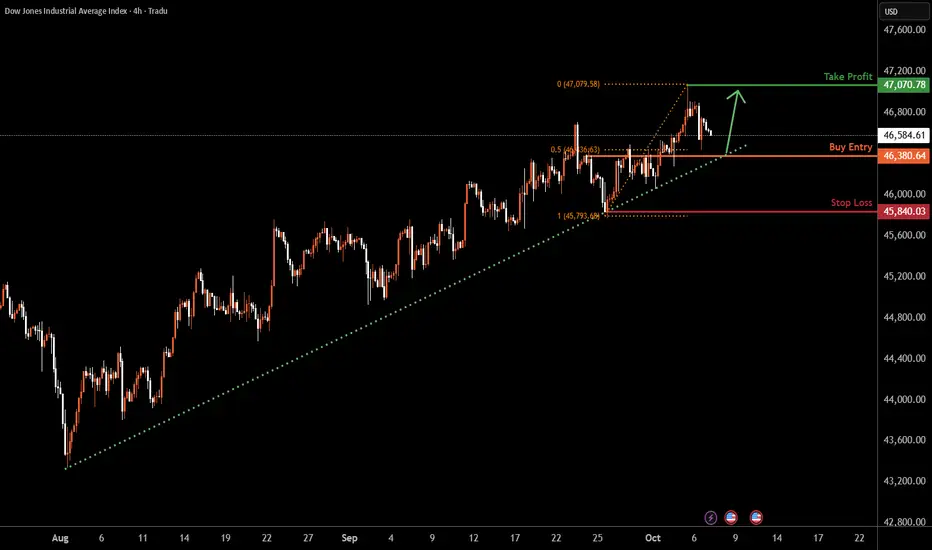
US30 H4 | Continuation Of Bullish MomentumBased on the H4 chart analysis, we could see the price fall to the buy entry at 46,380.64, whichis a pullback support that aligns with the 50% Fibonacci retracement and could bounce from this level to the upside.
Stop loss is at 45,840.03, which is a pullback support.
Tak eporfit is at 47,070.78, which is a swing high resistance.
High Risk Investment Warning
Trading Forex/CFDs on margin carries a high level of risk and may not be suitable for all investors. Leverage can work against you.
Stratos Markets Limited (tradu.com ):
CFDs are complex instruments and come with a high risk of losing money rapidly due to leverage. 65% of retail investor accounts lose money when trading CFDs with this provider. You should consider whether you understand how CFDs work and whether you can afford to take the high risk of losing your money.
Stratos Europe Ltd (tradu.com ):
CFDs are complex instruments and come with a high risk of losing money rapidly due to leverage. 66% of retail investor accounts lose money when trading CFDs with this provider. You should consider whether you understand how CFDs work and whether you can afford to take the high risk of losing your money.
Stratos Global LLC (tradu.com ):
Losses can exceed deposits.
Please be advised that the information presented on TradingView is provided to Tradu (‘Company’, ‘we’) by a third-party provider (‘TFA Global Pte Ltd’). Please be reminded that you are solely responsible for the trading decisions on your account. There is a very high degree of risk involved in trading. Any information and/or content is intended entirely for research, educational and informational purposes only and does not constitute investment or consultation advice or investment strategy. The information is not tailored to the investment needs of any specific person and therefore does not involve a consideration of any of the investment objectives, financial situation or needs of any viewer that may receive it. Kindly also note that past performance is not a reliable indicator of future results. Actual results may differ materially from those anticipated in forward-looking or past performance statements. We assume no liability as to the accuracy or completeness of any of the information and/or content provided herein and the Company cannot be held responsible for any omission, mistake nor for any loss or damage including without limitation to any loss of profit which may arise from reliance on any information supplied by TFA Global Pte Ltd.
The speaker(s) is neither an employee, agent nor representative of Tradu and is therefore acting independently. The opinions given are their own, constitute general market commentary, and do not constitute the opinion or advice of Tradu or any form of personal or investment advice. Tradu neither endorses nor guarantees offerings of third-party speakers, nor is Tradu responsible for the content, veracity or opinions of third-party speakers, presenters or participants.
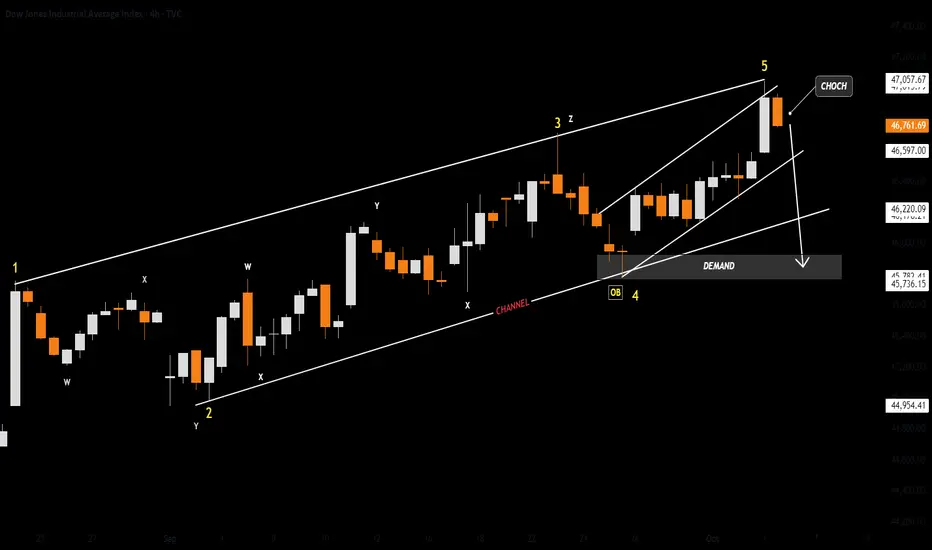
US30DJI - Dow Jones
- Break of Structure
- Bullish Channel as an corrective pattern in Short Time Frame
- Completed " 12345 " Impulsive Waves
- Change of Characteristics
- Order Block
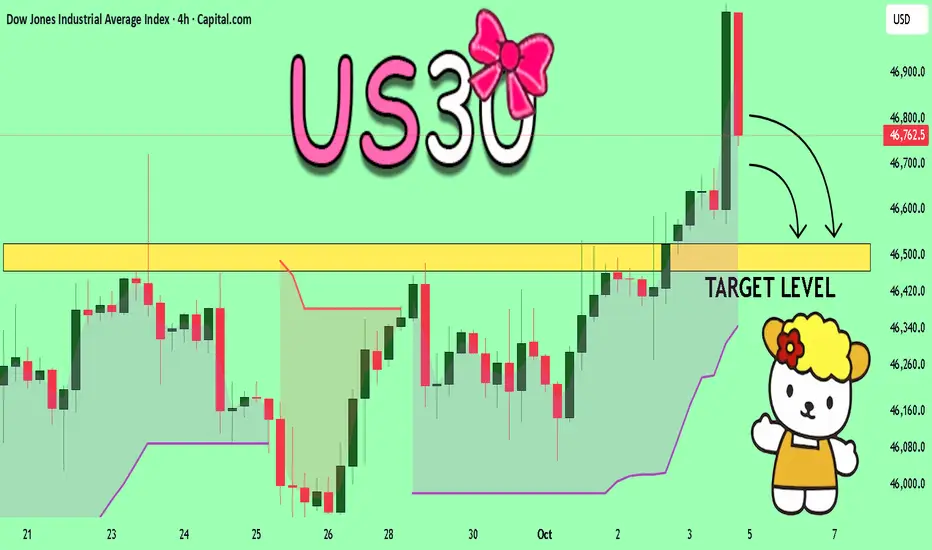
US30 Will Collapse! SELL!
My dear followers,
This is my opinion on the US30 next move:
The asset is approaching an important pivot point 46.762
Bias - Bearish
Technical Indicators: Supper Trend generates a clear short signal while Pivot Point HL is currently determining the overall Bearish trend of the market.
Goal - 46.525
About Used Indicators:
For more efficient signals, super-trend is used in combination with other indicators like Pivot Points.
Disclosure: I am part of Trade Nation's Influencer program and receive a monthly fee for using their TradingView charts in my analysis.
———————————
WISH YOU ALL LUCK