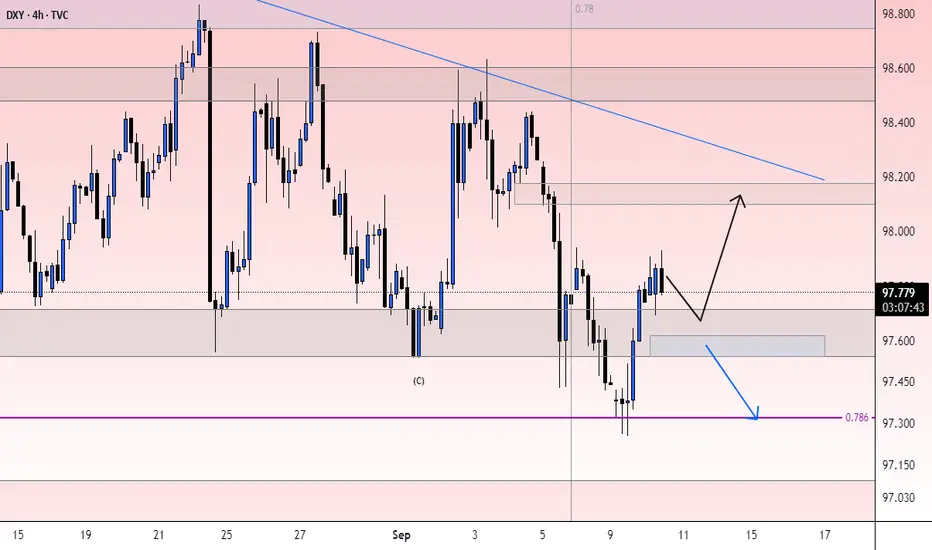
DXY ready to resume downtrend!97.94 Level on DXY is a high liquidity zone as in the falling market there is bounce off to 97.937. Price grabbed liquidity and started to drop again to the major direction of the trend. As it is a long term down trend and price just rejected from a high liquidity zone, it is a high probability price may continue to drop to this support level as multiple timeframe trend is bearish.
USDX trade ideas

uptrendThe downward trend in the current support range is expected to end and we will witness the beginning of the upward trend.
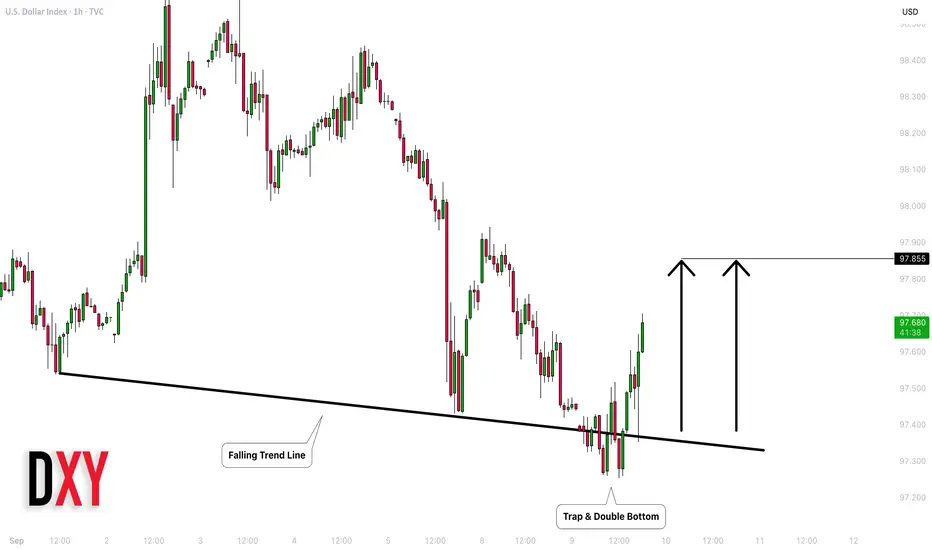
DOLLAR INDEX (DXY): Time to Recover
US Dollar finally shows a strength after a false violation
of a trend line and a formation of a double bottom pattern.
The index will most likely reach 97.85 level soon.
❤️Please, support my work with like, thank you!❤️
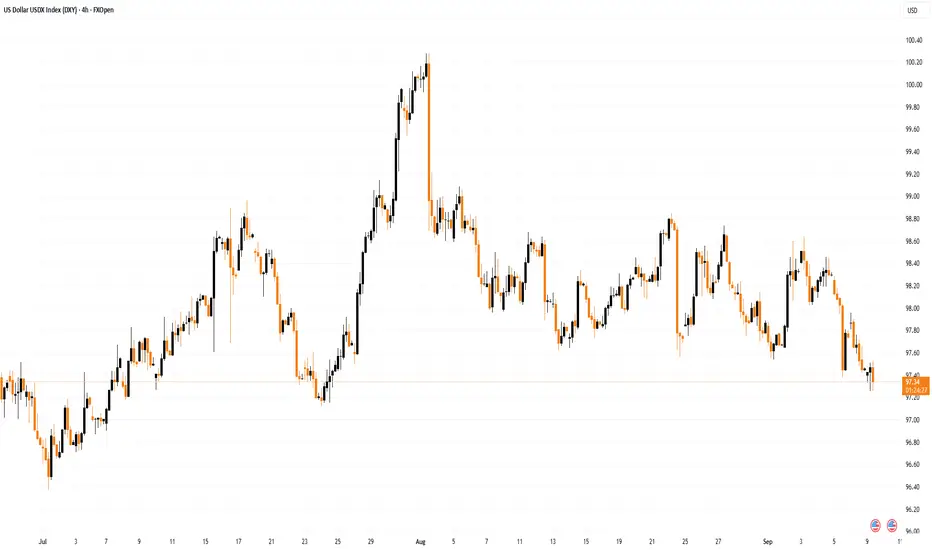
US Dollar Index Drops to 7-Week Low Ahead of Key Inflation DataUS Dollar Index (DXY) Drops to 7-Week Low Ahead of Key Inflation Data
As the US Dollar Index (DXY) chart shows, the value of the USD against a basket of other currencies has fallen below 97.30 – its lowest level since late July.
The reasons lie in market sentiment ahead of major data releases:
→ On Wednesday at 15:30 GMT+3, Producer Price Index (PPI) figures will be published; a month ago they came in extremely high.
→ On Thursday at 15:30 GMT+3, Consumer Price Index (CPI) figures are due.
These releases are particularly significant as next week the Federal Reserve is set to announce its decision on interest rates – a 25-basis-point cut is widely expected.
Technical Analysis of the DXY Chart
On 18 August, we identified a descending channel (shown in red) based on a sequence of lower highs and lower lows → it remains valid.
In addition, our base scenario suggested that the index might test one of the quartile lines (QL and/or QH) dividing the channel → indeed, since then the QH line has been tested several times (red arrow), convincingly acting as resistance.
What Next?
Bearish case:
→ Lower highs and lows throughout the second half of August indicate that sellers are in control of the DXY market.
→ The black arrow marks bearish momentum that broke through support at 98.05 last week.
→ The drop was sharp (a sign of imbalance in favour of sellers), and yesterday the 98.05 level acted as resistance.
Bullish case:
→ The DXY has dropped into the median zone, where supply and demand often balance. Buyers may step in, viewing current levels as attractive for entry.
→ The RSI may potentially form a bullish divergence.
→ The latest candle on the right shows a long lower wick (a bullish pin bar pattern), underlining buyers’ determination.
Given the above, we could expect the DXY to hover around the median area. However, the upcoming US inflation reports could trigger volatility across financial markets. A test of support at 97.15 could occur.
This article represents the opinion of the Companies operating under the FXOpen brand only. It is not to be construed as an offer, solicitation, or recommendation with respect to products and services provided by the Companies operating under the FXOpen brand, nor is it to be considered financial advice.
DXY Key Levels to look out for DXY levels to watch out for to show signs of exhaustion for reversal points on the majors, approaching 97
DXY Analysis – Are Bad News Already Priced In?Since Trump entered the White House, the U.S. Dollar has taken a hard hit against its major counterparts, losing more than 10% overall.
But looking closer at the chart, we see a different story: since the April low around 97.80, the DXY has been stuck in a range-bound pattern, with the exception of July’s dip that was quickly reversed.
Lately, the USD has faced strong headwinds:
• Two weak NFP reports in a row.
• The Fed hinting at rate cuts.
• A constant flow of bearish headlines.
And yet, the Dollar did not collapse to fresh lows — instead, it simply revisited the same levels as before. This is a classic market signal that bad news may already be priced in.
From a technical standpoint, August was nothing but an annoying tight range:
• Support around 97.50.
• Resistance near 98.50.
Now, although the index looks like it’s breaking lower, I suspect this is another false breakdown, one that could be reversed quickly. If that plays out, the stage is set for a push higher — potentially to the 100 zone, a clean 3% rise from current levels.
Such a move would naturally translate into pressure on the majors:
• EUR/USD could slide back toward 1.14.
• GBP/USD could retreat near 1.35.
For now, I’m watching closely for reversal signals. The market has punished the USD for months, but if sellers are exhausted, the Dollar may surprise to the upside. 🚀

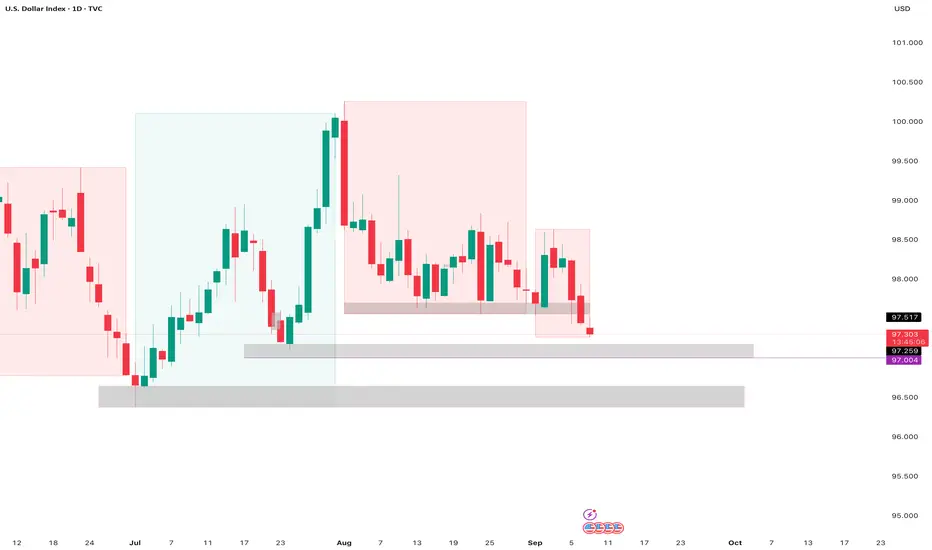
DXY Daily TF Consolidation Pending a Major BreakoutPrice has been ranging between a daily resistance and demand zone since the beginning of August. Another bounce in the demand zone this week will take price back to the resistance zone and if the resistance zone continues to hold then we short back to demand.
However, should resistance break, then the next target will be in daily supply. CPI should give us a better indication of should we get a break of this consolidation.
Personally I am leaning towards a bullish dollar for the short-term foreseeable future.

DXY Analysis – August 31, 2025In our past two weekly analyses, we highlighted the 98.00 zone as a key reversal area for the Dollar Index (DXY).
Once again, during the last week, price reacted to this level and started another bearish move.
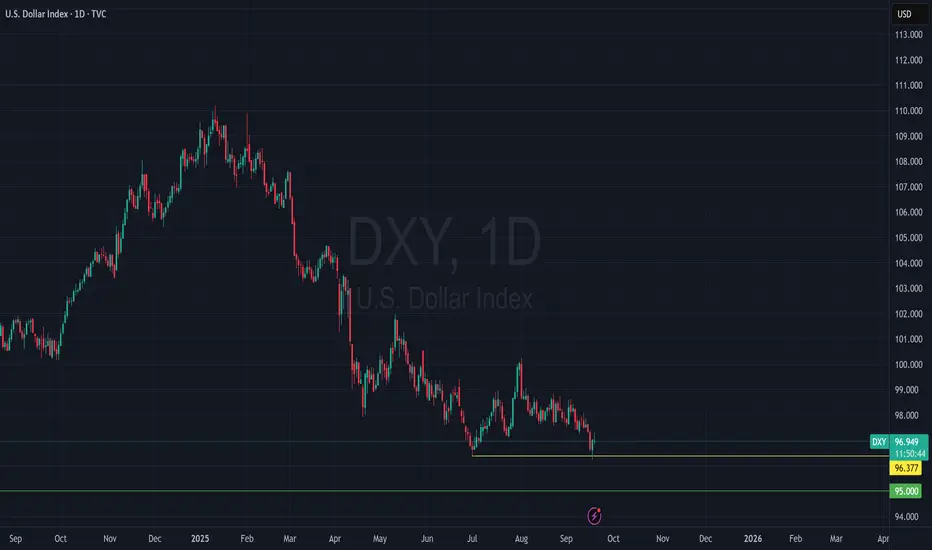
📉 The recent candlestick structure suggests that sellers are still in control, but to fully confirm downside momentum, we need at least a daily close below 97.00.
🔻 If that happens this week, the index could gradually head toward our next downside targets at 96.00 and 95.00.

DXYU.S Dollar Index
- Falling Wedge as an corrective pattern in Short Time Frame
- RSI - Divergence
- Completed " 1234 " Impulsive Waves
- Fibonacci Level - 38.20% - 50.00%
- S / R Level

DXY(Dollar Index Currency)We looking for a bullish momentum to the upside as the market has created a continuation to the upside resulting buying opportunities| 4H Timeframe

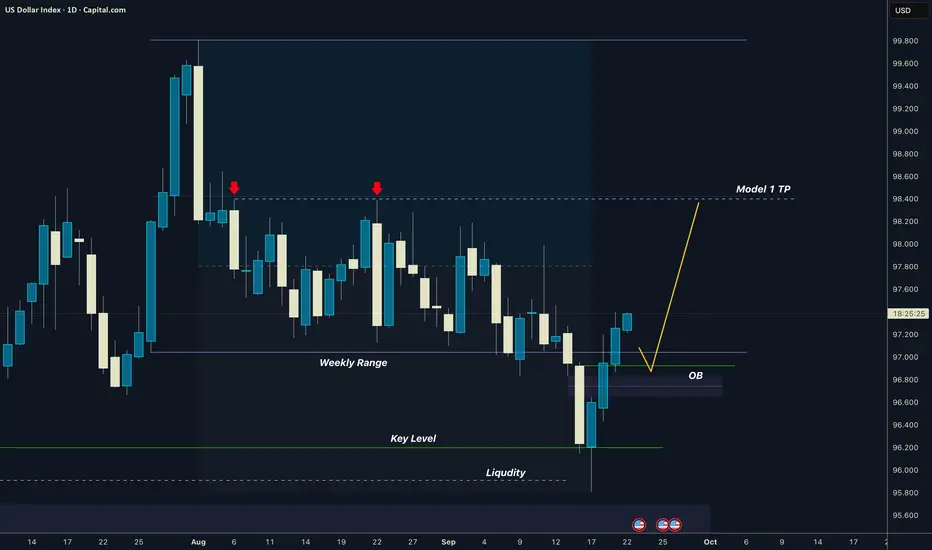
Dollar I Weekly Range I 50% Target I Model 1GM Traders, we have seen price has been accumulating thru the whole august, now it dipped bellow the range and strongly rejected and created OB. It has change to to go to 50% of that range where is doouble top liquidity which.
Have a great trading week !!
David Perk aka Dave FX Hunter
Dollar Headed Higher?Looking at the price of the dollar from a daily perspective, we can see that price accumulated for about 3 full trading weeks. Manipulation took place soon after, followed by 3 strong bullish candles.
Now that bulls have entered the market after the manipulation, I fully expect the distribution to take place after retesting the bullish FVG.
Since this is the dollar we're talking about, this price movement will most likely affect the price of other assets including Gold and dollar pairs.
Targeting the daily POI/Medium BSL.

possibility of uptrend The corrective pattern is expected to end and we will see the start of an uptrend. A break of the resistance trend line will be a confirmation of the uptrend.
If the index breaks through the support area, a downtrend scenario will be likely.

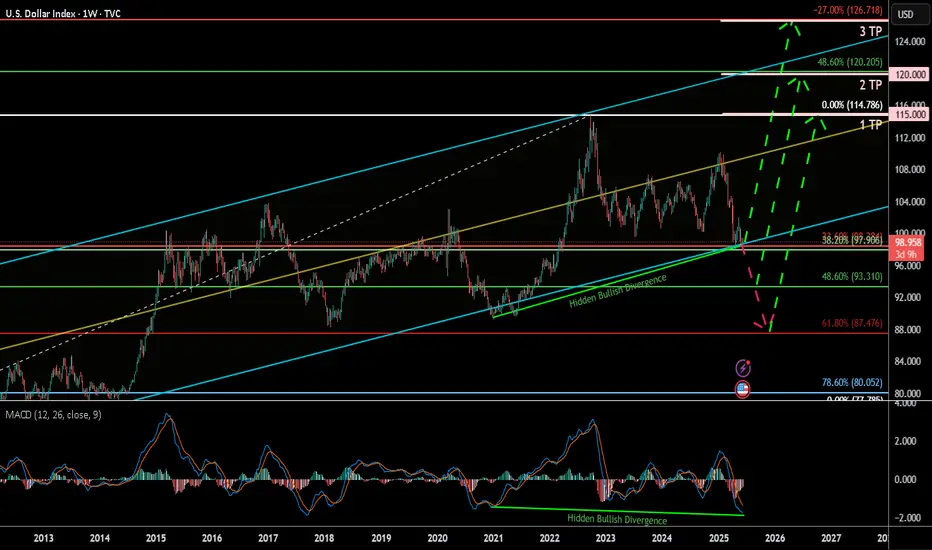
U.S. Dollar Index (DXY) Weekly 2025Summary:
The U.S. Dollar Index (DXY) has corrected down to the key 38.60% Fibonacci retracement zone and is currently showing signs of a potential bullish reversal, bolstered by a clear hidden bullish divergence on the MACD. This may signal a renewed rally toward key upside targets, especially if the 93.3–99.9 support Zone holds.
Chart Context:
Current Price: 98.864
Key Fib Support: 38.60% @ 99.906, 48.60% @ 93.310, 61.80% @ 87.476
Support Zone: 93.3–99.9 USD
Hidden Bullish Divergence: Observed both in 2021 and now again in 2025 on the MACD
Trendline Support: Long-term ascending trendline holding since 2011
Fib Extension Targets (Trend-Based):
TP1: 115.000
TP2: 120.000
TP3: 126.666
Key Technical Observations:
Fibonacci Confluence: DXY is bouncing from a strong Fib cluster between 93.310 and 99.906, historically acting as a reversal zone.
Hidden Bullish Divergence: Suggests potential upside despite price weakness.
Downtrend Retest: Price may revisit 93.3–87.4 before confirming full reversal.
Breakout Pathway: Green dashed arrows outline the likely recovery trajectory toward 114–126 range.
Indicators:
MACD: Showing hidden bullish divergence and potential signal crossover.
Trendline Support: Holding intact from 2021 low.
Fib Levels: Used for retracement and trend-based extension.
Fundamental Context:
Interest Rate Outlook: If U.S. inflation remains controlled and Fed signals future hikes or sustained high rates, DXY strength may persist.
Global Liquidity & Recession Risk: If risk aversion returns, the dollar may rise as a safe haven.
Geopolitical Risks: Conflicts, trade tensions, or BRICS dedollarization efforts may create volatility.
Our Recent research suggests the Fed may maintain higher-for-longer rates due to resilient labor markets and sticky core inflation. This supports bullish USD bias unless macro shifts rapidly.
Why DXY Could Continue Strengthening:
Robust U.S. economic performance & monetary policy divergence
U.S. GDP growth (~2.7% in 2024) outpaces developed peers (~1.7%), supporting stronger USD
The Fed maintains restrictive rates (4.25–4.50%), while the ECB pivots to easing, widening the policy and yield gap .
Inflation resilience and Fed hawkishness
Labor markets remain tight, keeping inflation “sticky” and delaying expected rate cuts; market-implied cuts for 2025 have been pushed into 2026
Fed officials (e.g. Kugler) emphasize ongoing tariff-driven inflation, suggesting rates will stay elevated.
Safe-haven and yield-seeking capital flows
With global risks, capital favors USD-denominated assets for yield and stability
Why the Dollar Might Face Headwinds
Fiscal expansion & trade uncertainty
Ballooning U.S. deficits (~$3.3 trn new debt) and erratic tariff policy undermine confidence in USD
Wall Street’s consensus bearish position.
Major banks largely expect a weaker dollar through 2025–26. However, this crowded bearish sentiment poses a risk of a sharp rebound if data surprises occur
barons
Tariff policy risks
Trump's new tariffs could dampen dollar demand—yet if perceived as fiscal stimulus, they could unexpectedly buoy the USD .
Synthesis for Our Biases
A bullish DXY thesis is well-supported by:
Economic and policy divergence (U.S. growth + Fed vs. peers).
Hawkish Fed commentary and sticky inflation.
Safe-haven capital inflows.
Conversely, risks include:
Deteriorating fiscal/trade dynamics.
Potential Fed pivot once inflation shows clear decline.
A consensus that could trigger a short squeeze or reversal if overstretched.
Philosophical / Narrative View:
The dollar remains the world’s dominant reserve currency. Periodic dips often act as strategic re-accumulation phases for institutional capital—especially during global macro uncertainty. A return toward 120+ reflects this persistent demand for USD liquidity and safety.
Bias & Strategy Implication:
1. Primary Bias: Bullish, contingent on support at 93.3–99.9 holding.
2. Risk Scenario: Breakdown below 93.3 invalidates bullish thesis and targets 87.4–80 zones.
Impact on Crypto & Gold and its Correlation and Scenarios:
Historically, DXY has had an inverse correlation to both gold and crypto markets. When DXY strengthens, liquidity tends to rotate into dollar-denominated assets and away from risk-on trades like crypto and gold. When DXY weakens, it typically acts as a tailwind for both Bitcoin and gold.
Correlation Coefficients:
DXY vs. Gold: ≈ -0.85 (strong inverse correlation)
DXY vs. TOTAL (crypto market cap): ≈ -0.72 (moderate to strong inverse correlation)
Scenario 1: DXY Rallies toward 115–126 then, Expect gold to correct or stagnate, especially if yields rise. Crypto likely to pull back or remain suppressed unless specific bullish catalysts emerge (e.g., ETF flows or tech adoption).
Scenario 2: DXY ranges between 93–105 then Gold may consolidate or form bullish continuation patterns. Then Crypto may see selective strength, particularly altcoins, if BTC.D declines.
Scenario 3: DXY falls below 93 and toward 87 Then Gold likely to rally, possibly challenging all-time highs. Crypto could enter a major bull run, led by Bitcoin and followed by altcoins, fueled by increased liquidity and lower opportunity cost of holding non-USD assets.
Understanding DXY’s direction provides valuable insight for portfolio positioning in macro-sensitive assets.
Notes & Disclaimers:
This analysis reflects a technical interpretation of the DXY index and is not financial advice. Market conditions may change based on unexpected macroeconomic events, Fed policy, or geopolitical developments.
DXY weekly outlook.Going into the new week, I expect the dollar index (DXY) to continue its bullish momentum. Price has reacted well from support and I’m anticipating a move towards the daily FVGs above.

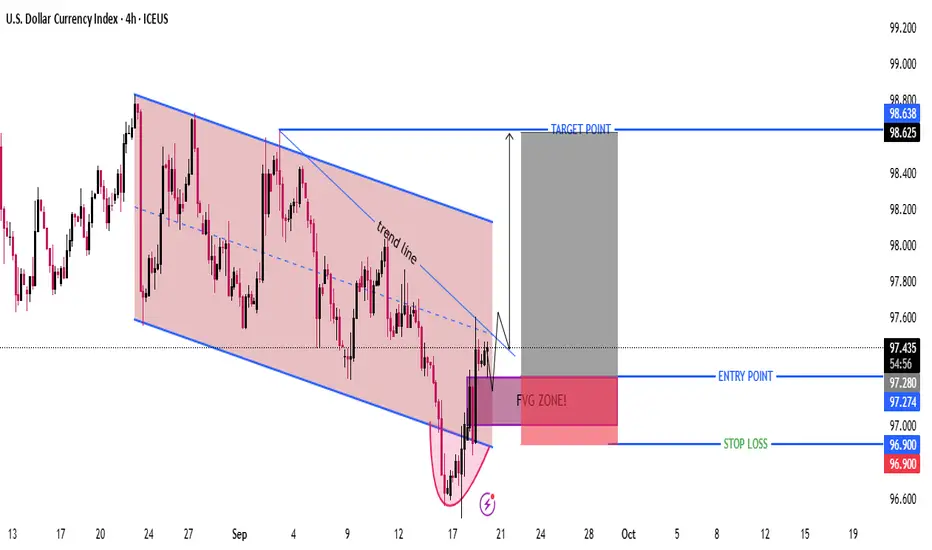
DXY 4H – Bullish Reversal Setup from FVG Zone | Target 98.63Technical Analysis
Downtrend Channel (Bearish Structure)
Price has been moving inside a descending channel (highlighted in red).
Recently, it touched the lower boundary and formed a rounded bottom pattern (possible reversal signal).
Trendline Breakout
A short-term downtrend line has been broken to the upside.
This suggests momentum is shifting from bearish to bullish.
Fair Value Gap (FVG Zone)
Price is currently testing an FVG zone around 97.00–97.28.
This zone acts as a potential entry area for long trades.
Entry, Stop Loss, and Target
Entry Point: 97.28 – 97.27
Stop Loss: 96.90 (below FVG zone support)
Target Point: 98.63
Risk–Reward Ratio: Approximately 1:3 → good setup.
Potential Scenario
If price holds above the FVG zone and doesn’t break below 96.90, we may see a bullish move toward 98.63.
But if the FVG fails and price closes below 96.90, it could resume the downtrend.
✅ Summary:
Market structure shows a possible bullish reversal after a prolonged downtrend.
A clean long setup is planned: Buy near 97.27 → Stop 96.90 → Target 98.63.
Confirmation needed: Strong bullish candle closing above the FVG zone
DOLLAR/GOLD/RATESDXY is sitting at a key monthly support.
Gold is getting extremely hot.
is it time for a flip? majority sentiment feels like gold is going up forever (i agree to an extent, but im not against some pullback/higher lows first)
FED mentioned inflation was a bit sticky.
sharing purely to see how she ages
GOLD = red
DXY = BLUE/BLACK

DXY: The Market Is Looking Down! Short!
My dear friends,
Today we will analyse DXY together☺️
The recent price action suggests a shift in mid-term momentum. A break below the current local range around 96.755 will confirm the new direction downwards with the target being the next key level of 96.629 and a reconvened placement of a stop-loss beyond the range.
❤️Sending you lots of Love and Hugs❤️
The dollar making fresh yearly lows for the FedThe dollar making fresh yearly lows yesterday for the Fed decision. 95 looks close. At some point the dollar will be on sale. Last time Trump was elected the dollar went on sale in early 2018 after a year of selling off. Will the dollar be on sale next year?
US Dollar Index - Looking To Sell Pullbacks In The Short TermM15 - Strong bearish move.
No opposite signs.
Currently it looks like a pullback is happening.
Expecting bearish continuation until the two Fibonacci resistance zones hold.
If you enjoy this idea, don’t forget to LIKE 👍, FOLLOW ✅, SHARE 🙌, and COMMENT ✍! Drop your thoughts and charts below to keep the discussion going. Your support helps keep this content free and reach more people! 🚀
-------------------------------------------------------------------------------------------------------------------

USD Index to fall fast - Mar-a-largo AccordUSD Index to fall fast - Mar-a-largo Accord
Dr Stephen Miran (Whitehouse Chief Economic advisor) set the plan for a weaker USD going forward and vast tariffs to rebalance the US trade deficit.
Yellow arrow indicates the start of 2025 and the trade tariffs. Red arrow indicates likely downward breakout of the long-term Uptrend support line.

Hmmm, DXYThere is something quite telling about the DXY that has me rubbing my chin. If the DXY continues it's downtrend this year and even next year, what would it mean for assets against the dollar, especially crypto currencies, mainly Bitcoin? Typically, Bitcoin's 4 year cycle is bearish on the 4th year but that was for the last 15 or so years when the dollar was in an uptrend. What would happen on the fourth year for Bitcoin during a crashing DXY? Is it safe to hold crypto currencies this end of cycle? I have a feeling that if the DXY continues to fall, crypto will continue to rise even during the 4th year when the bears usually take over. The take over may happen, but with a minor correction (32.8 possibly) that whiplashes a bit more than it trends, before it trends again. Stay tuned!

DXY Neutral -BearishCAPITALCOM:DXY
Quick read / bias
Near-term neutral → biased bearish.
Price has failed to produce a clean reversal from the large consolidation at the top, shows a series of lower-highs and liquidity hunts (marked ellipses / Imbalance repairs on the chart), and a visible “downside pressure” supply region above. The path of least resistance is down unless price reclaims the supply/consolidation zone above ~98.6–99.2.
------------------------------------------------
Key levels (from the chart)
Major consolidation / supply: ~99.2 – 99.8 (big-picture resistance).
Downside pressure / mid supply: ~98.5 – 98.8 (area to sell into).
Recent micro highs: 98.39, 98.19, 97.99 (loci for liquidity).
Current price (chart right): ~97.18.
Recent local low/liquidity grab: 96.834.
Weekly void / structural bottom to watch: 96.478 (labelled on chart).
Invalidation for bearish thesis: close/hold above 99.2 (reclaim of consolidation).
------------------------------------------------
How I read the structure (step-by-step)
Price spent time in a higher consolidation zone and then failed to reverse higher — that is a distribution / supply footprint rather than demand.
The chart shows several short liquidity hunts above swing highs (grey ellipses) and subsequent strong selling — classic stop-hunts into supply then continuation lower.
Imbalances / small supply boxes on the chart mark places the market tends to retest before continuing — these are high-probability sell zones on rallies.
The sequence of lower highs and a recent push down to ~96.83 (buyer defence) gives a local support but not yet a valid reversal signal. Until price chops through the weekly void (96.478) or reclaims the supply, expect range/biased-down behavior.
------------------------------------------------
Trade setups (actionable — use your 5-min/1-min workflow)
I’ll give two primary setups: a higher-probability short (sell the rally) and a contrarian long (mean-reversion). Use 5-min to identify displacement into the zone and 1-min for the exact micro reversal entry.
------------------------------------------------
Setup A — Primary: Short on rally into supply (preferred)
Why: Market structure + downside pressure + Imbalance above make rallies into supply favourable.
Area to enter (limit or wait for 1-min reversal): 98.00 – 98.20 (ideal limit ~98.10).
Stop loss: 98.45 (just above the 98.39 / structure swing and above the Imbalance top).
Targets (scale):
T1: 97.00 — first logical demand and psychological level.
T2: 96.50 — deeper swing support / mid structural level.
T3: 96.478 — weekly void bottom (big target if momentum continues).
Risk / reward (example entry 98.10 → stop 98.45):
Risk = 0.35 index points.
R:T1 ≈ 1.10 / 0.35 ≈ 3.14:1.
R:T2 ≈ 1.60 / 0.35 ≈ 4.57:1.
R:T3 ≈ 1.622 / 0.35 ≈ 4.63:1.
Trigger: 5-min displacement into the 98.0–98.2 zone, then 1-min rejection pattern (pin bar / engulf / two-bar reversal) and ideally a filled Imbalance or wick extension that fails. Enter limit at Imbalance top or use a short after 1-min confirmation.
------------------------------------------------
Setup B — Secondary: Mean-reversion long (countertrend)
Why: Buyers defended the 96.83 area previously; a clean, verified micro reversal at lower support can produce a quick retrace. This is lower probability vs the sell-the-rally plan and should be sized smaller.
Area to enter (limit/1-min confirmation): 96.75 – 96.95 (example limit 96.85).
Stop loss: 96.45 (below the 96.48 weekly void and the local wick).
Targets (scale):
T1: 97.40 (near recent chop / first structure).
T2: 97.99 (previous micro high).
T3: 98.39 (if momentum shifts to reclaim structure).
Risk / reward (example entry 96.85 → stop 96.45):
Risk = 0.40.
R:T1 ≈ 0.55 / 0.40 ≈ 1.38:1.
R:T2 ≈ 1.14 / 0.40 ≈ 2.85:1.
R:T3 ≈ 1.54 / 0.40 ≈ 3.85:1.
Trigger: Look for a 5-min exhaustion and 1-min clean micro reversal (two-bar bullish rejection) ideally with buy volume or a wick that holds. Keep size smaller than on shorts.
------------------------------------------------
Intraday scalp idea (quick)
Long scalp on a 1-min reversal after a displacement down to ~96.83 with tight stop under the wick (e.g. 5–8 ticks) and target 97.20–97.40. Use only if price shows clean microstructure and momentum.
Trade management rules
Positioning: Risk a fixed % per trade (e.g., 0.5–1% of account) and size accordingly. The short setup has high RR — size to risk tolerance.
Partial take: Take ~50% at T1, move stop to breakeven, let remainder run to T2/T3.
If price stalls at T1: tighten stop to lock profit or exit if structure shows weakness.
If price breaks and holds above 98.60 / 99.2: exit shorts and flip to neutral/bullish plan — the initial bearish thesis is invalidated.
Use your timeframe combo: identify the displacement on 5-min, execute 1-min entry confirmation.
------------------------------------------------
Invalidation / alternative scenario
Bearish invalidation: clean, sustained close above 98.6–99.2 (consolidation re-claim) — if that happens, the market likely shifts to bullish and short ideas should be abandoned.
Bullish trigger: rally above 99.2 with follow-through and a higher low -> targets back toward 99.8.
------------------------------------------------
Final prediction
Over the next sessions I expect failed rallies into 98.0–98.6 to be sold, which should gravitate price toward 97.00 → 96.50 → 96.48 if momentum confirms. Countertrend longs are possible as scalps/swing trades off 96.8–96.48, but they should be treated as lower-probability and sized smaller. If price instead reclaims and holds >99.2, the bearish bias is invalidated.
