Dollar Index attempt.Trump has done something that has kept the Dollar Index below the key level of 100 for nearly 100 days, and despite all its attempts, it hasn’t even come close to that zone so far.
If it manages to strongly break through the 99 level, there might be hope that in the coming weeks it could return to its original position above 100.
USDX trade ideas

DXY - long move aheadDXY - long move ahead, because of the shify of structure we can see a very clean long setup

LOOKING BEARISHThe DXY looks bearish mainly because markets expect the Fed to cut rates soon, which lowers dollar yields. At the same time, Treasury rallies, inflation fears, and fiscal dominance concerns are hurting confidence in the dollar. Technically, DXY has also broken key support levels, with momentum pointing lower. Investors are increasingly hedging dollar exposure, adding further downside pressure.

U.S. Dollar Index (DXY):The index is currently trading around 97.90 after a sharp drop from 98.80. Possible scenarios:
1️⃣ Bearish Scenario:
If the price fails to reclaim the 98.00 zone and breaks below 97.75, further downside could extend toward 97.50 and 97.30.
2️⃣ Bullish Scenario:
If the index breaks and holds above 98.00, bullish momentum may target 98.30 followed by 98.55.
📌 The 98.00 level is the key pivot to watch for the next move.

DXY outlookDXY. On the weekly time frame price looks bearish but on the daily time frame there is a shift in structure. So currently price is on a discount level which looks good for buys in other to take out Fridays high and above.

DXY COUNTERTREND BUYS | 25 AUG🧃 DXY Signal – Liquidity got cooked edition
Daily got slapped bearish after Friday’s LQ sweep, but 1H said “lemme cook” 🔥
Price tapped the discount zone → setup valid ✅
First pitstop = Asian highs 🚏 (97.93)
Uber target = Orderflow station 🎯 (98.15 – 98.20)
SL chilling under 97.80 🛑 (if we break that, pack it up)
RRR chef’s kiss ~1:3 💋📈
Outlook: Bears had their fun, now bulls spinning the block for a quick correction rally. Don’t fight it, just ride it 🚀

DXY | daily sentiment After big LQ sweeps after the Powell speech I believe market as a high probability of piulling back up to upside Orderflow to collect some orders and FVG are open in discount price
personally I dont trade DXY but it proides good sentiment for the other correlating pairs... therefore for a more refined entry model, feel free to drop to the lower TF and seek proper cornfimation.
feel free to share your opponions of the trade in commment section, @sam_trades_smc

BUY DXYUS Dollar Index (DXY) is showing bullish momentum, targeting a move higher from 98.756. The market favors buyers above recent support, so maintain a long bias. Place stops below the latest swing low to manage risk.

DXYThis is look like that market try to make a bullish flag but the support line are not so much strong so i gonna sell cause the seller have more pressure

Bullish bounce off pullback support?The US Dollar Index (DXY) is falling towards the pivot and could bounce to the 1st resistance, which acts as a swing high resistance.
Pivot: 97.19
1st Support: 96.36
1st Resistance: 100.07
Risk Warning:
Trading Forex and CFDs carries a high level of risk to your capital and you should only trade with money you can afford to lose. Trading Forex and CFDs may not be suitable for all investors, so please ensure that you fully understand the risks involved and seek independent advice if necessary.
Disclaimer:
The above opinions given constitute general market commentary, and do not constitute the opinion or advice of IC Markets or any form of personal or investment advice.
Any opinions, news, research, analyses, prices, other information, or links to third-party sites contained on this website are provided on an "as-is" basis, are intended only to be informative, is not an advice nor a recommendation, nor research, or a record of our trading prices, or an offer of, or solicitation for a transaction in any financial instrument and thus should not be treated as such. The information provided does not involve any specific investment objectives, financial situation and needs of any specific person who may receive it. Please be aware, that past performance is not a reliable indicator of future performance and/or results. Past Performance or Forward-looking scenarios based upon the reasonable beliefs of the third-party provider are not a guarantee of future performance. Actual results may differ materially from those anticipated in forward-looking or past performance statements. IC Markets makes no representation or warranty and assumes no liability as to the accuracy or completeness of the information provided, nor any loss arising from any investment based on a recommendation, forecast or any information supplied by any third-party.

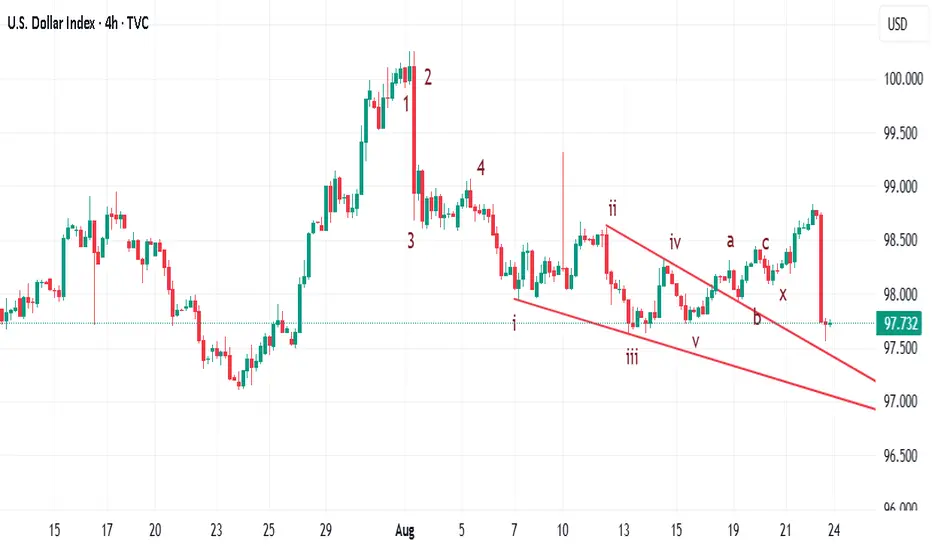
DXY correction and continuationFrom a wider perspective....the long term correction was a very shallow 3 wave correction (a) (b) and (c)....and the bearishcontinuation has begun
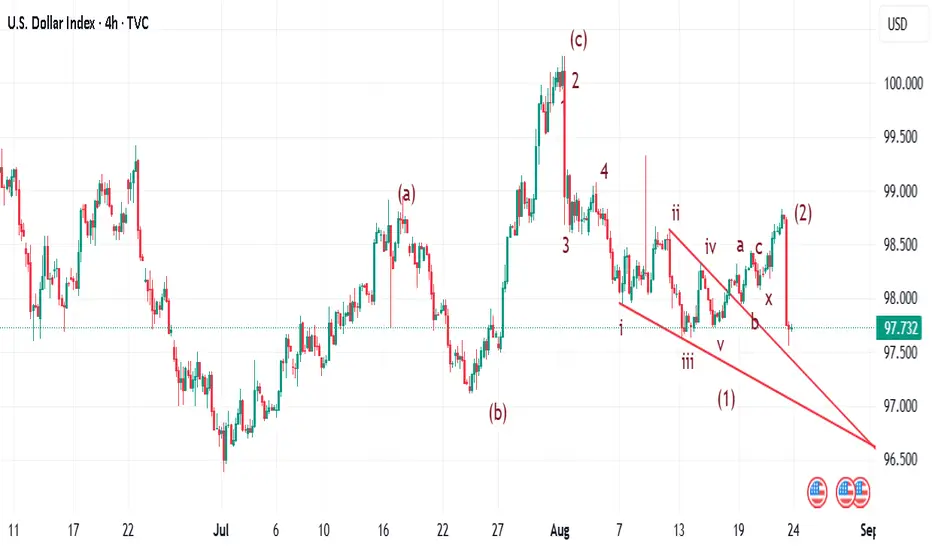
DXY wave count case for bearish continuationThis is a case for bearish continuation after a very shallow bullish correction
US Dollar: Bearish August. Rate Cuts Likely. Sell USD?Welcome back to the Weekly Forex Forecast for the week of Aug 25 - 29th.
In this video, we will analyze the following FX market: USD Dollar
The USD has been weak since the start of August. It took a huge move down Friday with FED Chairman Powell's dovish take on rate cuts.
So, this market is is not one to take buys in.
However, we are still in correction territory, looking at the Monthly and Weekly candles. Be mindful that the market can find support at current levels, even though it has been bearish for 7+ months. The Swing Low has not been violated as yet.
Be cautious. No buys are justified without a Bullish BOS. Sells are the best best, but keep your head on a swivel!
React and do not predict.
Enjoy!
May profits be upon you.
Leave any questions or comments in the comment section.
I appreciate any feedback from my viewers!
Disclaimer:
I do not provide personal investment advice and I am not a qualified licensed investment advisor.
All information found here, including any ideas, opinions, views, predictions, forecasts, commentaries, suggestions, expressed or implied herein, are for informational, entertainment or educational purposes only and should not be construed as personal investment advice. While the information provided is believed to be accurate, it may include errors or inaccuracies.
I will not and cannot be held liable for any actions you take as a result of anything you read here.
Conduct your own due diligence, or consult a licensed financial advisor or broker before making any and all investment decisions. Any investments, trades, speculations, or decisions made on the basis of any information found on this channel, expressed or implied herein, are committed at your own risk, financial or otherwise.

DXY4HIn this series of analyses, we have reviewed trading perspectives and short-term outlooks.
As can be seen, in each analysis there is a key support/resistance zone close to the current asset price, and the market’s reaction or breakout at this level will determine the next price trend toward the specified targets.
Important note: The purpose of these trading perspectives is to highlight significant levels ahead of the price and potential market reactions to these levels. The provided analyses are by no means trading signals!

DXYDXY needs a pullback and then further downside will prevail.
Disclosure: We are part of Trade Nation's Influencer program and receive a monthly fee for using their TradingView charts in our analysis.

DXY: False Breakout, Targets BelowHi traders and investors!
This analysis is based on the Initiative Analysis concept (IA).
On the daily timeframe, the Dollar Index is in a sideways range. Upper boundary 98.959, lower boundary 95.906.
We see a familiar false breakout pattern of the upper boundary of the range. The price then returned back into the range with a seller IKC candle (the highest-volume candle within the initiative).
During this false breakout, the price moved above the 50% level of the last seller initiative on the weekly timeframe, which strengthens the pattern.
I am waiting for the first target at 96.66 and the second target at 95.90.
As a reminder, my broader expectation is a move toward 94.6. Indirectly, the likelihood of continued decline in the Dollar Index is supported by the fact that the sideways range has expanded more to the downside than to the upside.
Wishing you profitable trades!

DXY BullsOver the past few weeks I have been bullish on the Dollar and still remain bullish until I see something suggesting otherwise

TOP DOWN ANALYSIS OF DXY weekly timeframe
applying dow theory to the downside.
recent lows broken with an impulsive bearish move.
an fvg left behind, likely to be filled later.
after breaking recent lows and the 100 monthly key level, price shows weakness with a bullish falling flag.
expecting an extension toward the weekly cp level @95 weekly key level.
tdi
sharkfin to the left signaled a reversal (confirmed).
looking for proper divergence and a w-pattern in line with technicals.
ideally, a head and shoulders on tdi with the second shoulder at the mbl or a bounce on the signal line.
anticipating an extension to the bands, with rsi reaching or approaching extreme levels.

DXY 95anticipating a continuation lower from the dollar index as foreign currencies maintain their footing for higher pricing.
using COT data we should see commercials reduce their long positioning in the USD majors over the next 6 months.
within the span of 6 months we have 4 scheduled fed meetings
- sept 17
- oct 29
- dec 10
- jan 28
as well as FOMC minutes scheduled for
- nov 19
- feb ??

DOLLAR INDEX STILL IN A DOWNTRENDIn this short video I demonstrate the continued downtrend of the dollar index after a small bounce to about 97.420. On the 4 hours time frame price has exceeded the Bollinger Band and KC band as it very over stretch statistically outside 2 standard deviations. After the bounce up I expect the continuation of the downtrend to the intended target of 96.280.

This is the decisive factor for the overall market. Indices are all at long standing macro tops that have, historically, been the max targets for cycle tops. However, it should be noted that the weekly Stochastic RSI for the DXY is about to cross down on the weekly time frame. This is an almost identical scenario to the DXY break of a multi-cycle support in 2002. The 2002 loss of trend support confirmed in September and the chart we are looking at now is almost a mirror image.
This particular scenario will be extremely confusing, even for seasoned traders, since many are betting on former macro tops to mark the end of the bull market. All indicators are lagging so, until a confirmation below .96, hedging short at local highs isn't out of the question. However, I would urge anyone basing decisions on a bias regarding macro life cycle trends on newer assets to be aware of the possibly break down on the DXY a react accordingly.

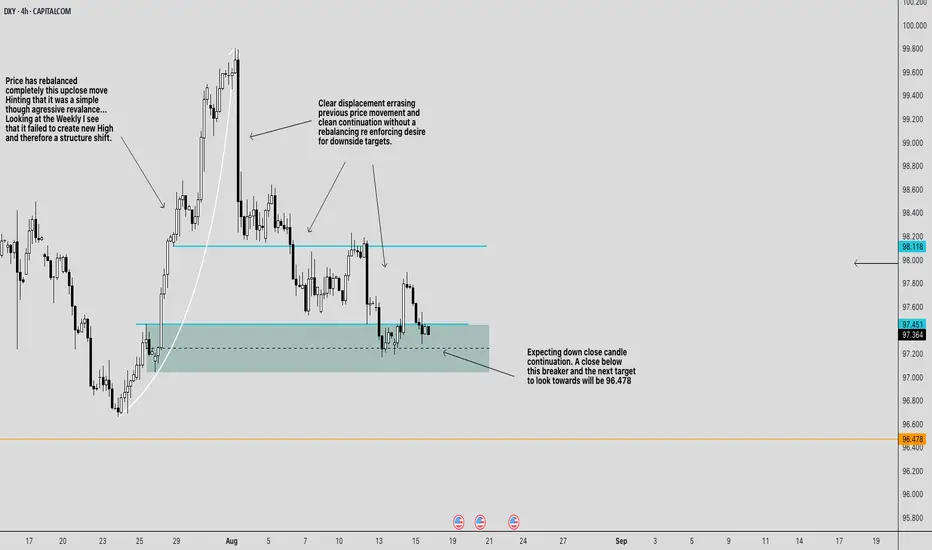
BEARISH CONTINUATION FOR DXYBearish Bias for CAPITALCOM:DXY
Weekly context:
The last up-move failed to print a new weekly high. Failing to create a shift in structure , so rallies are suspect.
4H structure:
We had a hard bearish displacement (large down candles) that erased prior price action and kept going without delivering a “full” rebalance. That usually means the price target remains lower .
The key zones on chart
Breaker / sell zone: \~ 97.45–97.75 (teal box). This is the prior bullish OB that failed (now acting as resistance).
Line in the sand: \~ 97.35–97.40 (dashed line through the teal). A decisive 4H close below here signals continuation.
Upside cap / invalidation area: 98.12 (cyan line) up to \~ 98.20 . Above this, the bearish sentiment weakens.
Primary downside draw: 96.478 (orange line). That’s the next obvious liquidity/inefficiency magnet on your chart.
Trade plan
Idea A — Rejection short from the breaker (preferred):
Entry: look for a rejection setup inside 97.45–97.75 (e.g., 15m/1h bearish shift after a sweep).
Stop: above the breaker and the cyan line ⇒ 98.12 (conservative) or 98.20 (safer).
Targets:
T1: 96.84 (take partials; pay yourself)
T2: 96.47.00
Idea B — Continuation after the break (confirmation play):
Trigger: a 4H close below \~97.35 .
Entry: sell the first clean pullback into 97.35–97.45 .
Stop: above 97.85–98.00 (back inside the breaker); conservative stop 98.12 .
Target: 96.478
Management & invalidation
If price rebalances deeper and closes 4H above 98.12–98.20 , the breaker is failing. Flatten shorts; reassess (potential squeeze toward 98.60–99.00 is then on deck).
If price hesitates at 97.00 , trail above the last 1H swing high to protect realized PnL while aiming for 96.478 .
News risk: Your chart flags upcoming US data (icons). Expect wicks; use hard stops and consider sizing down around releases.
Why this makes sense
* The strong displacement leg sets the draw lower.
* The teal box is a bearish breaker created by a failed bullish structure—ideal for “sell on rally.”
* The market rebalanced the prior up-close leg already; the lack of a symmetrical rebalance on the down-leg favors continuation to the next target ( 96.478 ).
One-liner: Bearish while 4H stays under 98.12 ; sell rallies into 97.45–97.75 or sell a 4H close-and-pullback below 97.35 ; scale out 97.20 → 97.00 → 96.80 → 96.478 ; hard stop above 98.12–98.20 .
*Not financial advice. Size appropriately and stick to your stop.*
PLEASE PUA!
DOLLAR INDEXI would in my personal view expecting price dollar to show-up its short term strength before another fall down, however dollar seem to be trading within a down trend daily channel.
