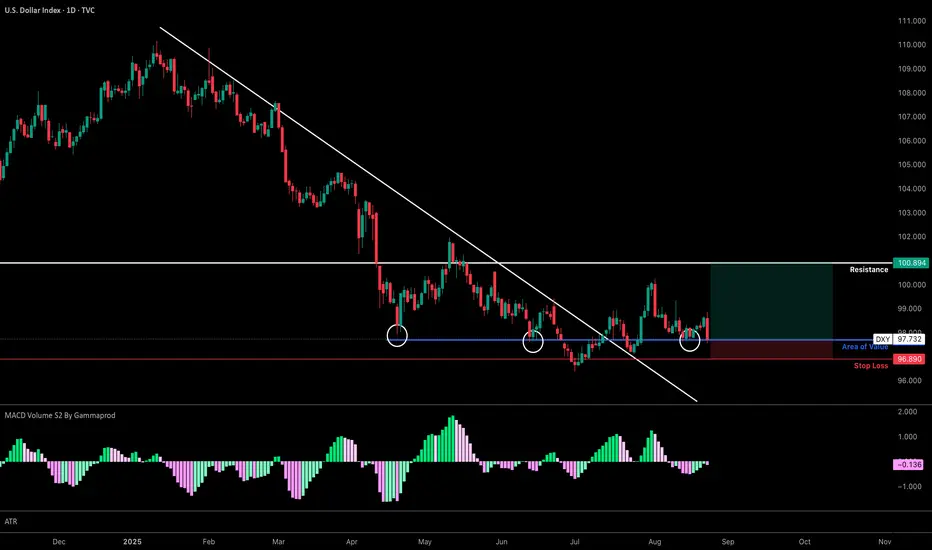
DXY: Key Levels + Change of CharacterBias: Long
Type: Reversal Trade
Trend: Range
Area of Value : Key Levels from downtrend before change of character.
Momentum : 1D MACD Histogram about to cross the High Tide.
Entry: 97.691
Exit: Stop Loss @ 96.890; Take Profit @ 100.894.
Analysis
Fact 1: DXY since 2022 has stayed above the 100.890 support level trending as a range.
Fact 2: DXY has now crossed the key support level @ 100.890 which now acts as a resistance
Fact 3: DXY crossed the trend line signaling a change of character + DXY MACD Histogram is about to cross to High Tide also signaling a change of character.
Conclusion:
Since the key support level @ 100.890 has now been broken, and there is a change of character about to happen. I believe that DXY will at the very least reach the resistance level @ 100.890 before bouncing off to continue the down trend or break to re-enter the range.
Recommendation:
Long Entry on the Area of Value (97.691), for stop loss add 1D ATR for distance (96.890), for take profit let it be the key resistance level (100.894). R:R of 4
USDX trade ideas
DXY buys Dollar is going to push higher going into NFP. DO not fall for the massive push down that happened this friday.

DXY THE DOLLAR index and the US10Y drops on fed chair rhetoric's and the rate cut for September looks 90% possible will be watching the price action for DXY.
#DXY #DOLLAR

Another disaster for the US dollar.Well, we saw today’s news came out against the dollar, and the Dollar Index dropped significantly. Since Trump took office, the dollar hasn’t seen better days and keeps losing its value in the market day by day. We’ll have to see how far this dollar disaster will continue.

DXY LongThe DXY index, positioned at $97.3 within the Fair Value Gap (FVG) zone and aligning with the trend line, shows potential for upward movement.

Dollar will go up!Hello all. as you see it is a Special level for USD index. just look at the buy side of the market. be happy(wink)

Long!Hey all. it is time for DXY to fly. after start of President Trump Speech market will reverse. be happy(wink)

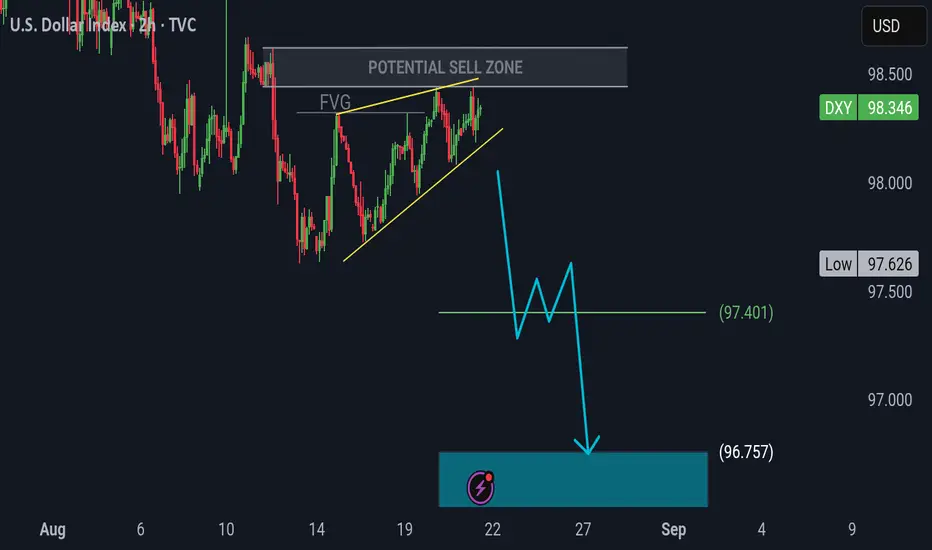
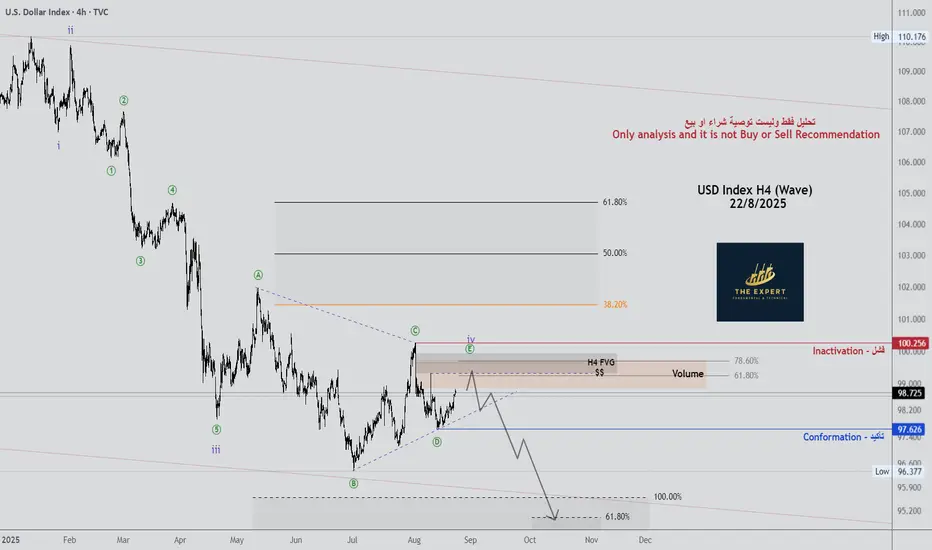
USD Index H4 (Wave) - Update 22/8/2025 (Scenario 2)USD Index H4 (Wave) - Update 22/8/2025 (Scenario 2)
See the chart

DXY ShortAssessing the dollar index's potential drop at the key trendline-butterfly wing intersection.

What Traders Should Expect from Powell’s Jackson Hole Speech?Today, all focus is on Powell’s Jackson Hole speech, where traders will look for hints about the future direction of monetary policy. The Jackson Hole Economic Policy Symposium has often marked major policy framework shifts and signals of immediate policy changes. Today it may be no different, with one key factor in the background: the heavy pressure on the independence of the Federal Reserve.
From the 2008 financial crisis to the Covid-19 shock, US core inflation remained subdued, well below the 2% target, despite ultra-low rates and massive quantitative easing. The average core PCE over this period was 1.52%, with only a few months above 2% in the entire 12-year span. With Covid, that low-inflation era came to an end. Supply chain bottlenecks, changes in consumer behavior, enormous government spending to counter the slowdown, labor market imbalances, energy shocks from the Ukraine–Russia war, and more QE all combined to create the biggest global inflation surge in decades for an average of 3.43% for US. In the US, the divergence was sharper due to much larger fiscal spending under both Trump and Biden. The economy recovered more quickly, but inflation proved stickier. As inflation falling towards 2%, tariff effects then stalled the disinflation process.
After Covid, the Federal Reserve changed its framework and introduced FAIT (Flexible Average Inflation Targeting). Under FAIT, the Fed no longer forced inflation back to 2% quickly but allowed overshooting to compensate for the 2008–2020 period of below-target inflation, giving more weight to fixing labor market problems. However, as seen in the data, the 3.43% average core inflation of the past five years risks unsettling long-term inflation expectations and increasing the chance that higher inflation becomes anchored.
What is Expected in Powell’s Jackson Hole Speech?
Powell has been working on policy framework changes for some time and looking at the last two years of Fed decisions, the central bank has already started to move away from FAIT. Today, Powell is expected to revert from FAIT back to the previous standard of flexible inflation targeting. This would signal greater emphasis on price stability, unless the labor market suffers a sharp downturn. Powell may also announce steps to improve transparency.
Markets might initially see this shift away from FAIT as hawkish, but in reality the Fed has already been moving in that direction for some time, at least in its decisions if not its language. Much of the market impact may already be priced in.
As for short-term policy, the September meeting will be crucial. Just days ago, markets were considering the possibility of a surprise 50-basis-point cut. After hot inflation data and strong PMI readings, even a 25-basis-point cut is priced at only 73%. If not for large payrolls revisions, the chance of a cut would be far lower, but the revisions have changed the outlook. Still, key data is due before September, including PCE, CPI, and the payrolls report. Powell may avoid giving a clear signal today and instead keep the option of a September cut open if conditions warrant.
How Might Markets React to Powell?
Reverting from FAIT is inherently hawkish, but markets may have priced in some of the effect already. Still, it remains broadly dollar-positive. The key will be how seriously Powell addresses weakness in the jobs market. If he does not see labor conditions as deteriorating meaningfully, the Fed has little reason to cut rates while both goods and services inflation are still picking up, even though shelter inflation is easing.
If markets interpret Powell’s view on jobs and the framework change as not hawkish enough, profit-taking among dollar bulls could emerge. However, if Powell signals that recent job weakness is just one or two data points and the Fed remains in a good place, the message would be that no urgent changes are needed and it will be dollar positive.

US Dollar Index (DXY) Rises Ahead of Fed Chair’s SpeechUS Dollar Index (DXY) Rises Ahead of Fed Chair’s Speech
On Monday, we:
→ noted that the US Dollar Index (DXY) was consolidating at the start of a week packed with key events;
→ outlined a descending channel (shown in red);
→ highlighted that the price was trading around the channel’s median line, signalling a balanced market;
→ suggested that a test of one of the quarter lines (QL or QH), which divide the channel into four parts, could take place.
As the DXY chart indicates, since then the balance has shifted in favour of buyers, with the price forming an upward trajectory (shown in purple lines) and breaking through short-term resistance R (which has now turned into support, as marked by the blue arrow). Support line S remains relevant.
Today brings the key event that may have the greatest impact on the US Dollar Index (DXY) this week – Jerome Powell’s speech at the annual Jackson Hole Symposium.
This appearance is particularly significant because:
→ it is likely to be Powell’s last speech after seven years as Fed Chair, with his term expiring in May amid ongoing tensions with President Trump;
→ market participants will closely monitor the tone of his remarks, as a rate cut is expected in September, while recent economic data – namely the rise in the Producer Price Index – suggest that the US economy could face renewed inflationary pressures due to Trump’s tariffs.
Technical analysis of the DXY chart
From a bullish perspective, in the short term the US dollar is advancing within the purple channel, supported by:
→ the lower boundary of this channel;
→ the demand imbalance zone in favour of buyers (shown in green), confirmed by yesterday’s sharp bullish candle.
From a bearish perspective:
→ the RSI has entered overbought territory;
→ bullish momentum may fade after a breakout above the QH line;
→ a key resistance at the 99 level lies nearby – a level that reclaimed its role as resistance at the beginning of August (indicated by black arrows).
A corrective pullback in the US Dollar Index (DXY) could happen after its rally to the highest level since 6 August. However, the further trajectory will largely depend on Powell’s words this evening. According to Forex Factory, the speech is scheduled for 17:00 GMT+3.
This article represents the opinion of the Companies operating under the FXOpen brand only. It is not to be construed as an offer, solicitation, or recommendation with respect to products and services provided by the Companies operating under the FXOpen brand, nor is it to be considered financial advice.

DXY Critical levels for today With Jackson Hole upon us, we're going to get some explosive moves. I have mapped out my thoughts on the 4H chart. Good luck, be careful out there

US DOLLAR INDEX(DXY): Important BreakoutThe 📈Dollar Index has successfully surpassed a key daily resistance level. This level is now likely to function as robust support.
Consequently, a bullish continuation is anticipated.
The subsequent resistance level is projected at 98.97.


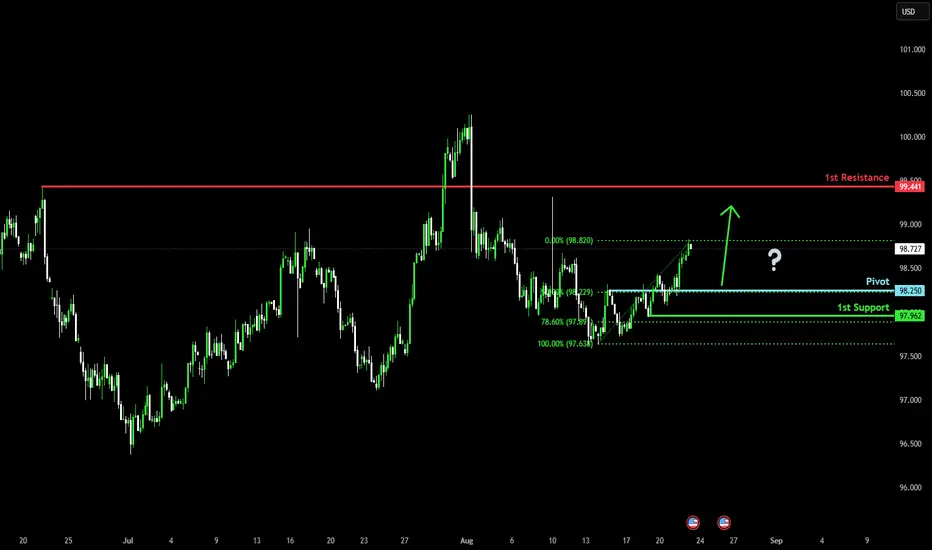
Bullish momentum to extend?US Dollar Index (DXY) is falling towards the pivot which has been identified as a pullback support that lines up with the 50% Fibonacci retracement and could bounce to the 1st resistance.
Pivot: 98.25
1st Support: 97.96
1st Resistance: 99.44
Risk Warning:
Trading Forex and CFDs carries a high level of risk to your capital and you should only trade with money you can afford to lose. Trading Forex and CFDs may not be suitable for all investors, so please ensure that you fully understand the risks involved and seek independent advice if necessary.
Disclaimer:
The above opinions given constitute general market commentary, and do not constitute the opinion or advice of IC Markets or any form of personal or investment advice.
Any opinions, news, research, analyses, prices, other information, or links to third-party sites contained on this website are provided on an "as-is" basis, are intended only to be informative, is not an advice nor a recommendation, nor research, or a record of our trading prices, or an offer of, or solicitation for a transaction in any financial instrument and thus should not be treated as such. The information provided does not involve any specific investment objectives, financial situation and needs of any specific person who may receive it. Please be aware, that past performance is not a reliable indicator of future performance and/or results. Past Performance or Forward-looking scenarios based upon the reasonable beliefs of the third-party provider are not a guarantee of future performance. Actual results may differ materially from those anticipated in forward-looking or past performance statements. IC Markets makes no representation or warranty and assumes no liability as to the accuracy or completeness of the information provided, nor any loss arising from any investment based on a recommendation, forecast or any information supplied by any third-party.
DOLLAR INDEX TO CONTINUE FALLING 8/17/2025As I have been analyzing the trajectory of the dollar index over the last 3 months, I still expect the dollar index to continue falling after a few days of sideways consolidation this coming week. During the consolidation, I will be looking for a retrace up to about the 97.600 level and any open and close candle above the 97.600 level will invalidate this thesis. Target for this week after we gather steam to break the support level (97.200) is at 96.881 - 97.746.
I thank everyone for taking time to visit my video publications and wish the best of trades for you this week. Cheers!!

US Dollar: Is The Bearish Correction Ending?Welcome back to the Weekly Forex Forecast for the week of Aug 18 - 22nd.
In this video, we will analyze the following FX market: USD Dollar
The USD has been weak since the start of August. But this is after a Bullish July! Is the retracement going to find support and all buyers to take over? Price is currently at the levels that could see buyers step in, just above a protected fractal low. If the low holds, we will see prices move higher. If the low fails, we resume the down trend that we've been in since January.
React and do not predict.
Enjoy!
May profits be upon you.
Leave any questions or comments in the comment section.
I appreciate any feedback from my viewers!
Disclaimer:
I do not provide personal investment advice and I am not a qualified licensed investment advisor.
All information found here, including any ideas, opinions, views, predictions, forecasts, commentaries, suggestions, expressed or implied herein, are for informational, entertainment or educational purposes only and should not be construed as personal investment advice. While the information provided is believed to be accurate, it may include errors or inaccuracies.
I will not and cannot be held liable for any actions you take as a result of anything you read here.
Conduct your own due diligence, or consult a licensed financial advisor or broker before making any and all investment decisions. Any investments, trades, speculations, or decisions made on the basis of any information found on this channel, expressed or implied herein, are committed at your own risk, financial or otherwise.

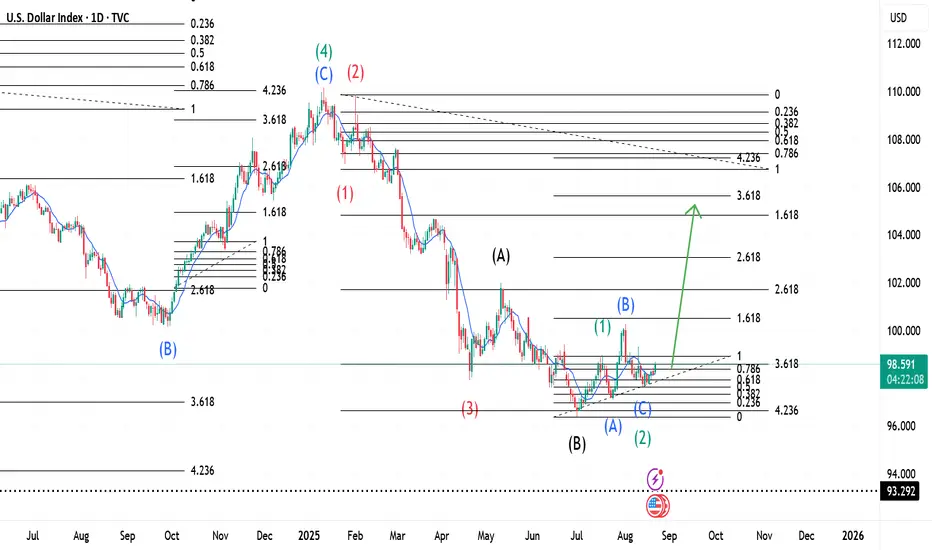
$US and The Elliott Wave(Real Time Updates)This is an update of a previous publication(link below). In that publication, where Wave 1(Green) ended, there was speculation whether the correction that followed was a Zigzag or the first wave of a Flat, as you can see on the chart below. This Wave turned out to be the first wave of a Flat and this is just an update. We should expect a continuation to the upside for our Wave 3(Green), then a Zigzag for Wave 4(Green). Note that the green arrow does not represent where price will reach then retrace but is an indication of market direction. For more information on the same, go to:
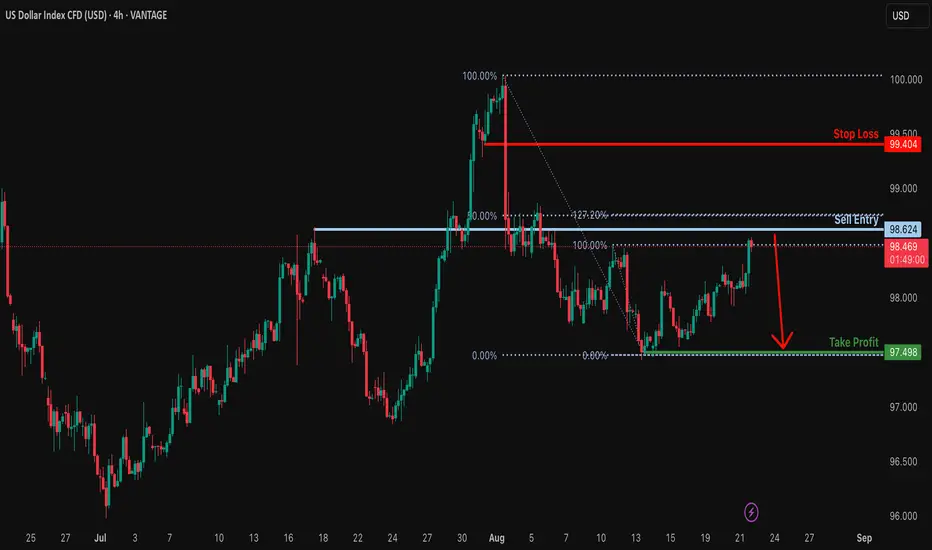
Potential bearish reversal?USDX is rising towards the resistance level which is an overlap resistance that is slghtly below the 50% Fibonacci retracement and the 127.2% Fibonacci extension and could revrse from this level to our take profit.
Entry: 98.62
Why we like it:
There is an overlap resistance level that is slightly below the 50% Fibonacci retracement and the 127.2% Fibonacci extension.
Stop loss: 99.40
Why we like it:
There is a pullback resistance level.
Take profit: 97.49
Why we like it:
There is a swing low support.
Enjoying your TradingView experience? Review us!
Please be advised that the information presented on TradingView is provided to Vantage (‘Vantage Global Limited’, ‘we’) by a third-party provider (‘Everest Fortune Group’). Please be reminded that you are solely responsible for the trading decisions on your account. There is a very high degree of risk involved in trading. Any information and/or content is intended entirely for research, educational and informational purposes only and does not constitute investment or consultation advice or investment strategy. The information is not tailored to the investment needs of any specific person and therefore does not involve a consideration of any of the investment objectives, financial situation or needs of any viewer that may receive it. Kindly also note that past performance is not a reliable indicator of future results. Actual results may differ materially from those anticipated in forward-looking or past performance statements. We assume no liability as to the accuracy or completeness of any of the information and/or content provided herein and the Company cannot be held responsible for any omission, mistake nor for any loss or damage including without limitation to any loss of profit which may arise from reliance on any information supplied by Everest Fortune Group.
DXY: Strong Bearish Sentiment! Short!
My dear friends,
Today we will analyse DXY together☺️
The in-trend continuation seems likely as the current long-term trend appears to be strong, and price is holding below a key level of 98.147 So a bearish continuation seems plausible, targeting the next low. We should enter on confirmation, and place a stop-loss beyond the recent swing level.
❤️Sending you lots of Love and Hugs❤️
DXY Dollar Heist: Can You Escape @100?🔥 DXY Dollar Index Bank Heist Plan (Swing Trade) 🔥
Asset: DXY Dollar Index 💵Plan: Bullish 📈Thief Trading Style: Layered Limit Order Strategy 🕵️♂️
🏦 The Heist Plan 🏦
Dear Thief OG's, Ladies & Gentlemen, get ready to pull off the ultimate DXY heist! 💰 We're using the Thief Layering Strategy to stack multiple limit orders and maximize our loot. Follow the plan, adjust to your risk, and let’s escape with the cash! 🚨
📈 Entry: The Break-In
Strategy: Deploy multiple buy limit orders to layer your entries like a master thief 🕴️. Suggested levels:
98.00 💸
98.20 💸
98.40 💸
98.60 💸
Flexibility: Add more layers based on your risk appetite or market conditions 📊.
Pro Tip: Set an alert on TradingView to catch the breakout or pullback at these levels 🚨.
🛑 Stop Loss: The Escape Route
Thief SL: Set at 97.50 to protect your stash 🛡️.
Risk Management: Adjust SL based on your lot size, risk tolerance, and number of layered entries ⚖️.
Warning: Don’t get caught! This is a high-stakes heist—stick to your risk plan 🔥.
🎯 Target: The Getaway
Police Barricade: Resistance at 100.30 🚓—watch out!
Our Target: Take profits at 100.00 to escape with the loot before the market traps you 🏃♂️💨.
🧠 Why This Heist?
The DXY is showing bullish momentum based on real-time market data 📡:
Macro Factors: Strong USD demand driven by economic indicators (check COT reports, geopolitics, and intermarket analysis) 🌍.
Technical Setup: Layered entries align with swing trade pullbacks and key support zones 📉.
Scalpers 👀: Stick to quick long-side trades with trailing SL to lock in profits 💰.
⚠️ Trading Alerts: Stay Sharp!
News Releases: Avoid new trades during high-impact news to dodge volatility traps 🚫.
Position Management: Use trailing stop-loss to secure your profits and stay safe 🛡️.
💪 Boost the Heist!
Hit the Boost Button to power up our Thief Trading Style! 🚀 Every like and view strengthens our crew, helping us rob the market with precision. Let’s make money and vanish like pros! 🤑
Stay tuned for the next heist plan, Thief OG’s! 🕵️♂️🎉