Volume Momentum Analysis my idea on the Daily and 4H Timeframes
On the daily timeframe (left), we observe a breakout above a previous high-volume candle. From a classical technical analysis or price action perspective, this could be seen as a false breakout. However, in volume analysis, this is interpreted as a liquidity

IDUSDT UPDATEIDUSDT is a cryptocurrency trading at $0.3183. Its target price is $0.5000, indicating a potential 50%+ gain. The pattern is a Bullish Falling Wedge, a reversal pattern signaling a trend change. This pattern suggests the downward trend may be ending. A breakout from the wedge could lead to a strong
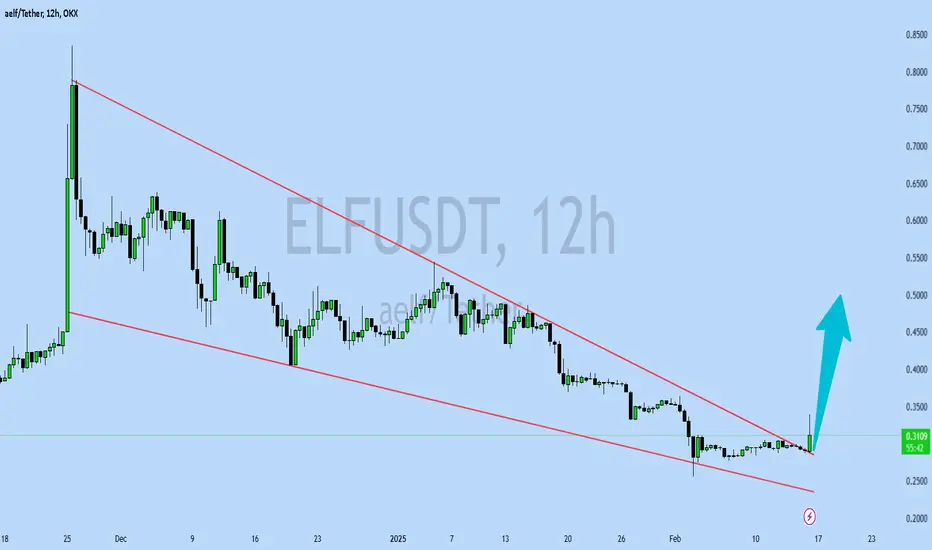
ELFUSDT UPDATEELFUSDT is a cryptocurrency trading at $0.3090. Its target price is $0.5000, indicating a potential 60%+ gain. The pattern is a Bullish Falling Wedge, a reversal pattern signaling a trend change. This pattern suggests the downward trend may be ending. A breakout from the wedge could lead to a strong

AELFaelf, an AI-enhanced Layer 1 blockchain network, leverages the robust C# programming language for efficiency and scalability across its sophisticated multi-layered architecture. Founded in 2017 with its global hub in Singapore, aelf is a pioneer in the industry, leading Asia in evolving blockchain w

Prepare to BUY Spot ELFUSDT on H4 CyclePrepare to BUY Spot ELFUSDT on H4 Cycle
🌟 Short-Term Opportunity with ELFUSDT! 🌟
🌍 Market Overview:
ELFUSDT is showing strong potential for gains on the H4 timeframe, making it an excellent short-term setup.
📊 Trade Plan:
📌 Entry Point: $0.48 - $0.52 – Accumulate within this range for optimal posit

ELF /USDT Analysis#ELF /USDT Analysis
NYSE:ELF The price is rebounding from the strong support zone at $0.4603 after a healthy correction, showing readiness for an upward movement. The technical pattern indicates a continuation of the bullish trend, with a target of $0.9674, representing a 100% potential gain. The

ELFUSDT | Massive Upside PotentialVolume Profile Insights: A significant volume surge is evident in the volume profile charts, indicating strong buyer activity.
Strategic Moves:
Early Entry: Securing a ticket on this bullish train early could be a game-changer.
Blue Box Zones: These are your key areas to watch for potential buy-i

#ELF #USDT Long Set UpLooks like a short term reversal. I will long it on break of 0.5891
Entry 0.5891
Stoploss 0.5522
Tp-1 0.6277
Tp-2 0.6686

ELFUSDT (aelf) Updated till 25-11-24ELFUSDT (aelf) Daily timeframe range. we can see another smooth push from its local low. its trying to get a close over 0.7260, a confirmed close can run it to 0.9938 or above. of course if volume stays. recent support at 0.4960.

ELFUSDTWe can attempt to buy ELFUSDT from specified level if it break LH , also bullish divergence occur indicate that it moves upward.
SL , TP mention in chart.

See all ideas
Summarizing what the indicators are suggesting.
Oscillators
Neutral
SellBuy
Strong sellStrong buy
Strong sellSellNeutralBuyStrong buy
Oscillators
Neutral
SellBuy
Strong sellStrong buy
Strong sellSellNeutralBuyStrong buy
Summary
Neutral
SellBuy
Strong sellStrong buy
Strong sellSellNeutralBuyStrong buy
Summary
Neutral
SellBuy
Strong sellStrong buy
Strong sellSellNeutralBuyStrong buy
Summary
Neutral
SellBuy
Strong sellStrong buy
Strong sellSellNeutralBuyStrong buy
Moving Averages
Neutral
SellBuy
Strong sellStrong buy
Strong sellSellNeutralBuyStrong buy
Moving Averages
Neutral
SellBuy
Strong sellStrong buy
Strong sellSellNeutralBuyStrong buy
Displays a symbol's price movements over previous years to identify recurring trends.