$ENSO/USDT Chart Analysis (1H Timeframe)BINANCE:ENSOUSDT is currently showing a bearish continuation setup as price retraces into a strong bearish breaker block between $1.263 – $1.270, a key supply zone where sellers previously gained control and pushed price downward.
After a clear downtrend and strong selling pressure, price is now a
Related pairs

ENSO TECHNICALS LOOKING BULLISH🔥 Fortune AI Radar — CRYPTOCAP:ENSO
Fresh activity detected on CRYPTOCAP:ENSO today.
Data suggests increasing market interest & buyers stepping in.
Technicals currently lean bullish, with momentum trending upward.
Whales showing hints of accumulation and hype rising among trader

$ENSOUSDT (1H) Price Analysis– Bullish Reversal from Demand ZoneBINANCE:ENSOUSDT Price Analysis – Bullish Reversal from Demand Zone (1H Timeframe)
ENSO/USDT is currently forming a bullish reversal setup on the 1-hour timeframe after price retraced into a well-defined demand zone between $1.202 and $1.178. This zone has previously acted as strong support, indic

ENSOUSDT.P: long setup from daily resistance at 1.6399BINANCE:ENSOUSDT.P is in a bullish trend. After a strong rally, it consolidated for a few days. Now, a solid pre-breakout base is forming right under the 1.6399 resistance, which acts as the upper boundary of the trading channel.
I have mixed feelings about the Daily timeframe because the asset h

ENSOUSDT: short setup from daily support at 1.2632BINANCE:ENSOUSDT.P is correcting as expected following the pump.
The initial decline halted at the 1.2632 level. The following day, we witnessed a False Breakout relative to this price, which confirms the level's validity (as a False Breakout can only occur relative to a significant level). Essen

ENSO SHORTOn the daily timeframe for ENSO/USDT, the Volume Profile reveals a prominent High Volume Node (HVN) around the 1,70$ – 2,10$ area — a zone where significant trading activity occurred and the market previously
This setup often signals distribution and potential rejection, creating a compelling short

Explosive Rally Incoming… AgainOne of the most speculative and volatile assets I’ve encountered yet. The entire structure is messy and corrective, but the last low has still held so far and I count the past few days of consolidation as an ending diagonal in Elliot subwave b of larger B. If it plays out, I’m looking for one more l
ENSOUSDT Forming Falling WedgeENSOUSDT is forming a clear falling wedge pattern, a classic bullish reversal signal that often indicates an upcoming breakout. The price has been consolidating within a narrowing range after the extended pullback, suggesting that selling pressure is noticeably weakening while buyers are steadily st

ENSO Buy/Long Setup (4H)Given that the price has formed a bullish CH, is sitting on a key level, and the order blocks above the chart have been exhausted, we can look to enter buy/long positions on a pullback into the support zones.
You should enter using DCA at the two specified entry points.
The targets are marked on t

ENSO has found the bottom and is ready for growthIn addition to NTRN, I've hired ENSO today. It differs from NTRN by a significantly lower percentage of tokens in circulation, which will put pressure on the price and the dynamics will probably be smoother. Until October next year, emissions will be slow, exerting little pressure. In the future, I

See all ideas
Summarizing what the indicators are suggesting.
Oscillators
Neutral
SellBuy
Strong sellStrong buy
Strong sellSellNeutralBuyStrong buy
Oscillators
Neutral
SellBuy
Strong sellStrong buy
Strong sellSellNeutralBuyStrong buy
Summary
Neutral
SellBuy
Strong sellStrong buy
Strong sellSellNeutralBuyStrong buy
Summary
Neutral
SellBuy
Strong sellStrong buy
Strong sellSellNeutralBuyStrong buy
Summary
Neutral
SellBuy
Strong sellStrong buy
Strong sellSellNeutralBuyStrong buy
Moving Averages
Neutral
SellBuy
Strong sellStrong buy
Strong sellSellNeutralBuyStrong buy
Moving Averages
Neutral
SellBuy
Strong sellStrong buy
Strong sellSellNeutralBuyStrong buy
Displays a symbol's price movements over previous years to identify recurring trends.
Frequently Asked Questions
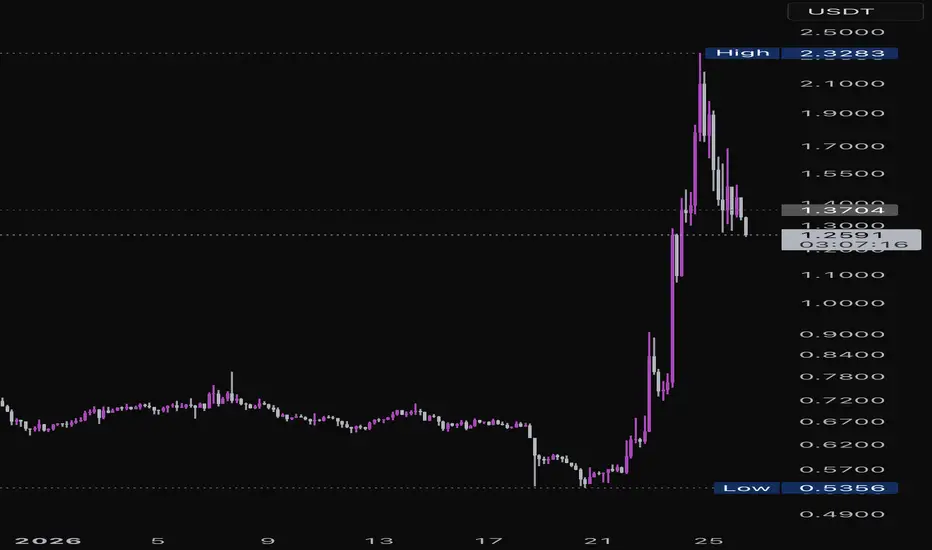
The current price of ENSO / TetherUS (ENSO) is 1.128 USDT — it has risen 0.46% in the past 24 hours. Try placing this info into the context by checking out what coins are also gaining and losing at the moment and seeing ENSO price chart.
ENSO / TetherUS price has fallen by −19.49% over the last week, its month performance shows a 60.30% increase, and as for the last year, ENSO / TetherUS has decreased by −62.40%. See more dynamics on ENSO price chart.
Keep track of coins' changes with our Crypto Coins Heatmap.
Keep track of coins' changes with our Crypto Coins Heatmap.
ENSO / TetherUS (ENSO) reached its highest price on Oct 14, 2025 — it amounted to 4.150 USDT. Find more insights on the ENSO price chart.
See the list of crypto gainers and choose what best fits your strategy.
See the list of crypto gainers and choose what best fits your strategy.
ENSO / TetherUS (ENSO) reached the lowest price of 0.536 USDT on Jan 20, 2026. View more ENSO / TetherUS dynamics on the price chart.
See the list of crypto losers to find unexpected opportunities.
See the list of crypto losers to find unexpected opportunities.
The safest choice when buying ENSO is to go to a well-known crypto exchange. Some of the popular names are Binance, Coinbase, Kraken. But you'll have to find a reliable broker and create an account first. You can trade ENSO right from TradingView charts — just choose a broker and connect to your account.
ENSO / TetherUS (ENSO) is just as reliable as any other crypto asset — this corner of the world market is highly volatile. Today, for instance, ENSO / TetherUS is estimated as 4.39% volatile. The only thing it means is that you must prepare and examine all available information before making a decision. And if you're not sure about ENSO / TetherUS, you can find more inspiration in our curated watchlists.
You can discuss ENSO / TetherUS (ENSO) with other users in our public chats, Minds or in the comments to Ideas.