ethbtci think this HH is FO and the trend is downward. also we can see price broke the support. so i think its a fake out above the support.
Trade ideas

ETHBTCAfter Making Rising Wedge
We see a Drop Down in Price Action.
After following a Bearish Trend
We also see a Divergence Forming Using The RSI Indicator.
The previous L.H. is Broken, So We are assuming a Pump in Price Action.

Ethereum to $62.30 - Time to scare the Ethereum kids!
When a macro super symmetrical triangle trend occurs on the log scale, any people holding this Ethereum hopes the trend moves up and not down, a move down will mean the end of Ethereum.
Really failing to rise above near the upper line too.
reducing the supply should do it right?, right? :)

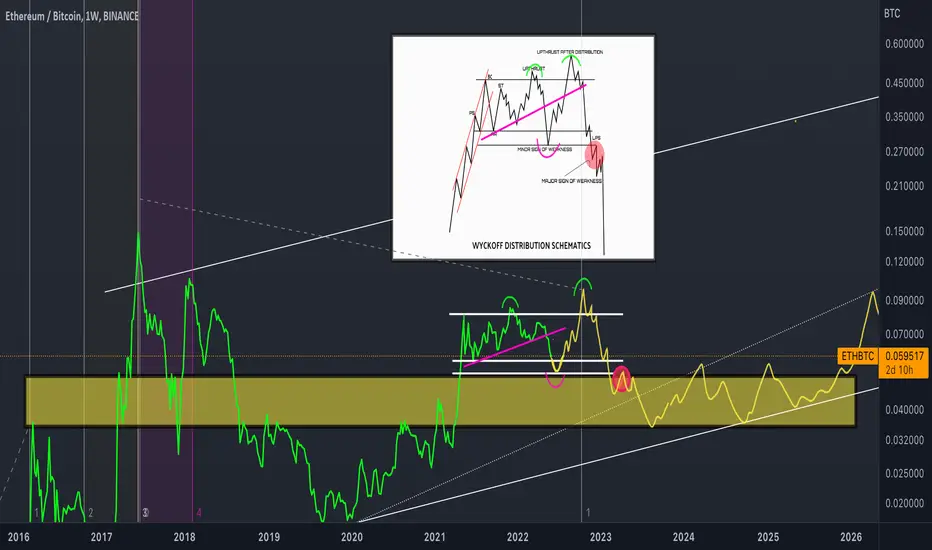
[UPDATE ETH/BTC] What if?Many think we are going straight down but what if we see this kind of fake down fake up distribution before?
30min chart about to head back upSee chart for details, I typically post HTF charts, this is a 30 min chart.

#Bitcoin Bulls Press On, Will ETH Gains Be Reversed?Past Performance of ETHBTC
BTC is ahead of ETH, looking at the arrangement in the daily chart. The recovery is albeit a solid performance of ETH in the past few days. Overall, from a top-down preview, Ethereum buyers remain in charge. This is further supported by the fact that the BTC lead has been at the back of decreasing volumes in the past few trading days. The longer-time view pattern favors ETH bulls from a volume analysis perspective.
#ETHBTC Technical Analysis
The April 26 bar ended lower and volatile. There were attempts to stem losses leading to a long lower wick suggesting the presence of ETH bulls. This, coupled with the fact that ETHBTC prices are still bound inside the recent bullish trade range, favors the upside. Still, it is until there is a buildup, ideally above 0.067 BTC with increasing volumes. For now, how prices react at 0.065 BTC would shape the immediate term with the awareness that losses may strengthen BTC, forcing prices towards 0.062 BTC.
What to Expect from #ETHBTC?
BTC bulls are pressing on, and there are a series of lower lows at the back of decreasing volumes. Even so, how prices react at 0.065 BTC today might determine the near-term formation. Conversely, there must be a conclusive close above 0.067 BTC for ETH bulls to resume the uptrend, aligning with the upswing from mid-April 2023.
Resistance level to watch out for: 0.067 BTC
Support level to watch out for: 0.065 BTC
Disclaimer: Opinions expressed are not investment advice. Do your research.

I Strongly Suggest To Don’t Short The Market Here📍 ETH / BTC Pair Is a Alt Market Temperature And If This Pair Is Bullish Means Altcoins Will Move
✅ Current Structure Is Complex Correction Which Means Huge Breakout Will Happen Soon And We Will Have Alts Rally Soon ,0.08 And 0.1 Are Next Station

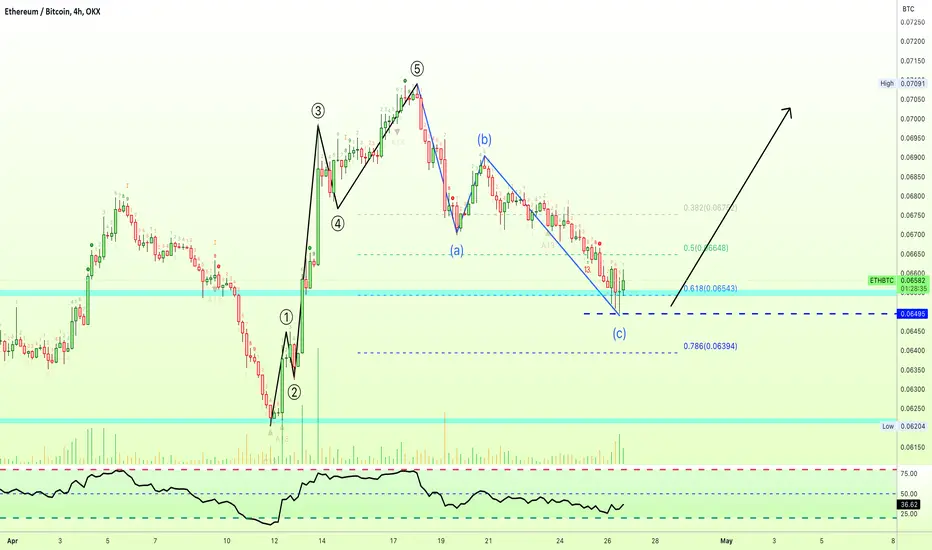
✳️ Ethereum vs Bitcoin & Elliot Wave Theory | #OKXIdeasHere we have a chart for ETHBTC with a perfect Elliot Wave sequence... Let's dive into it!
- First, we have a 5-Up Wave pattern, it starts 11-Apr. and peaks 18-Apr.
- Second, we have a perfect Zig-zag or ABC correction.
(Notice that this correction ends right at the 0.618 Fib. retracement level with a Doji, EW is big on Fib. proportions. This is also supported by increasing volume and a bottomed out RSI).
We have the perfect 5-Up and then the ABC... What follows, is a new impulse based on EW.
This setup is invalidated on a close below the 26-Apr. low.
This is not financial advice.
Thank you for reading and for your continued support.
Namaste.
Ethereum Hasn't Reached 1.5x Target of its HSiThe eth/btc pair confirmed an inverted HS a while back, and hasn't yet reached its TP2 (or a 1.5x measured move from the neckline).
It hit TP 1 and has since consolidated between TP 1 and the 0.5x halfway mark. It may get a chance to test that area again, potentially even falling into the Accumulation Zone shown on the chart, which might be a good spot to increase position. It also may not.
Look for an eventual move to TP 2.
Alternatively, I think there's a chance it could fall as low as ~0.025, making a move symmetrical to the one on the far left of the chart before finally firing back up towards 0.1 and higher.
See links to related ideas below, including the alternate move back down near 0.025.

ETH-BTC - LONG SETUPIf you want to swap your btc into eth, just wait for a confirmation ( breakout of the trend )
You have in the chart wehere to enter with long , buy or swap.

ETHBTC may be putting in a major fakeoutAs usual, what follows isn't financial advice but a mere observation.
This idea is to be considered as a follow-up of the one that can be found linked below.
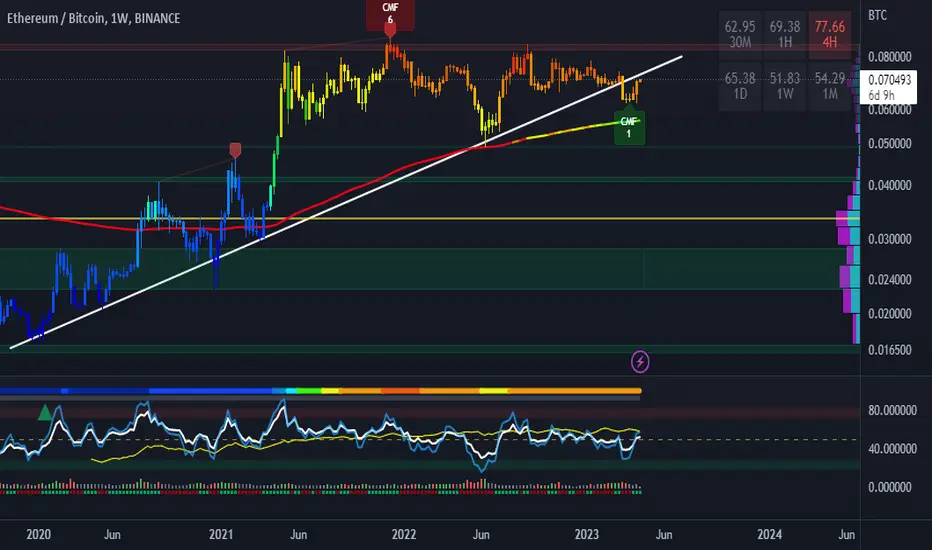
As explained in my last study, we're witnessing extremely low levels of volatility on the weekly timeframe for ETHBTC.
While price action wasn't exactly confidence-inducing until a couple days ago, tides might be beginning to change.
We can observe how since july 2020, the 21EMA (yellow) and the 55EMA (green) have never had the chance to bearishly cross.
This brings me to a very simple point, if we can see a weekly ETHBTC close above both EMAs, essentially producing a fakeout, the idea that the expansion phase coming from this extremely low volatility environment will be to the upside will begin to appear more probable.
The horizontal ray that's marking the march 2023 high (0.073544) is the obvious line in the sand for me, a weekly close above that level will make me consider that ETHBTC is putting in a major - possibly even macro - low.
Keep in mind that as long as the price keeps being held down by both the 21EMA and the 55EMA this is just a possible scenario waiting to unfold, but still unconfirmed.
Furthermore, a weekly close below this current week low (0.062037) will very likely result in a much more severe downside continuation, with targets already discussed in the idea linked below.
Whatever happens, stay safe and wait for confirmation.

Ethereum domain mapThis is my view of the Dominance of Ethereum and the largest dominance of alternative currencies.. We are heading in the medium term to the strong resistance area specified above, and then the decline will be absorbed to make a larger rise and test the historical top, but we will talk about it when the time comes

ETHAccording to news on April 20, the snapshot voting page shows that the ApeCoin community’s AIP-230 proposal of “donating HKEX:1 million to the Ethereum community” has been voted by ETlob. Donated 300,000 US dollars, sponsored 700,000 US dollars to 11 ApeCoin hackathons and at least 5 public welfare activities, as early as responding to V God’s call for Ape public welfare products in 2022.
The final support rate of the proposal vote was 46.21%, the opposition rate was 29.96%, and the abstention rate was 23.84%. In the ApeCoin voting mechanism, abstention does not affect performance results.

ETH Idea: The price retests the trend line. A break of the trend line will be a strong bullish signal. A bounce down from the trend line could signal the end of the altseason
ethbtc : Is ALTCoin party coming ?Is the Altcoin Party Coming?
If the downward trend line is broken and the price grows up to the first green line and stabilizes, you can count on the start of the altcoin party.
Targets and stops are marked with green and red lines.
Good luck and profitable

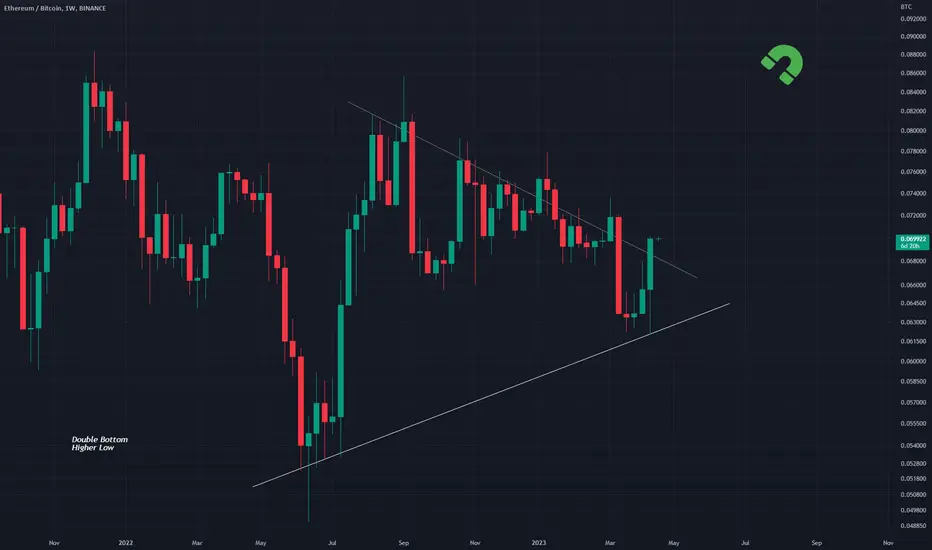
ETHBTC Breakout Pattern A breakout pattern on the Weekly timeframe for ETHBTC
The higher low is present, which a pattern evident of support and breakout
The down dotted line is already starting to break with the most recent Weekly candle