ETHUSD – Demand Zone Reaction | Bullish Reversal Expected BITSTAMP:ETHUSD
Market Overview
ETHUSD has been consolidating under a descending trendline while repeatedly respecting the key demand zone.
This area has historically absorbed heavy selling pressure, indicating institutional buy orders building up.
If price breaks above minor internal resistance (around 4,050), the breakout could confirm a new bullish leg targeting upper liquidity zones.
Key Scenarios
✅ Bullish Case 🚀 → 🎯 Target 1 4,080 | 🎯 Target 2 4,150 | 🎯 Target 3 4,210
❌ Bearish Case 📉 → Close below 3,920 could extend decline toward 3,860
Current Levels to Watch
Resistance 🔴 4,080 – 4,150
Support 🟢 3,940 – 3,920
⚠️ Disclaimer: This analysis is for educational purposes only. Not financial advice.
Trade ideas

Ethereum still poised to push to 5400Ethereum has maintained solid bullish structure on the 4h chart, is respecting AVWAP from the most recent Change of Character, and is starting to push back above the 0.618 retracement. As long as AVWAP and the fibonacci structure hold, a push to 5400 seems likely.

My EXACT ETH Entry Breakdown LIVEMy Go-To ICT Setup For Long Trades (ETH Example)
In this video, I break down my exact ETH long entry, showing the full thought process behind it using ICT concepts. This isn’t just theory — this is the same setup I use every time the market gives the right structure.
I cover:
The key ICT concepts behind my entry (FVG, OB, OTE, liquidity sweep)
Step-by-step breakdown of how I entered and managed risk
Why this is my go-to setup for high-probability long trades
Real chart analysis + trade psychology
If you’ve been trying to understand how to actually apply ICT in crypto, this video will give you a clear example from start to finish.
#ICT #CryptoTrading #Ethereum #ETH #TradingStrategy #CryptoEducation #Bitcoin #Altcoins

Ethereum's pullback is not yet over.From a technical standpoint, Ethereum’s previous strong upward structure has been notably disrupted amid this pullback. The 1-hour K-line chart shows that after failing to break through the 4,788 high, ETH closed multiple consecutive long-bodied bearish candles. Its price has sequentially breached the MA5, MA20, and MA60 moving averages, marking a reversal in the short-term trend.
After the MACD indicator formed a "death cross" at a high level, the fast line has crossed below the zero line and entered the bearish zone. The green bearish momentum bars continue to expand, indicating that the short-term adjustment is not yet complete.
Today, Ethereum’s price is struggling to hold above the medium-term moving average. A break below this level could trigger a deeper decline.
Ethereum.. Time for new highs?Price is Fractal - Revisiting this year's price action
In December of 2024, Ethereum tapped the 4100 level before dumping down to the $1400 level at the bottom of the altcoin bear market.
In doing so, it left behind equal highs at 4100. Prior to the move lower, it also had left behind equal lows at the $2050 mark - this can be spotted on the weekly timeframe. Leaving behind these equal highs/lows are classic signs of engineering liquidity - price tends to revisit it later.
What followed was a sweep of the 2050 equal lows and also the $1500 lows from August 2023. Once price reclaimed the 2050 level, I called for a rally back to 4100 highs to sweep. This is how price often reacts anyway.
Present
The current local range for ETH between $3400 and $4800 presents a similar opportunity. There are equal highs and equal lows as shown in the chart with the monthly level of $4100 smack in the middle. I personally don't want any HTF (>1D) below this 4100 level as it would signal significant weakness. But I do see a potential intraweek wick down to the sweep the $3400 equal lows. Keep in mind I don't see this as a certainty. But if Bitcoin continues to show weakness in the face of US-China trade tensions, then everything is on the table and one must think about the different scenarios.
As such, I'm looking at the possibility of a wick down to sweep those levels and ideally we get a swift recovery back above this level and back above the $4100 as confirmation. This would cement the outlook that a sweep of $4800 is next and onto new highs, which would likely be above $5000.
The Bearish Case
Ethereum is also in a larger HTF monthly range from all the way back in 2021. The monthly chart shows price ranging from $1500 to $4500. Given that we are range highs and are currently breaking back into the range, one must consider the possibility of the range continuing. If this were the case and $4100 were lost and $3400 does not provide a swift recovery, then a move back down to $2800 (mid-range) and lower would have to be considered.
Either way, this isn't the time for me to gamble and take in a leveraged position. I'd much rather see a sweep and a reversal for a confirmation for a swing long hold.
Let's see how it plays out.

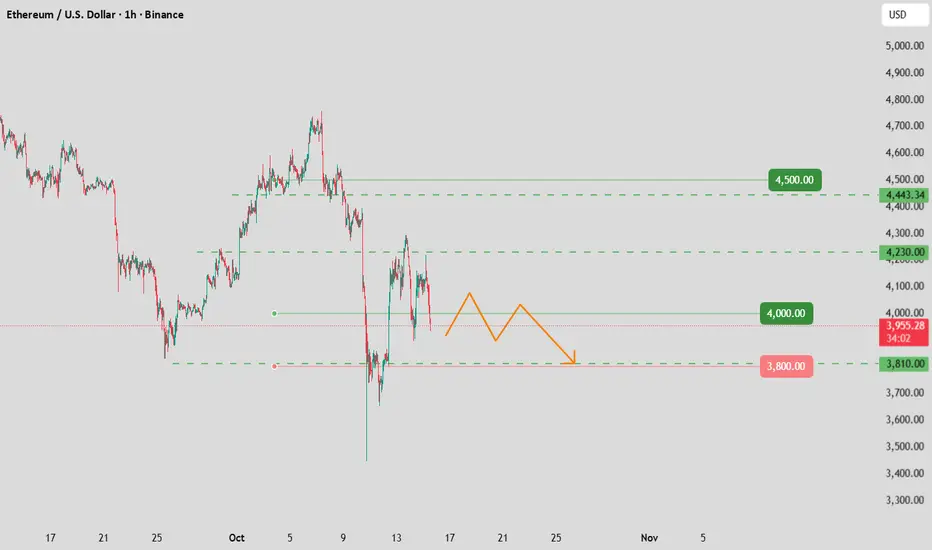
Recovery after the crash - ETH weekly update Oct 15 - 21stAfter the market crash on friday, Ethereum seems to recover and builds structure that suggests a possible impulsive rise soon. My primary scenario shortterm therefore would be that we drop a bit more to $3800 and build a impulsive rejection there. At this point, I want the price to turn around, rise impulsively and build massive momentum as typical for a wave 3. From the view of the elliott waves, this would be my favorable scenario. On the other hand, there is the possibility that we may turn around right here and form our wave 3 from here. This would also fit into the market structure, as funding rates turn negative and in the past such an action indicates rejection. Otherwise, the third but bearish scenario would mean that this wave 4 in the cycle isn't done yet, so we could potentially drop further to $3200. This scenario has the lowest probability, because of the current market structure and the clear price action of Ethereum. Overall the Liquidity above us has a significant magnet-effect on the current price to move up and fill orders. I hope I could help you out with that, bye.

More downside to ETH? Reasons for a bearish outlook in the midterm:
-ETH didn't manage to break ressistance at 4750 forming a double top with previous ATH of Nov 25
-Broke the trend that started March this year and currently is retesting it.
-Price is now in top of an ascending channel, a visit to the the low of the channel at 1600 is possible is fundamentals help it.
Retest of the trendline:
$ETHUSDBITSTAMP:ETHUSD may have more downside if this Gartley is going to play out. $3725 area. I'm long. If it drops to $3725 range, I plan to add to my position. For now, I'm holding.

ETH PERPETUAL TRADE SELL SETUP Short from $4090ETH PERPETUAL TRADE
SELL SETUP
Short from $4090
Currently $4090
Targeting $4015 or Down
Stoploss $4400
(Trading plan IF ETH
go up to $4190 will add more shorts)
Follow the notes for updates
In the event of an early exit,
this analysis will be updated.
Its not a Financial advice

ETH - Time to buy again!I might be wrong and this might never happen, but it might come true From a technical perspective!!!
#ETH/USDT
#ETH
The price is moving within a descending channel on the 1-hour frame, adhering well to it, and is heading for a strong breakout and retest.
We have a bearish trend on the RSI indicator that is about to be broken and retested, which supports the upward move.
There is a major support area in green at 3900, which represents a strong support point.
We are heading for consolidation above the 100 moving average.
Entry price: 4156
First target: 4274
Second target: 4405
Third target: 4583
Don't forget a simple matter: capital management.

#ETH/USDT the Final Push Before the Parabolic Run!#ETH
The price is moving within a descending channel on the 1-hour frame, adhering well to it, and is heading for a strong breakout and retest.
We have a bearish trend on the RSI indicator that is about to be broken and retested, which supports the upward move.
There is a major support area in green at 3900, which represents a strong support point.
We are heading for consolidation above the 100 moving average.
Entry price: 4156
First target: 4274
Second target: 4405
Third target: 4583
Don't forget a simple matter: capital management.
When you reach the first target, save some money and then change your stop-loss order to an entry order.
For inquiries, please leave a comment.
Thank you.

ETH: LONG + Risk AnalysesTime Wise
Short term looking at ~15-27 october for indecisiveness. With a very Green November.
But the Orange Horizontal Line providing long term resitence.
The White Horizontal is the Flash Crash Low.
Both should hold on a monthly closing basis. Even a Weekly close is worrisome.
indecisiveness should be gone after said dates, or when making new ATH or monthly close under resitence levels.
Upside we should go for thowards the 6K minimum .. 5.5K is a Safe Bet.
My Current targets for UP:
5.800
8.000
8.500
9.500

ETH: Technical Precision Amid the CrashIn spite of the crypto market crash, Ethereum actually moved very technically.
The break below the $4,300 support led to a drop toward the important $3,500 zone.
Although the price also broke below $3,850, a quick reversal followed — the rebound brought the price back above the $3,850 support and up to the $4,300 resistance.
A new wave of selling came next, but this time, the price stopped around the $3,850 support zone, confirming it as an important level.
A quick rebound followed, and now ETH is back above $4,000, trading around $4,100.
Also very important — the price of ETH is forming an ascending triangle, with resistance at $4,300.
A break above $4,300 will most likely accelerate gains toward the $4,900–$5,000 area, which is both a technical resistance and the target of the triangle.
I’m looking to buy on dips, preferably below $4,000, and considering the mentioned target, such a setup offers around a 1:3 or even 1:4 risk-reward ratio.
ETH/USD — Bearish Channel Formation Signals Possible Deeper CorrETH/USD is correcting lower within a forming descending channel, moving against the long-term bullish trend. Last week, the pair touched the upper boundary near 4687.50 (Murray ), then pulled back toward the lower edge, and is now trading near the midline of the Bollinger Bands, pointing to a potential continuation toward 3540.00 (38.2% Fibonacci) and 3125.00 (Murray , 50.0% Fib).
A breakout above 4687.50 remains the key bullish trigger that could push ETH toward 5000.00 (Murray ) and 5625.00 (Murray ).
⸻
Technical Outlook
• Bollinger Bands: turning downward, confirming renewed bearish pressure.
• MACD: expanding positive histogram but losing momentum.
• Stochastic: rising but nearing overbought zone — possible exhaustion ahead.
• On the weekly chart, ETH is forming a flag pattern, not yet completed, suggesting room for continued downside before reversal.
⸻
Trade Setups
🔴 Short Setup
Entry: 3940.00
TP1: 3540.00 TP2: 3125.00
SL: 4240.00
🟢 Long Setup (Breakout Play)
Entry: 4720.00
TP1: 5000.00 TP2: 5625.00
SL: 4475.00
⸻
Key Levels
Support: 3540.00 • 3125.00
Resistance: 4687.50 • 5000.00 • 5625.00
💬 ETH continues to trade within a bearish channel. A break below 3940.00 could trigger a move to 3540.00 and 3125.00, while a confirmed breakout above 4687.50 would invalidate the correction and open the way toward 5000.00 and higher

Future Trends in Global Index Trading1. Expansion of Thematic and Sector-Based Indices
Traditional indices like the S&P 500 or FTSE 100 are giving way to thematic indices that focus on specific industries or megatrends such as artificial intelligence, green energy, cybersecurity, biotechnology, and space technology.
Investors are increasingly allocating capital toward sectors that align with technological innovation or sustainability goals. This evolution will diversify index offerings and allow traders to gain exposure to cutting-edge sectors without needing to pick individual stocks.
For example, ESG and renewable energy indices are expected to attract major institutional inflows as global decarbonization policies intensify. Similarly, AI-focused indices will become a major attraction as machine learning reshapes corporate productivity.
2. Rise of AI and Algorithmic Trading in Index Management
Artificial Intelligence (AI) and algorithmic models are transforming index trading by enhancing speed, accuracy, and decision-making.
Advanced algorithms analyze massive data sets in real time, predicting market sentiment, volatility, and correlations between global indices. These tools enable traders to rebalance portfolios instantly and exploit arbitrage opportunities.
In the future, AI-driven “smart indices” could automatically adjust their weightings based on macroeconomic conditions, geopolitical risk, or investor sentiment — creating dynamic, self-optimizing benchmarks rather than static ones.
3. Increased Popularity of Passive Investing and ETFs
Over the past decade, passive index funds and exchange-traded funds (ETFs) have outperformed most active managers. This trend will continue as investors seek low-cost, diversified exposure to global markets.
Global ETF assets are projected to surpass $20 trillion by 2030, largely fueled by index-linked strategies. As more retail and institutional investors favor passive investing, liquidity in major indices like the MSCI World, NASDAQ-100, and Nifty 50 will deepen.
Moreover, fractional and automated ETF investing platforms will make index exposure more accessible, further democratizing global market participation.
4. Integration of ESG (Environmental, Social, and Governance) Criteria
Sustainability will be one of the defining features of future global index construction. Regulators and investors alike are demanding transparency, ethical governance, and environmental accountability.
ESG indices will not only track performance but also quantify corporate sustainability using measurable metrics such as carbon footprint, social equity, and board diversity.
In the next decade, “green indices” may become a mainstream benchmark, influencing capital allocation toward responsible corporations. Investors will increasingly use carbon-adjusted indices or climate risk-weighted indices to mitigate environmental exposure.
5. Real-Time Global Connectivity and 24/7 Trading
With technology reducing barriers between global markets, the concept of 24/7 trading across indices is becoming a reality.
Cryptocurrency markets already operate continuously, setting the precedent for traditional markets to follow. Index futures and global ETFs may soon be traded around the clock, allowing traders to react instantly to geopolitical or economic developments in any region.
Enhanced inter-market connectivity among exchanges in Asia, Europe, and North America will ensure smoother liquidity flow and minimize regional trading gaps.
6. Blockchain and Tokenization of Indices
Blockchain technology will revolutionize how indices are built, traded, and settled. Through tokenization, entire indices could be represented as digital tokens, allowing investors to buy fractional shares of global market indices seamlessly.
This innovation will make global index trading more transparent, secure, and accessible, particularly for retail investors.
Smart contracts could automate dividend distribution, rebalancing, and settlement, while decentralized finance (DeFi) platforms may introduce index-backed synthetic assets, enabling trading beyond traditional market hours.
The fusion of blockchain and finance will create a borderless, low-cost trading environment.
7. Customizable and Personalized Index Products
Investors of the future will demand customized indices that align with their personal risk tolerance, ethical values, or investment objectives.
Through AI-based portfolio construction, traders could create personal indices tracking specific sets of companies, sectors, or regions — effectively blending active and passive investing.
Robo-advisors and fintech platforms are already offering custom index portfolios that automatically rebalance based on user preferences, risk profiles, or global market movements.
This personalization trend will redefine how investors interact with global indices, making index trading both dynamic and individual-centric.
8. Data-Driven Trading and Predictive Analytics
The future of global index trading will rely heavily on big data, alternative data, and predictive analytics.
Beyond financial metrics, traders will analyze satellite imagery, shipping data, internet traffic, and sentiment analysis from social media to anticipate index trends.
Predictive models powered by machine learning will improve timing, reduce drawdowns, and identify early signals of macroeconomic shifts.
For example, sentiment data from millions of online sources could forecast the next market correction or bull run before it appears in traditional indicators.
Data-driven decision-making will become the cornerstone of competitive index trading.
9. Geopolitical and Economic Diversification
Global index traders must increasingly account for geopolitical risk, trade tensions, and currency fluctuations.
The rise of regional economic blocs — such as BRICS expansion, Asian market integration, and European green reforms — will lead to new regional index compositions.
Diversification across multiple regions will become essential to hedge against localized shocks like war, inflation, or policy shifts.
Future indices will incorporate multi-currency and multi-region components, helping investors reduce exposure to any single market’s volatility.
This diversification will also open opportunities for cross-border arbitrage and currency-hedged index products.
10. Regulatory Evolution and Market Transparency
As global index trading expands, regulatory oversight will strengthen. Authorities such as SEBI, SEC, and ESMA are developing frameworks to ensure data integrity, transparency, and investor protection in index creation and trading.
Future regulations will likely require disclosure of index methodologies, weighting criteria, and data sources, ensuring fairness and accountability.
Moreover, with the rise of AI and algorithmic trading, governments will impose ethical and operational standards to prevent manipulation and systemic risk.
Enhanced transparency will foster trust, attract more institutional participation, and create a stable global trading ecosystem.
Conclusion
The future of global index trading will be defined by technology-driven transformation, investor empowerment, and sustainable innovation.
AI, blockchain, ESG integration, and data analytics will reshape how indices are constructed, traded, and understood. The line between active and passive investing will blur as markets evolve toward automation, customization, and inclusivity.
As global economies become more interconnected, traders who embrace these trends — combining digital intelligence with strategic diversification — will thrive in the next generation of financial markets.

ETH Consolidates Below Yesterday Cloee ETH 30M – Waiting for Long Confirmation
After a sharp pullback, Ethereum is now consolidating right below key dynamic levels, the perfect zone where patience pays more than prediction.
🧭 System Overview:
I track 3 confirmation signals:
1️⃣ MLR10 crossing above SMA3.
2️⃣ MLR10 crossing above BB center
3️⃣ PSAR flipping below price.
⚙️ Current Time Frame (30m):
PSAR (gray) still above price → bearish bias not yet invalidated.
MLR10 (blue) is between SMA3 (magenta) and BB center (orange) → neutral zone.
RSI at 49.7 → momentum flat.
MACD turning red → fading strength.
200MA (red) near 4000 → key structural support.
💡 Interpretation:
ETH is preparing, not breaking.
There’s potential energy building, but entry discipline is crucial.
Until PSAR flips below and MLR reclaims both SMA and BB center, we stay flat.
📊 Market context:
Open Interest ↓ 1.8% → leverage cooling off.
Funding neutral → no retail squeeze in play.
Liquidations balanced → no directional aggression.
➡️ Conclusion:
No confirmed long yet, but structure shows early recovery potential.
A valid System Long will trigger once all 3 signals align.
Key levels:
Resistance: Yesterday close , dotted line
Support: MA50
Next long trigger → when PSAR flips & MLR > SMA3 > BB center
Always take profits and manage risk.
Interaction is welcome.

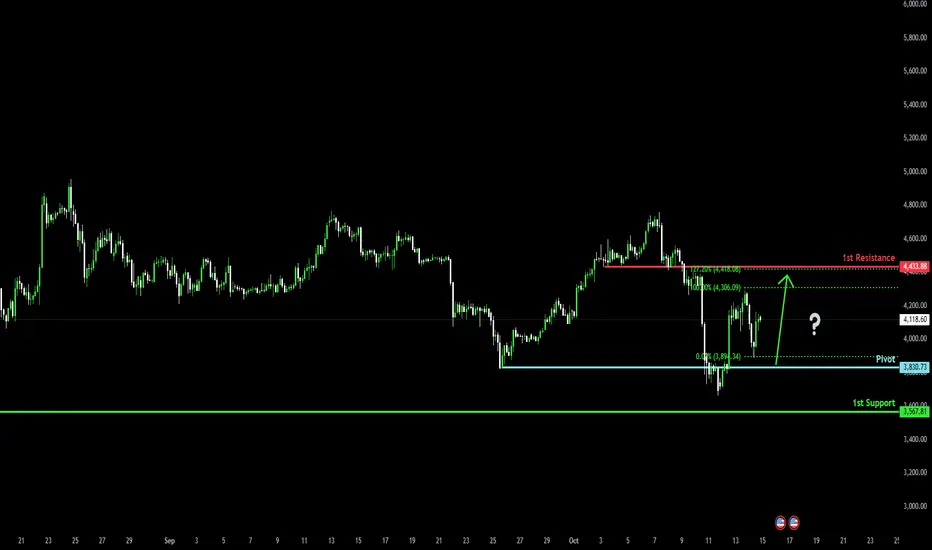
Bullish reversal setup?The Ethereum (ETH/USD) is falling towards the pivot and could bounce to the 1st resistance that aligns with hte 127.2% Fibonacci extension.
Pivot: 3,830.73
1st Support: 3,567.83
1st Resistance: 4,433.88
Disclaimer:
The above opinions given constitute general market commentary, and do not constitute the opinion or advice of IC Markets or any form of personal or investment advice.
Any opinions, news, research, analyses, prices, other information, or links to third-party sites contained on this website are provided on an "as-is" basis, are intended only to be informative, is not an advice nor a recommendation, nor research, or a record of our trading prices, or an offer of, or solicitation for a transaction in any financial instrument and thus should not be treated as such. The information provided does not involve any specific investment objectives, financial situation and needs of any specific person who may receive it. Please be aware, that past performance is not a reliable indicator of future performance and/or results. Past Performance or Forward-looking scenarios based upon the reasonable beliefs of the third-party provider are not a guarantee of future performance. Actual results may differ materially from those anticipated in forward-looking or past performance statements. IC Markets makes no representation or warranty and assumes no liability as to the accuracy or completeness of the information provided, nor any loss arising from any investment based on a recommendation, forecast or any information supplied by any third-party.
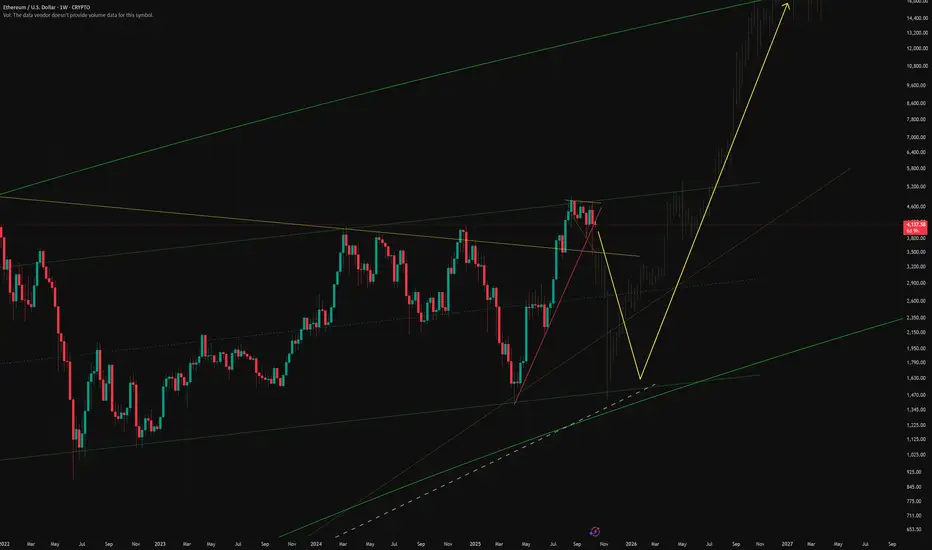
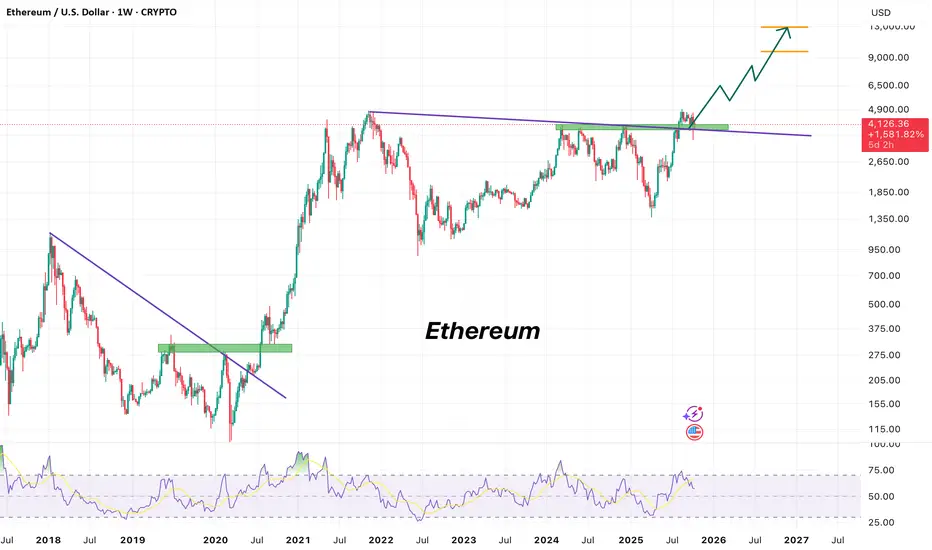
Ethereum aim for 10kWe bought eth for 1600$ this cycle and haven’t sold yet ! it’s not my intention to sell yet , in my retard mind A cycle without 10k Ethereum isn’t finished, it’s very resembling previous cycle , holding on the support on a good condition, all pairs look good , I extended my Altseason expectations to late 2026 but it’s not a bad news if we start going up in the next coming weeks, I never lost hope in crypto and there’s no Bitcoin without Alts , time for shine lady Eth .
NFA
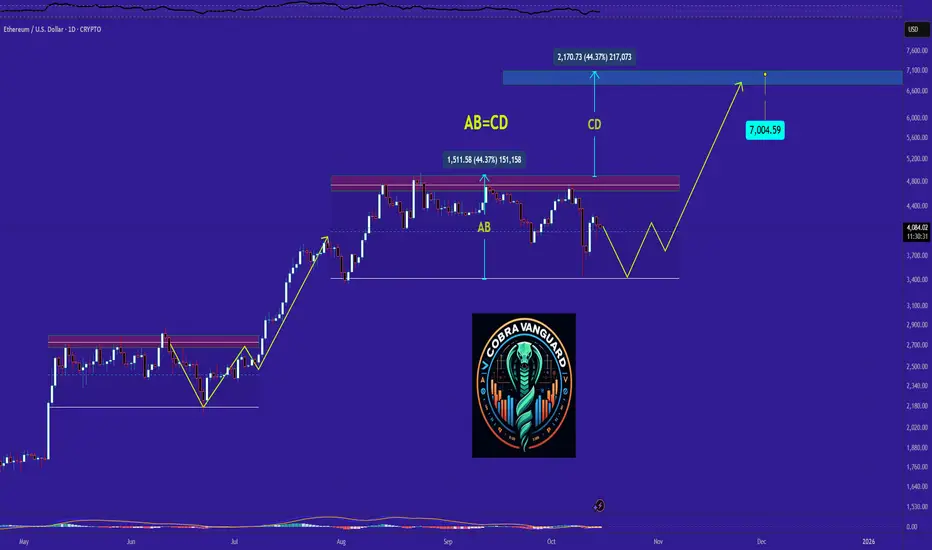
$ETH Price Prediction will hit $6K in 2026 see on chart...📈 Chart Analysis: Price is showing a Unique Bullish Megaphone Pattern and this is a Continuation Bull run Pattern. This Pattern is Very Rarely and it's made with on ATH areas. There is a False Breakout after the price will drop to support areas $3K - $3.5K and than pumping price very sharply. The price goes ATH area than falls breakout to Retested after Price will Break ATH areas. ATH area is a Dynamic Resistance area. When Fill this pattern it will be happened for $6K price areas 2026.
📊 Trading Setup: ETH Long Position setup guidelines: Major Support Areas is $3K and Dynamic Resistance area is ATH areas $4.9K, I'm using my Golden Fibonacci level for entry. There is 3 point of entry area is $3.4K, $3.6K, $3.8K and it's a Spot Position Entry point areas. Stoploss area is $3K and it's a support area. Profit the Target area is $4.2K $4.6K $5K $5.5K $6K.
🌍 Dominance Analysis: ETH Dominance is dumping ETH price will Pumping. The Dominance ATH is 22.38% of Resistance area in December 2021 and Support area is 6.95% in April 2025.
#Write2Earn #BinanceSquareFamily #Binance #BTC☀ #SUBROOFFICIAL
Disclaimer: This article is for informational purposes only and does not constitute financial advice. Always conduct your own research before making any investment decisions. Digital asset prices are subject to high market risk and price volatility. The value of your investment may go down or up, and you may not get back the amount invested. You are solely responsible for your investment decisions and Binance is not available for any losses you may incur. Past performance is not a reliable predictor of future performance. You should only invest in products you are familiar with and where you understand the risks. You should carefully consider your investment experience, financial situation, investment objectives and risk tolerance and consult an independent financial adviser prior to making any investment.

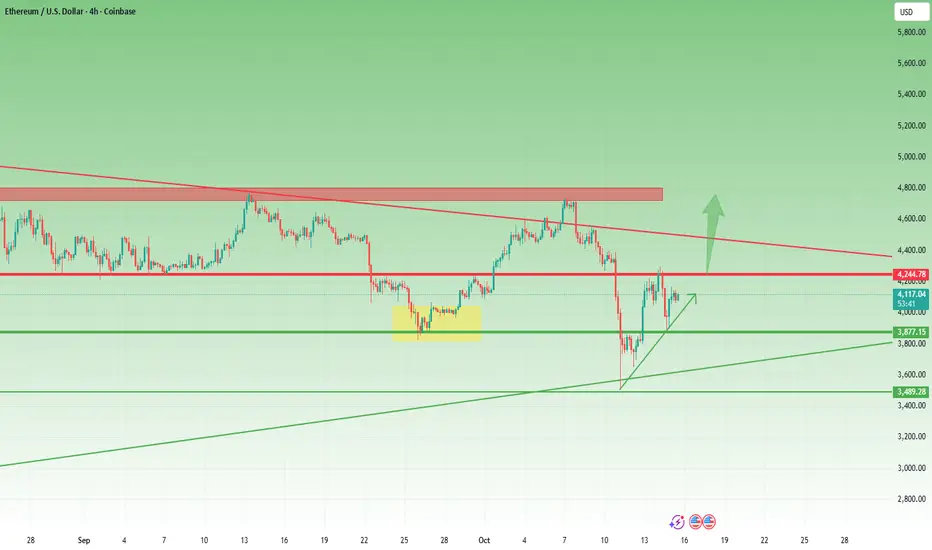
ETHEREUM BULLISH CONTINUATION TOWARDS 42000Ethereum (ETH/USD) Bullish Continuation Towards 4,200 Resistance
Ethereum is showing a strong bullish recovery pattern after rebounding from the lower trendline support around the $3,900–$4,000 zone. The chart structure indicates a clear phase transition:
1. Previous Phases:
Sell Zone: Initial downward move from overbought levels.
Range Zone: Period of consolidation where price accumulated strength.
Bull Phase: Breakout from the range with strong bullish candles confirming renewed buying interest.
2. Current Market Behavior:
ETH is now trading near $4,130, testing a mid-level resistance area. A slight pullback or minor correction is possible before the next upward move. The eye symbol and curved arrow suggest the market is gathering momentum for another push higher.
3. Key Levels:
Support Zone: $3,850 – $4,000 (strong demand area; previous breakout base)
Immediate Resistance: $4,200 – $4,250
Major Resistance: $4,300 – upper channel boundary
4. Bullish Scenario:
If ETH holds above $4,000 and breaks $4,200, we can expect a continuation toward $4,300+, confirming bullish dominance within the ascending channel.
5. Bearish Risk:
A break below $3,950 could invalidate the bullish structure and send ETH back toward $3,800–$3,600 support levels.
📈 Outlook:
Ethereum remains bullish in the short term as long as price action stays above $4,000. Traders may look for buying opportunities on dips targeting $4,200–$4,300.
Summary:
➡️ Trend: Bullish continuation
➡️ Buy Zone: $4,000–$4,050
➡️ Targets: $4,200 → $4,300
➡️ Support: $3,850–$3,950

ETHEREUM - Buy Zone 3930 - 3990 Market Trend: Ethereum is in a bullish trend, with waves (i), (ii), and (iii) of an Elliott Wave cycle already completed.
Short-Term Price Movement: The market is expected to correct in wave (iv), testing the $3,960–$3,880 support zone.
Buy again if the price touch again the level 3930-3990 and reverse.
confirm only!!!
if stays above $3,880, wave (v) is projected to target the $4,400–$4,500 zone.
COINBASE:ETHUSD

Mental Healthall ideas shared on chart
to anyone who took a heavy lose this past week first and for most
no amount of money is worth your life money can be made and lost
your life is not so easily replaced there is only one you
you will always be your most valuable asset to yourself and others
take a break the charts will always be here
learn the hard lesson and continue to move forward
some mistakes cost more then others
but remember your in complete control of the price you pay
dont give up you got this
feel free to directly reach out me if you need a friend
from texas with motivation and compassion
