ETH Structure & Key LevelsChatGPT 说:
Structure & Key Levels
Mid-term structure: A fast rally followed by sideways consolidation; pullback from the right-hand high, then grinding up → retrace → range. Trend not confirmed—range trading remains the base case.
Key candles: Two extreme volume bars (one near the vertical marker, one near the right-hand close) both occurred near the lows, typical of capitulation/passive rotation. Price quickly snapped back afterward, indicating solid demand/absorption at the lows.
Support zones
$3,900–3,915: Range midpoint; multiple successful retests.
$3,860–3,880: Long-wick, high-volume “protection” area; a break turns the structure bearish.
Resistance zones
$3,965–3,985: Recent range highs/high-volume node.
$4,015–4,030: Prior selloff origin; first touch likely meets supply.
Price–Volume Read
During the advance, volume did not expand, suggesting short covering + seller exhaustion rather than fresh long participation.
Two high-volume down bars/long lower wicks were quickly reclaimed—buyers more active at lows.
As price entered $3,965–3,985, volume faded, implying weak chase; likely needs another shakeout or a volume push to break through.
Two Trading Playbooks
A) Range Reversion (primary for now)
Short trigger: Tap $3,965–3,985 and print an M5 false breakout + reversal BOS with sell-side expansion.
Targets: $3,935 → $3,915
Invalidation: A 15m close above $3,985 followed by a successful retest/hold—abort shorts.
Long trigger: Pull back to $3,900–3,915 with declining volume → bullish expansion, and reclaim McGinley/TWAP.
Targets: $3,955 → $3,980
Invalidation: A 15m close below $3,900.
B) Breakout Continuation (backup plan)
Upside: A decisive break and 15m close above $3,985 (ideally on rising volume). Buy the retest of $3,965–3,980 if it holds.
Targets: $4,015 → $4,030 (prior supply; scale out).
Downside: A clean break below $3,900 with a failed retest (rejection).
Targets: $3,880 → $3,860; if heavy volume persists, watch $3,825–3,835 as prior support.
Trade ideas
$ETH (DAILY): DOWNTREND, yet still BULLISH, losing $4k SUPPORTThe most important chart for CRYPTOCAP:ETH is obviously the DAILY, and it looks like a correction (abc) is was completed on 10/10 when we witnessed a flash-crash to as low as $3450, perfectly in the middle of the SUPPORT ZONE ($3300 - $3600).
After this correction, we should see another surge in price, this would be WAVE 5, the last rally in this cycle, for sure. TARGETS start from $5861 (1.618 fib), and I consider this ELLIOT'S WAVE count to be a clean one, which means, more likely to materialize.
For now, it's been a struggle to stay above the key support/resistance level of $4k, still a DOWNTREND with a recent LOWER LOW followed by a sideways narrow chop.
200 MA at $3260 and upcurved, still a BULL MARKET coin. I'm on the sidelines until it either closes above $4100 or retraces back down by 10 or even 15%.
ETH v CRYPTOCAP:BTC on the WEEKLY, a rebound from the range bottom last APRIL, topped out in AUGUST at 0.0434, currently retracing to an important 0.0344 level, which MUST be hold to keep this year's momentum. Short-term BULLISH long-term BEARISH in relation to the KING.
💙👽

ETHShort term target for CRYPTOCAP:ETH is clearly $5200, as long as it can break out of the current resistance zone. The structure looks ready for the next leg up, with strong momentum building and buyers stepping in to push it higher.

Ethereum Near Breakout as Whales AccumulateCOINBASE:ETHUSD ’s price is testing key resistance levels after a steady week of accumulation. On the daily chart, COINBASE:ETHUSD remains capped by Fibonacci barriers at $3,986 (0.382) and $4,281 (0.618) — both of which rejected earlier rally attempts. A daily close above $4,281 could confirm a reversal toward $4,491–$4,954, while losing $3,804 risks a drop to $3,509.
The RSI continues to show a bullish divergence, as the indicator made higher lows while price formed lower lows between September 25 and October 22, hinting at fading bearish momentum.
On-chain metrics back the setup: whales added 150,000 ETH ($588 million) in 24 hours, and spent coin movement dropped 88%, showing rising holder conviction. Together, these signals strengthen Ethereum’s rebound case — but confirmation still depends on a clean breakout above $4,281.

ETHUSD trend prediction stage 3Anybody looking at the chart of ETHUSD, what do you think about the future trend of it?
I have been studying the charts price movement for years.
the status of ETHUSD is on the 3 downwards stage. But the sign of "3" is like sidewalk from the bottom. Anybody want to share your comment about that please?

$ETH in the calm before the storm.In the HTF view, Ethereum maintained its structural strength with rising lows, broke the major supply zone and is currently progressing in the retest process.
It is quietly accumulating strength and preparing for a new move between the 2021 ATH resistance and the area that used to be the supply zone and now serves as support as the demand zone.
Bear market rhetoric may be prevalent, but structural data suggests Ethereum is preparing for a major rally.

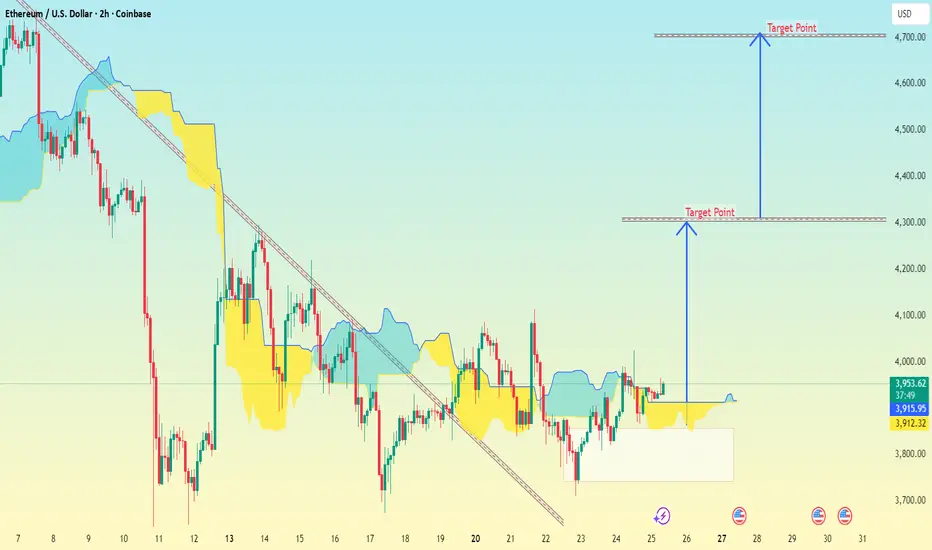
Ethereum (ETH/USD) on the 2-hour timeframe (Coinbase).Ethereum (ETH/USD) on the 2-hour timeframe (Coinbase).
My drawn two downward projection arrows labeled Target Point, showing possible downside continuation.
Here’s what the chart structure indicates:
Price is around $3,975–$4,000.
The structure shows a rising wedge breakdown, typically bearish.
Volume profile (yellow/blue areas) shows strong resistance above current levels.
Based on my arrows and price scale, my chart marks two main downside targets.
🎯 Target Zones
1. First Target Point: Around $4,200 → $4,250
Short-term correction zone, possible support test.
2. Second Target Point (Deeper move): Around $3,750 → $3,800
Major downside target — corresponds to full wedge breakdown measurement.
✅ Summary
Pattern: Rising wedge (bearish)
Current price: ~$3,975
Target 1: ~$4,200 (minor support retest)
Target 2: ~$3,750 (main bearish target)
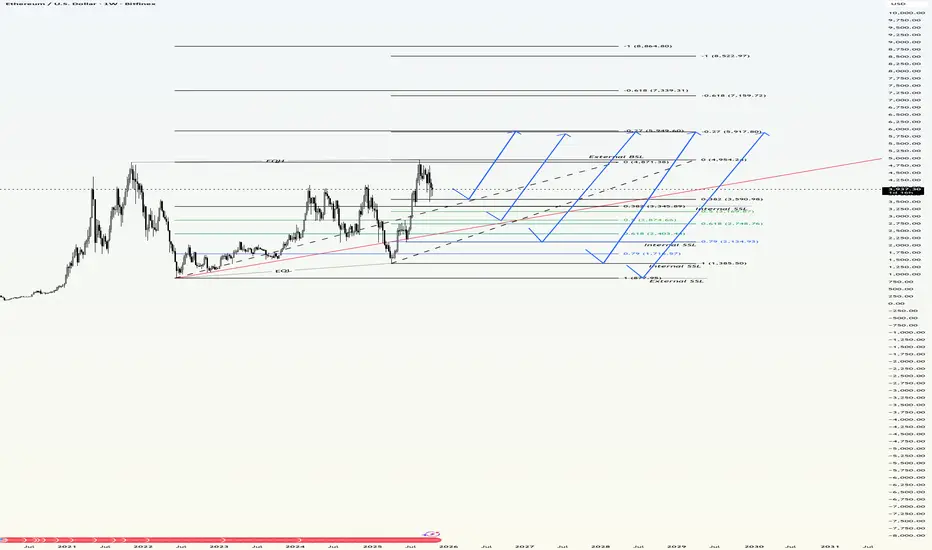
Possible scenarioos for the development of events on the weekly A good weekly sidebar. Which combines the Wyckoff method, J. Murphy method. Smart money concept. And a possible scenario or scenarios for the extension of Fibonacci. we have a return to the sidebar testing 0.38 Fibonacci of the last impulse up, if we go up from here it will be a trend execution, that is, aggressively. and so we have five possible scenarios . development of events on the chart. the market maker tried hard to make a good weekly chart. This is not investment advice!!! This is just the author's opinion!
ETH/USD – The Next Big Move Is Loading!Ethereum is setting up for a potential massive bullish reversal after finding strong support at a key demand zone (green box).
📊 Here’s my breakdown:
Demand Zone (Buy Area): 3,600 – 3,700
Target Zone (Sell Area): 4,350 – 4,400
Bias: Bullish — price is likely to tap into the demand zone before pushing upward.
Confirmation: Watch for bullish rejections or strong momentum candles from the green zone.
🧠 This setup aligns with previous liquidity sweeps and market structure shifts, showing clear signs that smart money may be reloading before the next leg up.
🔥 My Plan:
Waiting for a clean bounce from the green area → confirmation entry → target red zone.
💬 What do you think — will ETH respect the zone or break lower first?
Drop your view below 👇
⚠️ Not financial advice — for educational purposes only.
📈 Like & comment “ETH TO 4.4K 🚀” if you’re watching this move too!

Ethereum Short-Term Breakdown Imminent | ETHUSD Short Setup🚨 Ethereum (ETHUSD) Market Update – Short-Term Setup 🚨
Ethereum is displaying clear weakness on higher levels, as the recent bounce appears to be a relief move rather than a full trend reversal. The resistance zone between $4074 – $4175 remains crucial — price rejection from this area can offer a high-probability short opportunity.
We’re currently holding short positions from $3930, and if ETH extends upward, DCA shorts will activate near $4175 for a better average entry.
📉 Downside targets to watch:
🎯 $3750
🎯 $3636
🎯 $3540
🎯 $3480
Until a confirmed correction forms, avoid aggressive long setups. Market sentiment remains fragile, and bulls may face strong resistance around the upper range.
⚠️ Timeframe: 15-Minute (Scalp / Short-Term Setup)
💡 Tip: Manage risk carefully and trail stops as price moves in your favor.
📊 Follow me on TradingView for more real-time ETH and BTC updates, short-term scalps, and market breakdowns. Your feedback and comments are always welcome!
ETHEREUM (ETH/USD): Support holds-Is the Rally Just Beginning?!There is a strong likelihood that 📈ETHEREUM will continue its bullish movement from an important daily horizontal support level.
As a confirmation of this outlook, I observe a confirmed bullish Change of Character (CHoCH) and a breakout from the resistance line of a falling wedge pattern.
I anticipate growth to at least the 4100 level.

Don't sleep on Ethereum!Ethereum is following the pattern seen before the 2021 bull run of Bitcoin, and we are now in the final stages before the parabolic run for Ethereum.
CRYPTOCAP:BTC 2017\2021 vs. CRYPTOCAP:ETH 2021\2025

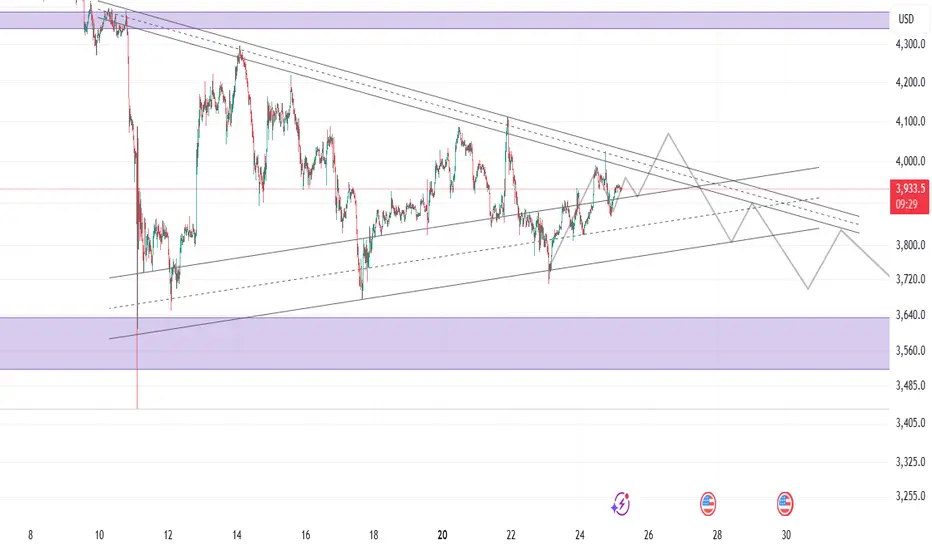
Ethereum's Moment of Truth, Will the 3850 Support Hold?
ETHUSD is currently at a critical inflection point, testing the ascending trendline support which coincides with the 3850 to 3950 multiple retest zone.
A strong bounce from this support could lead to another test of the descending trendline resistance, with a breakout targeting the 4085 level and then the 4200 to 4300 strong resistance zone.
Conversely, a failure to hold this ascending support and a breakdown below 3850 would signal a bearish turn in the short term.
In the event of a breakdown, the price would likely seek lower support levels, with the next significant targets being the 3700 key level and then the key support near 3500.
Disclaimer:
The information provided in this chart is for educational and informational purposes only and should not be considered as investment advice. Trading and investing involve substantial risk and are not suitable for every investor. You should carefully consider your financial situation and consult with a financial advisor before making any investment decisions. The creator of this chart does not guarantee any specific outcome or profit and is not responsible for any losses incurred as a result of using this information. Past performance is not indicative of future results. Use this information at your own risk. This chart has been created for my own improvement in Trading and Investment Analysis. Please do your own analysis before any investments.

Ethereum Wave Analysis – 24 October 2025
- Ethereum reversed from support zone
- Likely to rise to resistance level 4095,00
Ethereum cryptocurrency recently reversed up from the support zone between the strong support level 3745.00 (which reversed the price multiple times this month) and the 38.2% Fibonacci correction of the upward impulse from June.
The upward reversal form this support zone is likely to form the daily Japanese candlesticks reversal pattern Morning Star – strong buy signal for Ethereum.
Given the clear daily uptrend, Ethereum cryptocurrency can be expected rise fall to the next resistance level 4095,00 (which stopped the previous correction ii).

Why I’m Focused on Ethereum (and BTC) — and Ignoring Other AltsWhy I’m Focused on Ethereum (and BTC) — and Ignoring Other Alts🎯
Let’s catch up on the big picture 🧠
Bitcoin Dominance is climbing again — no surprise if you've been following the structure. After rejecting from the previous channel breakdown (which aligned with Ethereum’s last pump), we are now likely heading for a third touch near 62.25% . Until then, alts may stay muted .
As for Bitcoin itself, the October flash and last Friday’s move created a potential triple test pattern. Expect sideways and choppy price action — resistance at 103k is key. These levels are hard to trade… until they suddenly become very easy. 🧩
On the one-day chart, this is nothing new — we've seen pullbacks from 72k to 50k before explosive moves. Still bullish.
But let’s be real — Ethereum is the alpha here . 💙
Last Friday’s move was well above the October 11th flash crash, and it respected all the posted levels perfectly. ETH support = 3789 , resistance = 4100. Still long ETH , and still my preferred asset.
That bias is supported by Ethereum Dominance — currently at 12%, targeting 18% . Add to that ETH/BTC chart expecting a rise to 0.0645532 — and you see why ETH is at the center of my thesis.
As I said: “When I say it will happen, it usually happens.”
I’m not looking at Solana, XRP, BNB, Pepe, ADA, LINK, GRT, or TRON . Right now, it’s all about Bitcoin and Ethereum — especially Ethereum.
💡 How I Trade
No secrets:
— Daily budget
— High leverage but small size
— Stick to one direction (currently LONG)
— Buy dips , don’t panic
— Levels are everything
I haven’t deposited in 5 years. That tells you enough.
Right now, I’m long over 3789 . Same level from early September. The system works. Respect the levels, and they’ll work for you too.
🔄 Perspective Shift
This is a new cycle. After the FTX + Luna catharsis, we’re entering the next act. It’s not just Bitcoin that will prevail — crypto will prevail . Stay alert. I’ll break it all down in future updates.
One Love,
The FXPROFESSOR 💙
⚠️ I'm not a financial advisor — I'm a master of Prognosis. These are my personal views. I read charts like a poet reads the stars. You still gotta trade at your own risk, if you want to trade at all! 🧠💥

bulish ETHafter breack this are 45% go up and aravei this price and now the price back to suport area and now wait for new target....

ETHUSD Ascending channel breakdown selling strong🚨 ETHUSD Technical Update 🚨
📉 Breakdown Alert!
ETHUSD has officially broken down from its ascending channel and key support area around $3,950 — signaling potential bearish momentum ahead.
💥 Selling Zone: $3,950
🎯 Technical Target: $3,700 (next major support zone)
📊 Indicators:
✅ EMA 50 breakdown confirmed — bearish bias strengthening.
⚠️ EMA 20 is crossing down toward the EMA 50, which could confirm further downside pressure.
🧭 Bias: Bearish below $3,950
💡 Watch for potential retests of the breakdown zone before continuation lower.
#ETH #Ethereum #CryptoAnalysis #TechnicalAnalysis #TradingSetup #BearishSignal 🐻📉

Eth Bullish Continuation IdeaEth bullish continuation idea. Buyers must recapture $3950 first and foremost. Eth is showing potential classic bullish divergence on both the MacD and RSI here on the daily time frame. It is in a well-established uptrend (not considering the most recent price action, where it has been consolidating for some time up here in the high $3k's - low $4k's). Let's see what happens. Easy to strategize an entry, stop loss, take profit(s) where you can take on minimal losses if it fails. kangz.

ETHUSD: Swing LOWWave 1 completed ✅
RSI & EMA cross ✅
New S&R zone w. ATR✅
Just waiting for Trend Direction and Im Live!
Stay Tuned Prosperous Traders
and God Bless

Potential bearish drop off?Ethereum (ETH/USD) has rejected off the pivot and could drop to the multi swing low support.
Pivot: 3,934.93
1st Support: 3,691.52
1st Resistance: 4,093.31
Disclaimer:
The above opinions given constitute general market commentary, and do not constitute the opinion or advice of IC Markets or any form of personal or investment advice.
Any opinions, news, research, analyses, prices, other information, or links to third-party sites contained on this website are provided on an "as-is" basis, are intended only to be informative, is not an advice nor a recommendation, nor research, or a record of our trading prices, or an offer of, or solicitation for a transaction in any financial instrument and thus should not be treated as such. The information provided does not involve any specific investment objectives, financial situation and needs of any specific person who may receive it. Please be aware, that past performance is not a reliable indicator of future performance and/or results. Past Performance or Forward-looking scenarios based upon the reasonable beliefs of the third-party provider are not a guarantee of future performance. Actual results may differ materially from those anticipated in forward-looking or past performance statements. IC Markets makes no representation or warranty and assumes no liability as to the accuracy or completeness of the information provided, nor any loss arising from any investment based on a recommendation, forecast or any information supplied by any third-party.

ETH UpdateETH seemed to be having issues holding on to gains today. Revised my plot.
CPI numbers tomorrow, so no positions. Crypto could possibly tank tomorrow if inflation is high. Conversely if CPI numbers are good then we'll see a bump up as shown.

TAKE YOUR CRYPTO PROFITS NOW.Eth dropped from $1,463.72
to $80 in 2018.
$4,382.31 to $1,1700 in 2021
$4,868.53 to $880 in 2022
$4,090.92 to $1,384 in 2024
$4,104.83 to $1,384.66 in 2025
If you are reading this then you likely are invested in ETH or BTC or an ALT. This is your 2nd or 3rd bullmarket. You're deciding right now if you should take profit while you still have a little profit left or hold and pray for an ALT SEASON. If you consider Cryptos getting wiped out nearly 100 percent then rallying back up over 1000 percent to the old price an Alt Season then go ahead. You have already lost most of your profit this cycle so far. The charts are saying sell but you're ignoring the clear signs like you did last bullmarket. You need to take profits while you still have some left. Ethereum will be alot cheaper in a month or two. You can always buy more. Don't mess this up like you did last cycle. Get out!!!!! The technical indicators says its over for now. Be smart and sell!!!!! You lost a lot of profit so far. You know I'm right. The last few cycles you tried to get the top and lost your profits and had to wait all over again. You know I am right. The point of investing in Crypto is to make a living while you are still alive or still young. ALTS will give back all your profits in a short time and leave you waiting for next cycle like last time.

ETHUSD: Last Wave of Impulse or Start of a Big Correction?Weekly Scenarios
Bullish scenario:
ETH holds above ~$3,800 and breaks resistance at ~$4,500 → wave factor (5) intensifies → possible rise to ~$5,000.
Consolidation:
The price remains between ~$3,800 and ~$4,500, forming a sideways range, accumulating energy for the next move.
Bearish scenario:
Breakdown of support at ~$3,800 with volume confirmation → corrective wave A-B-C begins → test of ~$3,400–3,600.
✅ Conclusion
ETH/USD is at a key point for the coming week: either the bullish upward momentum ends, or a significant correction begins.
Watch for support at ~$3,800 to hold—a breakout could very well change the direction of the movement.
If the resistance at ~$4,500 is broken, the upward momentum will activate.
Primary targets: ~$5,000 if up, ~$3,400–$3,600 if corrected.
