ETH FORMED A DOUBLE TOP!COINBASE:ETHUSD eth forming a double top . If we dont see any pullback next stop is 4200.
NOTE: Im not any pro or guru. just sharing my thoughts .
Trade ideas

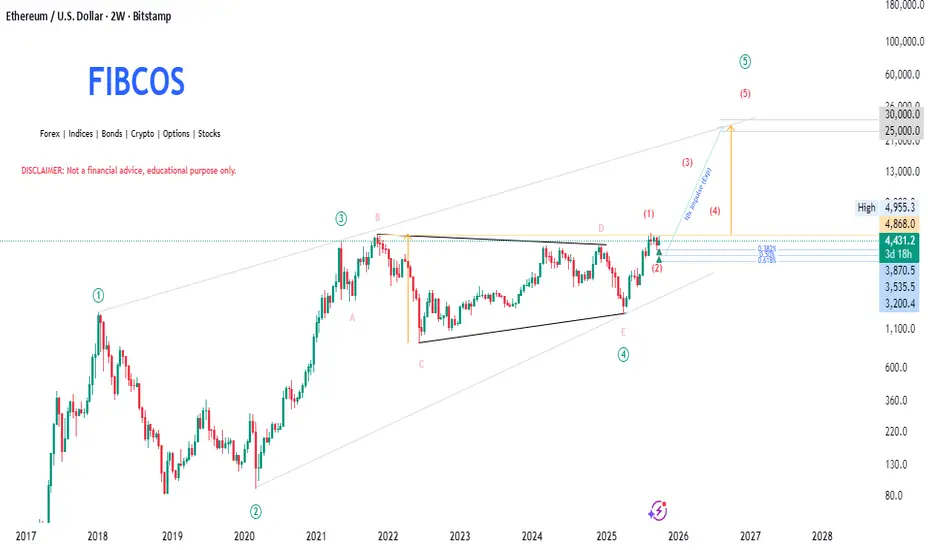
Ethereum(ETH) - Macro Outlook by FIBCOS🔍 Ethereum - Macro Outlook by FIBCOS 🧠
“From Contraction to Expansion – The Supercycle Awakens”
🌌 Super Market Cycle: The Final Push Begins
Ethereum is in the final stage of a Grand Supercycle 🌍 — a massive multi-year wave count aligning with the Elliott Wave Theory .
✅ Wave (1) and (2) established early strength
✅ Wave (3) peaked explosively in 2021 📈
✅ Wave (4) formed a beautiful contracting triangle (ABCDE) , a classic wave 4 corrective pattern
🟢 Now breaking out of Wave (4), we're entering Wave (5) — the euphoric leg 🚀
🌊 Wave Theory Magic: Riding the Impulse
We're deep into the impulsive sequence — and here's what stands out:
1️⃣ Wave (1) initiated the reversal from the triangle bottom
2️⃣ Wave (2) retraced perfectly to key Fib levels — golden pocket zone ✨
3️⃣ Current move is Wave (3) of (5) — historically the most powerful and extended wave 💥
🔮 Wave (5) targets extend toward $25,000–$30,000 based on Fibonacci projections 🧭
📐 Fibonacci Retracement & Extension: Precision Tools
After Wave (1), ETH retraced to the following golden zones:
🔵 0.382 – $3,870
🟣 0.50 – $3,535
🟢 0.618 – $3,200
These levels acted as strong demand zones 🛡️, where price was absorbed and reversed, showing institutional interest.
📈 For extensions:
Wave (3) targets: ~$15,000 (1.618 extension)
Wave (5) projection: $25K–$30K 🎯
🧠 Smart Money Concept (SMC): Liquidity Engineered Setup
SMC confirms the big players have already positioned:
🪤 ABCDE triangle = liquidity trap
🔥 Wave E = final sweep before the breakout
✅ Structure Break = Smart Money entry signal
🧱 Demand Zone @ ~$3,800–$4,200 = institutional orders filling 🏦
The Change of Character (ChoCH) + Break of Structure (BoS) = textbook confirmation of bullish intent 📚
🧱 Market Structure: From Consolidation to Expansion
We’ve broken multi-year resistance 💥
🔁 Previous All-Time High (ATH) now acting as strong support
📈 Higher highs and higher lows = full bullish market structure
🚀 Confirmed trend shift after accumulation → expansion phase
🔎 Price Action: Clean, Convincing, Bullish
The breakout candle is powerful:
✅ Big-bodied green candles
✅ Little-to-no upper wick = aggressive buyers in control 🐂
✅ Imbalance created below — potential “buy-the-dip” zones between $3,800–$4,200 📉🛒
ETH is now printing strength with every candle — the market is speaking clearly.
🌍 Macro-Fundamental Context – Ethereum’s Underlying Strengths
Ethereum’s fundamentals provide strong structural support for this technical forecast:
ETH ETF Approvals (Pending):
U.S. and global ETF prospects are building momentum, opening gates to institutional inflows akin to Bitcoin's ETF impact.
Layer-2 Scaling Adoption:
Networks like Arbitrum, Optimism, and zkSync are maturing rapidly, improving transaction efficiency and reducing on-chain congestion.
Ethereum 2.0 Transition/PoS Era:
Ongoing deflationary tokenomics (EIP-1559 burn + staking lock-up) are reducing effective circulating supply, supporting price growth.
DeFi Revival:
With macro liquidity cycles turning upward, usage and TVL (Total Value Locked) in Ethereum-based DeFi is expected to rise sharply.
AI x Blockchain Synergy:
Ethereum remains positioned to become the base layer for decentralized AI infrastructure — a potential catalyst for long-term valuation expansion.
These catalysts serve as the fundamental “fuel” behind the unfolding Wave (3) and the eventual Wave (5) .
🎯 Final Word: All Systems GO 🚀
The confluence is undeniable:
✅ Super Cycle 🔁
✅ Elliott Wave 📊
✅ SMC Smart Money 📈
✅ Price Action 🔍
✅ Market Structure 🏗️
✅ Fibonacci Levels 📏
✅ Fundamentals 🌍
💡 Ethereum is positioned to explode into its Wave (5) super-cycle with $30,000 as a potential macro target.
If you're looking for the high time frame narrative , this is as strong as it gets . Don’t chase. Plan the entry on retracements and ride the wave 🌊.
💬 "Structure unlocks direction, and Fibonacci refines destination." – FIBCOS
📘 Disclaimer: This is a structural, educational market outlook. Not financial advice. Please do your own due diligence and risk management.
#FIBCOS #ElliottWave #SmartMoneyConcept #MarketAnalysis #Gold #XAUUSD #ElliottWave #WaveTheory #SuperCycle #MacroTrend #SmartMoney #Fibonacci #PriceAction #Commodities #TechnicalAnalysis #LongTermOutlook
ETH is pushing down the chart is showing a strong sellers domination , either they trying to swipe as much liquidity as they can to aim for new hogh ; or is it the market finding a balance what's your opinion ?

ETH/USD: $6,000 at the End of the Cycle in Late 2025?While the debate over the timing of the end of the bullish cycle continues, Ether (ETH) has reached the 26th position worldwide ($540 billion USD) in the ranking of global market capitalizations across all asset classes. For comparison, gold ranks first at $27 trillion USD, and Bitcoin is in 7th place with $2.45 trillion USD.
Regarding Bitcoin’s price and the possible dates for the end of the bullish cycle linked to the 2024 halving, I invite you to click on the chart below. You’ll see that the end-of-cycle window lies between October 18 and November 20.
But let’s return to the focus of this analysis: Ethereum — specifically the ETH/USD price and a realistic price target for this cycle, taking into account its positive correlation with Bitcoin.
In this article, I will rely on chart analysis using weekly and daily timeframes, applying classical charting tools, Elliott Waves, and Fibonacci extension ratios.
1) According to the medium-term chart (Japanese candlesticks, weekly data), the underlying trend remains bullish above the $3,800 support.
The chart below shows that ETH/USD’s long-term trend remains bullish as long as the market price holds above a large triangular pattern that broke upward this summer. The primary trend is therefore bullish above the $3,800 support on a weekly closing basis.
The first chart below shows ETH/USD weekly Japanese candlesticks:
2) According to Elliott Wave analysis, the final end-of-cycle target could be $6,000 by late 2025.
On this Ethereum (ETH/USD) chart, Elliott Wave analysis shows a five-phase bullish structure, with Wave 5 yet to come. After the Wave 4 correction, the market appears to have found a bottom around $3,800 — an area corresponding to the 0.382 retracement of Wave 3. The current recovery suggests the potential start of the fifth impulsive wave.
The theoretical target for Wave 5 is around $6,000, corresponding to a 0.618 Fibonacci extension from the bottom of Wave 1 to the top of Wave 3, projected from Wave 4. This level also aligns with a major psychological zone and a classic target for the end of a full bullish cycle.
As long as the price stays above $3,800, this remains the most likely technical scenario.
The second chart below shows ETH/USD daily Japanese candlesticks:
DISCLAIMER:
This content is intended for individuals who are familiar with financial markets and instruments and is for information purposes only. The presented idea (including market commentary, market data and observations) is not a work product of any research department of Swissquote or its affiliates. This material is intended to highlight market action and does not constitute investment, legal or tax advice. If you are a retail investor or lack experience in trading complex financial products, it is advisable to seek professional advice from licensed advisor before making any financial decisions.
This content is not intended to manipulate the market or encourage any specific financial behavior.
Swissquote makes no representation or warranty as to the quality, completeness, accuracy, comprehensiveness or non-infringement of such content. The views expressed are those of the consultant and are provided for educational purposes only. Any information provided relating to a product or market should not be construed as recommending an investment strategy or transaction. Past performance is not a guarantee of future results.
Swissquote and its employees and representatives shall in no event be held liable for any damages or losses arising directly or indirectly from decisions made on the basis of this content.
The use of any third-party brands or trademarks is for information only and does not imply endorsement by Swissquote, or that the trademark owner has authorised Swissquote to promote its products or services.
Swissquote is the marketing brand for the activities of Swissquote Bank Ltd (Switzerland) regulated by FINMA, Swissquote Capital Markets Limited regulated by CySEC (Cyprus), Swissquote Bank Europe SA (Luxembourg) regulated by the CSSF, Swissquote Ltd (UK) regulated by the FCA, Swissquote Financial Services (Malta) Ltd regulated by the Malta Financial Services Authority, Swissquote MEA Ltd. (UAE) regulated by the Dubai Financial Services Authority, Swissquote Pte Ltd (Singapore) regulated by the Monetary Authority of Singapore, Swissquote Asia Limited (Hong Kong) licensed by the Hong Kong Securities and Futures Commission (SFC) and Swissquote South Africa (Pty) Ltd supervised by the FSCA.
Products and services of Swissquote are only intended for those permitted to receive them under local law.
All investments carry a degree of risk. The risk of loss in trading or holding financial instruments can be substantial. The value of financial instruments, including but not limited to stocks, bonds, cryptocurrencies, and other assets, can fluctuate both upwards and downwards. There is a significant risk of financial loss when buying, selling, holding, staking, or investing in these instruments. SQBE makes no recommendations regarding any specific investment, transaction, or the use of any particular investment strategy.
CFDs are complex instruments and come with a high risk of losing money rapidly due to leverage. The vast majority of retail client accounts suffer capital losses when trading in CFDs. You should consider whether you understand how CFDs work and whether you can afford to take the high risk of losing your money.
Digital Assets are unregulated in most countries and consumer protection rules may not apply. As highly volatile speculative investments, Digital Assets are not suitable for investors without a high-risk tolerance. Make sure you understand each Digital Asset before you trade.
Cryptocurrencies are not considered legal tender in some jurisdictions and are subject to regulatory uncertainties.
The use of Internet-based systems can involve high risks, including, but not limited to, fraud, cyber-attacks, network and communication failures, as well as identity theft and phishing attacks related to crypto-assets.

Fakeout, now breakout.Rejected the top resistance fell, then broke.. only up from here. Target potential between nov 11 to December 11.. minimum 11,500..

ETHEREUM Free Signal! Buy!
Hello,Traders!
ETHEREUM rebounds from the horizontal demand area, confirming Smart Money accumulation within discount territory. Liquidity has been swept below recent lows, opening the way for expansion toward 4,659$ as inefficiency gets filled.
-------------------
Stop Loss: 4,406$
Take Profit: 4,659$
Entry: 4,531$
Time Frame: 4H
-------------------
Buy!
Comment and subscribe to help us grow!
Check out other forecasts below too!
Disclosure: I am part of Trade Nation's Influencer program and receive a monthly fee for using their TradingView charts in my analysis.

ETHUSD 1H – Bulls Gaining StrengthBITSTAMP:ETHUSD
📊 🚀
Structure | Trend | Key Reaction Zones
ETH retested the strong demand zone (4400–4450) and showed a clear bullish reaction, reclaiming short-term structure with higher lows forming.
Market Overview
After the sharp rejection from the 4750 resistance zone, ETH entered accumulation and tapped the key demand box. Price is now showing momentum recovery with bullish candles breaking back above the 4500 level, indicating potential continuation toward upper resistance levels.
Key Scenarios
✅ Bullish Case 🚀 → 🎯 Target 1: 4620 | 🎯 Target 2: 4670 | 🎯 Target 3: 4750
❌ Bearish Case 📉 → Break below 4450 may shift bias back toward 4400.
Current Levels to Watch
Resistance 🔴: 4620 – 4670 – 4750
Support 🟢: 4450 – 4400
⚠️ Disclaimer: This analysis is for educational purposes only. Not financial advice.

Retested 21 ema and 50dma Ethereum has retested the breakout of the 50dma and the 21ema.
next stop is above ATH
ETHUSD – 1H | Bullish Reversal from Demand ZoneBITSTAMP:ETHUSD
Structure | Trend | Key Reaction Zones
Market retested the 4,440–4,465 strong demand zone, respecting structure after a deep liquidity sweep.
Overall structure remains bullish, with previous accumulation and breakout zones aligning with channel support.
Market Overview
ETH completed a sharp correction after facing rejection near 4,758 resistance, tapping into the demand base where buyers previously stepped in. With liquidity cleared and demand reaction visible, a bullish continuation is likely if price holds above 4,465.
Key Scenarios
✅ Bullish Case 🚀 →
🎯 Target 1: 4,535
🎯 Target 2: 4,621
🎯 Target 3: 4,672 (major resistance retest)
❌ Bearish Case 📉 →
Invalidation below 4,413 (break of demand zone).
Current Levels to Watch
Resistance 🔴: 4,621 / 4,672
Support 🟢: 4,465 / 4,413
⚠️ Disclaimer: This analysis is for educational purposes only. Not financial advice.

ETH: 4500 - The Crucial Flip
ETH: 4500 - The Crucial Flip
Ethereum (ETHUSD) on the 4-hour timeframe is currently undergoing a retracement from recent highs, testing the crucial "4500 Flip Zone" and the dynamic ascending trendline, with price at ap-proximately 4,476.
Bullish Scenario: A successful defense of the "4500 Flip Zone" and the trendline, leading to a bounce, would indicate a continuation of the upward trend, targeting the 4650 resistance and subsequently the "4800 to 4900 Sell Order Block."
Bearish Scenario (Immediate): Conversely, a confirmed breach and sustained trading below the "4500 Flip Zone" and the trendline would signal a weakening of the bullish structure, likely leading to a retest of the "4200 to 4300 Key Level."
Bearish Scenario (Deeper): Should the "4200 to 4300 Key Level" fail to hold, deeper support levels at "4000" would become the next significant areas to watch for potential buying interest.
Disclaimer:
The information provided in this chart is for educational and informational purposes only and should not be considered as investment advice. Trading and investing involve substantial risk and are not suitable for every investor. You should carefully consider your financial situation and consult with a financial advisor before making any investment decisions. The creator of this chart does not guarantee any specific outcome or profit and is not responsible for any losses incurred as a result of using this information. Past performance is not indicative of future results. Use this information at your own risk. This chart has been created for my own improvement in Trading and Investment Analysis. Please do your own analysis before any investments.

EthereumETHUSD
- RSI - Divergence
- Order Block
- Demand Zone
- Fibonacci Level - 38.20%
- Completed " 1234 " Impulsive Waves

Ethereum Price Consolidates as Volatility FadesEthereum (ETH) is currently moving sideways, trading within a tight range. The one-day chart shows a clear decline in market volatility, reflecting a balance between buying and selling pressure.
The Average True Range (ATR), a key volatility indicator, has dropped to signaling reduced price swings and cautious market behavior. This decline in ATR highlights that traders are taking fewer risks, leading to smaller moves and lower trading activity.
Periods of compressed volatility like this often precede significant price moves. As ETH remains stuck in this narrow range, traders are watching closely for a potential breakout that could set the tone for the next major trend.
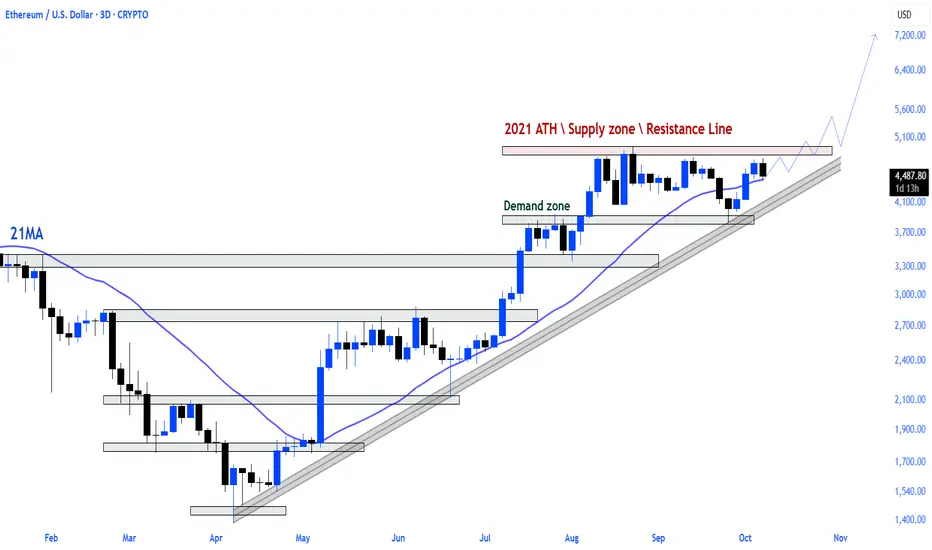
$ETH is pushing the critical threshold.Ethereum maintains its upward trend as it approaches the supply zone and major resistance line from its 2021 peak once again.
The price structure, backed by the 21MA support, shows that momentum remains upward with a strong series of higher lows.
A breakout from this region would mark a transition to a new parabolic phase for ETH.
Ethereum slides below $4,750 Ethereum slides below $4,750
Canary Capital has filed to launch spot ETFs for Litecoin (LTCC) and Hedera (HBR), each carrying a 0.95% management fee. Analysts say the products appear ready for approval, but the ongoing U.S. government shutdown has paused SEC activity, delaying reviews until late October.
The firm’s filings also outline enhanced access controls for users of Bitcoin and Ethereum, signaling broader integration within regulated crypto markets. Experts suggest the move could boost interest in altcoins once operations resume.
Meanwhile, Ethereum faces heavy validator outflows, with over 2.4 million ETH (≈$10B) awaiting withdrawal — the largest on record. Despite this, institutional demand remains strong, and Grayscale’s newly approved Ethereum Trust ETF with staking has been viewed as a bullish development for ETH and the broader crypto market.

ETHUSD Bullish Trend Potential | Break and Retest Trade Plan📹 In this video, we take a closer look at Ethereum (ETH), which has been in a strong bullish trend on the higher time frames 🔥. Recently, ETH has seen a deep pullback, offering potential opportunities if price action confirms a bullish break of market structure on the 30-minute timeframe ⏱️.
💡 I’m watching for a break and retest of the existing range low support, which could signal a continuation of the broader uptrend.
📊 In the video, we cover price action, market structure, trend analysis, and share a trade idea based on these factors 🎯.
⚠️ Disclaimer: This content is for educational purposes only and not financial advice.

#ETH/USDT looking extremely bullish#ETH
The price is moving within a descending channel on the 1-hour frame, adhering well to it, and is heading for a strong breakout and retest.
We have a bearish trend on the RSI indicator that is about to be broken and retested, which supports the upward move.
There is a major support area in green at 4400, which represents a strong support point.
We are heading for consolidation above the 100 moving average.
Entry price: 4455
First target: 4512
Second target: 4573
Third target: 4650
Don't forget a simple matter: capital management.
When you reach the first target, save some money and then change your stop-loss order to an entry order.
For inquiries, please leave a comment.
Thank you.

G7 and G20: The Powerhouses Shaping the Global Market LandscapeIntroduction: The Giants Behind the Global Economy
In the modern financial world, two alliances stand out as the nerve centers of global economic governance — the G7 (Group of Seven) and the G20 (Group of Twenty). These powerful coalitions bring together the world’s most influential economies to discuss, design, and direct international economic and financial policies. They influence everything from trade and taxation to debt relief and digital innovation.
While the G7 represents the established industrialized powers, the G20 bridges the developed and developing worlds, making it the most comprehensive global economic forum. Together, they shape policies that impact every corner of the world — from Wall Street to rural villages in emerging economies. Understanding how these groups operate offers a lens into the mechanics of the global market, power politics, and economic diplomacy.
1. The Birth of Economic Alliances
1.1 Origins of the G7
The G7 was born out of a crisis. In the early 1970s, the world was shaken by the collapse of the Bretton Woods fixed exchange rate system and the 1973 oil shock. To restore order and coordinate responses, finance ministers from the U.S., U.K., France, Germany, Japan, and Italy met in 1975. Canada joined soon after, forming the Group of Seven.
Their goal was clear — to stabilize global finance and prevent future crises through collective decision-making. Over time, the G7 expanded its focus to include issues like climate change, development, and technological innovation.
1.2 The Rise of the G20
The G20 emerged in 1999 after the Asian Financial Crisis, which exposed the limits of the G7’s reach. The global economy had changed — emerging markets like China, India, and Brazil were becoming major players. It was no longer sustainable for a handful of rich nations to dictate global economic policy.
The G20 was created to include both advanced and emerging economies, representing about 85% of global GDP, 75% of global trade, and two-thirds of the world’s population. It became the main platform for managing international economic cooperation, especially after the 2008 Global Financial Crisis.
2. Composition and Membership: Power in Numbers
2.1 G7 Members
United States
United Kingdom
Canada
France
Germany
Italy
Japan
The European Union also participates as a non-enumerated member.
These countries share democratic values, high income levels, and deep-rooted industrial and financial systems. Their combined GDP accounts for nearly 45% of global wealth, giving them substantial leverage over world financial markets.
2.2 G20 Members
The G20 includes all G7 members plus:
Argentina, Australia, Brazil, China, India, Indonesia, Mexico, Russia, Saudi Arabia, South Africa, South Korea, and Turkey.
It also includes the European Union as a bloc and invites key international organizations such as the IMF, World Bank, WTO, and OECD.
This blend of developed and developing nations makes the G20 a unique platform — it balances the perspectives of the industrialized North and the fast-growing South.
3. The G7’s Role in the Global Market
The G7 is often viewed as the “executive club” of the world’s most advanced economies. Though small in size, its impact is vast.
3.1 Setting the Economic Agenda
The G7 influences monetary and fiscal policies globally. Decisions made in G7 summits can shape currency values, interest rate expectations, and global trade policies.
For example:
1985 Plaza Accord — The G7 agreed to weaken the U.S. dollar to fix global trade imbalances.
2017–2022 Discussions — Focused on countering protectionism and strengthening global supply chains after trade wars and the COVID-19 pandemic.
3.2 Defending the Rules-Based Order
The G7 champions free markets, democracy, and transparency. It sets global standards for corporate governance, anti-corruption measures, and digital taxation. These principles ensure fairer competition in international trade.
3.3 Crisis Management and Sanctions
The G7 often acts as the “first responder” to global crises. Whether it’s debt relief for Africa in the 2000s or coordinated sanctions against Russia after the 2022 Ukraine invasion, the G7 uses economic tools to enforce geopolitical stability.
4. The G20’s Global Reach and Impact
The G20’s strength lies in its diversity and representation. It brings emerging powers into conversations once dominated by Western nations.
4.1 Post-2008 Financial Stability
The 2008 Global Financial Crisis was the G20’s defining moment.
When major economies were collapsing, the G20 coordinated massive fiscal stimulus packages worth trillions of dollars, stabilized banking systems, and reformed global financial regulations.
It was under G20 leadership that institutions like the Financial Stability Board (FSB) were strengthened to monitor systemic risks.
4.2 Promoting Sustainable Development
The G20 drives discussions on climate financing, green energy transitions, and digital inclusion.
Initiatives such as the G20 Compact with Africa and Sustainable Finance Working Group aim to ensure equitable growth across continents.
4.3 Bridging Inequality
Unlike the G7, the G20 focuses on reducing the global wealth gap.
By including countries like India, Brazil, Indonesia, and South Africa, it gives a voice to nations representing billions of people who were historically excluded from global economic governance.
5. G7 vs. G20: Cooperation or Competition?
While both groups aim for global stability, their roles and structures differ significantly:
Aspect G7 G20
Founded 1975 1999
Members 7 advanced economies 19 nations + EU
Focus Policy coordination among rich nations Global economic cooperation including emerging markets
GDP Share ~45% of global GDP ~85% of global GDP
Decision-Making Consensus-driven, smaller group Broader participation, slower decision-making
Representation Western-oriented Inclusive of Global South
Both groups, however, often coordinate behind the scenes. For instance, during the 2008 crisis, G7 finance ministers first met to frame the response, which was then expanded and executed through the G20.
This “division of labor” ensures speed, inclusiveness, and global legitimacy.
6. Influence on Global Markets and Trade
6.1 Currency and Monetary Policy
The G7 plays a key role in coordinating exchange rates and interest policies among major central banks (like the Fed, ECB, and BoJ).
Even subtle policy shifts discussed in G7 meetings can cause large movements in Forex markets and bond yields.
The G20, meanwhile, focuses on preventing “currency wars” — competitive devaluations that disrupt global trade balance.
6.2 Trade and Supply Chains
Both G7 and G20 promote free trade, but with modern twists.
Recent discussions revolve around “de-risking” supply chains from geopolitical tensions, especially between China and the West.
The G20 supports diversifying global manufacturing to countries like India, Vietnam, and Indonesia — reshaping global trade maps.
6.3 Energy and Climate
Energy security is now central to both groups.
The G7 is pushing for net-zero emissions by 2050, while the G20’s broader approach accommodates developing nations’ need for affordable energy transitions.
This balance affects global oil prices, carbon markets, and renewable energy investments.
7. Challenges Facing G7 and G20
7.1 Geopolitical Tensions
Disagreements over Russia’s invasion of Ukraine, the Israel–Gaza conflict, and the U.S.-China rivalry have often divided members.
The G20’s 2023 New Delhi Summit, for example, struggled to achieve consensus on language condemning wars — showing the complexity of managing global politics through economic platforms.
7.2 Economic Fragmentation
The rise of protectionism, trade barriers, and regional blocs (like BRICS) threatens the unity and influence of G7 and G20.
Emerging powers demand more representation and equitable policy decisions.
7.3 Climate and Digital Divide
While advanced economies focus on decarbonization, developing members emphasize growth and employment.
Bridging this gap — especially in AI, digital finance, and sustainability — will determine the future credibility of both groups.
8. The Future of Global Economic Governance
8.1 The G20 as the New Economic Parliament
With the global economy becoming multipolar, the G20 is expected to play a parliamentary role in global economic governance. It can balance Western dominance with Asian, African, and Latin American representation.
8.2 The G7’s Continued Relevance
Despite its smaller size, the G7 remains powerful due to its financial institutions, innovation leadership, and military alliances. Its policy influence, particularly through the IMF, World Bank, and WTO, continues to define market trends.
8.3 Synergy for Stability
Going forward, global challenges — from inflation to digital currency regulation — will require coordinated action. The ideal future would see the G7’s precision and resources combined with the G20’s inclusiveness and legitimacy.
9. G7 and G20 in the Indian Context
India’s growing global influence has made it a bridge nation between developed and developing worlds.
As G20 President in 2023, India emphasized digital inclusion, sustainable development, and debt relief for the Global South.
The creation of the India–Middle East–Europe Economic Corridor (IMEC) during the G20 Summit redefined strategic trade routes.
India’s balanced diplomacy between the West and BRICS has strengthened its position as a key player in shaping future global governance.
Conclusion: Steering the Global Market’s Destiny
The G7 and G20 together form the twin engines of the global economy.
The G7 provides the financial muscle and institutional leadership, while the G20 ensures diversity, representation, and inclusiveness.
In an era marked by economic volatility, climate urgency, and technological disruption, their coordination is more crucial than ever.
From setting global interest rates to shaping sustainable development goals, these groups influence every major decision that drives the global market.
The world’s economic future — whether stable or turbulent — will depend largely on how effectively the G7 and G20 collaborate to balance growth with equity, power with responsibility, and innovation with sustainability.


ETH- Quick LongETH $4400-4500 support zone, bullish momentum. I am long for a quick intra-week trade. Be cautious, stop loss tight. ETH could progress lower.

ETHUSD Approaching Highs, On-Chain Activity Shows CautionETHUSD is near its recent all-time high, with accumulation by large holders and institutions. Exchange balances have declined to multi-year lows. On-chain data shows daily active addresses increased in late Sep, while transaction volumes, protocol usage, and ETH burned have decreased, exposing near-term downside risk if network demand and burn rates do not recover.
ETHUSD rebounded from the ascending channel's lower bound at 3880 and closed above the Ichimoku Cloud. A break above the Fibonacci Confluence zone and 5000 psychological resistance may prompt further gains toward the 127.2% Fibonacci Extension at 6000. Conversely, a bearish breakout of the channel and close below the 3880 support may prompt a further decline to the following support at 3400.
By Li Xing Gan, Financial Markets Strategist Consultant to Exness

Ethereum Targets $4,800 as Bullish Trend Stays StrongHello everyone, Ethereum continues its impressive recovery, climbing from the $4,500 support area to trade near $4,677. The market structure remains bullish as institutional inflows strengthen and investor sentiment turns optimistic again.
On the 4-hour chart, ETH/USD maintains a steady upward pattern. The $4,500 zone acts as a solid foundation where buyers consistently defend. Immediate resistance sits around $4,730 — once cleared, Ethereum could extend toward $4,800 and possibly $5,000. The previous Fair Value Gaps have already been filled, showing a strong accumulation base before any new breakout.
From a fundamental view, inflows from institutional investors and the momentum surrounding Ethereum staking ETFs like Grayscale’s continue to boost demand. The on-chain activity in DeFi and Layer 2 ecosystems further supports the case for continued strength in ETH.
Overall, as long as the price holds above $4,500, the bullish bias remains intact with a clear path toward $4,800. Only a break below $4,500 could trigger a short-term pullback toward $4,420 before recovery resumes.
So, what do you think — will ETH hit $4,800 this week?

ETH/USD 4H SetupETH/USD 4H Setup ⚡️
Price tapped key support near $4,450 and showing early reaction.
Watching for a potential bounce toward $4,750–$4,760 (CRTH Target).
Stay sharp — liquidity sweep might fuel the next move. 🚀
Greetings,
MrYounity

What you want is not relevant $ETH Throw away your whole thesis you had on $eth. Whatever your short term price prediction was - forget it. If you had a Macro overview on what you thought CRYPTOCAP:ETH was going to just remember - It does not matter. CRYPTOCAP:ETH is going to 13k. Have a wonderful week. Just remember. Regardless of your research, Backtesting, Stock2flow models. Eth will go to 13k. Bless
