ETHUSD Daily Resistance Zone, Holding a short positionStrong rejection from resistance, holding shorts break even,,, if the trend reverse up. I will reverse positions,,
Trade ideas

Eth is ready to fallEth is ready to fall, eth is forming head and shoulder pattern and ready to fall in short term

Dejavu Ethereum Version.Same setup, same rhythm, just a different cycle.
The 2020 ETH chart is progressing almost identically to 2025.
The September low, followed by the October start and then that mega run.
The upcoming period will mark the beginning of a new era.
CRYPTOCAP:ETH 🔃

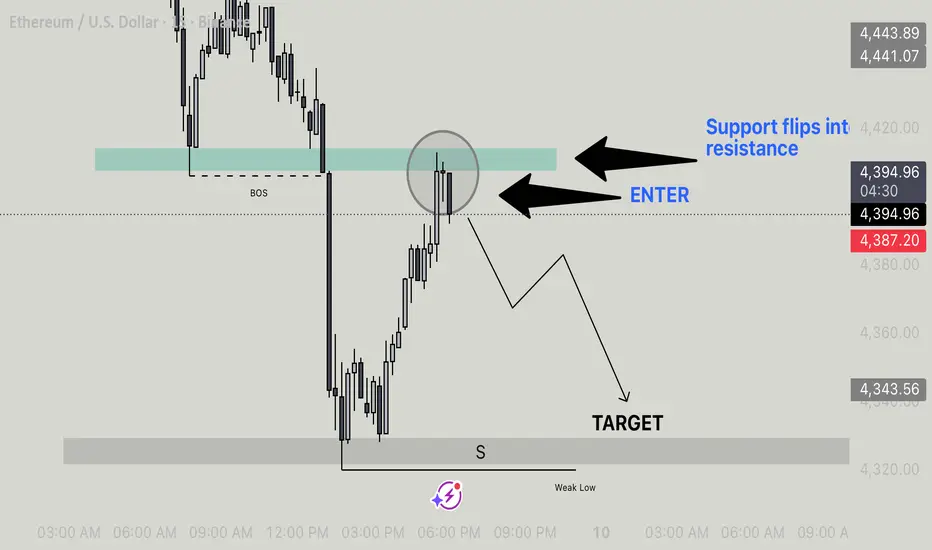
EthUsd - Break And Retest Short SetupKey Structure Areas:
Previous Support Zone (highlighted in green) is now acting as resistance.
Break of Structure (BOS) indicates a shift in market direction from bullish to bearish.
Target Zone marked near a prior weak low / support (S) zone.
Setup Explanation:
Break of Structure (BOS):
Price breaks below the previously strong support zone.
Signals bearish momentum and a potential trend reversal.
Retest of Support as Resistance:
After the BOS, price pulls back into the old support zone.
This zone now acts as resistance, confirming the change in polarity.
Entry Point:
The ideal entry is marked at the retest level within the resistance zone.
Candlestick reaction (e.g., rejections or wicks) confirms seller strength.
Target Area:
The target is the weak low marked with an “S” — a previous swing low that may now be liquidated or swept.
This gives a favorable risk-to-reward ratio for a short trade.
Key Trading Concepts Used:
Market Structure: BOS identifies trend change.
Support/Resistance Flip: A classic and reliable trading concept.
Liquidity Sweep Target: Going for the weak low assumes it will be tested or broken.
Potential Trade Summary:
Direction: Short / Sell
Entry: ~$4,397 (at retest of resistance zone)
Target: ~$4,343 or lower
Stop-loss: Above the resistance zone (around $4,420)
Ethereum broke below the key $4,500 levelEthereum broke below the key $4,500 level
Market Overview
Altcoins appear poised for a significant breakout as market dominance gradually shifts away from Bitcoin. The Altseason Index continues to rise, signaling that a broader altcoin rally may be approaching once again.
Ethereum Market Update
Ethereum (ETH) has declined by 3.6% in the past 24 hours, breaking below the key $4,500 level. Despite this drop, current metrics suggest the move is part of a healthy market correction rather than a structural breakdown.
The correction has triggered notable withdrawals from staking pools, reflecting temporary uncertainty among holders seeking to realize profits.
Technically, ETH has tested local support at $4,330 and is showing early signs of stabilization. The RSI is near oversold territory, suggesting that selling pressure may be easing. If the price holds above this support, a potential rebound toward the $4,500–$4,760 resistance zone could follow. However, a close below $4,330 might expose ETH to deeper retracements.
Development & Ecosystem News
Ethereum co-founder Vitalik Buterin has voiced support for Kohaku’s zk-based privacy roadmap, calling it a positive step toward strengthening privacy and security across the Ethereum ecosystem.
In a post on X, Buterin emphasized that achieving full-stack privacy and data protection remains one of Ethereum’s core objectives.
Kohaku — a fork of Ambire — integrates zk-based protocols such as Railgun, designed to reduce on-chain transparency risks and encourage privacy-first wallet development. A working prototype of Kohaku will be showcased at the upcoming Ethereum Foundation Devcon, and its open-source codebase will be available for developers worldwide to build upon.

Ethereum in my mindFollowing those days ETH seems bullish in daily candels but could be that we revisit the $4,000 for the reversal trigger on a long opportunity targeting $,4,750, but first we need to hold above the $4,500 for the coming days.
But still we need to wait for a confirmation to be sure before joining a position.

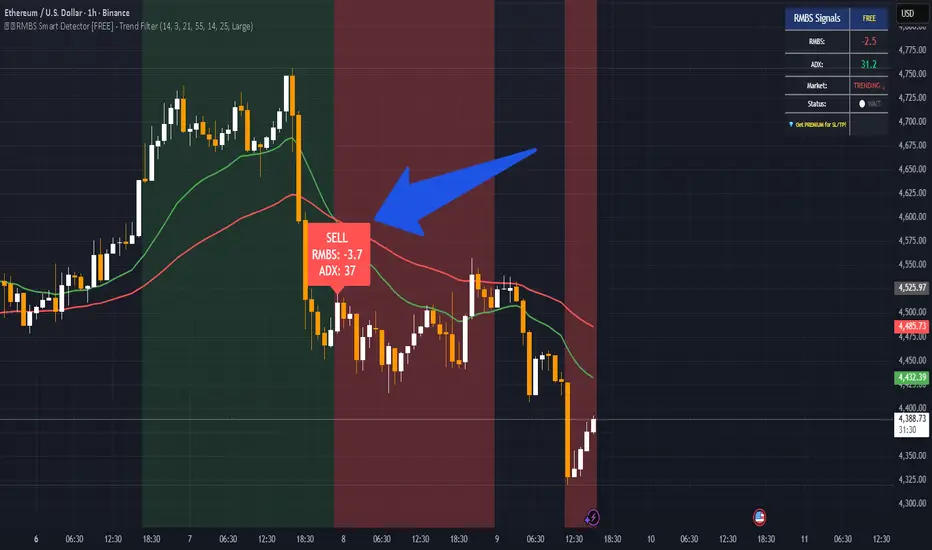
Technical Analysis of a SELL Trigger – RMBS Smart Detectorthe RMBS Smart Detector identified a bearish trigger under the following conditions:
RMBS value: ‑3.7
ADX: 37 (indicating a strong trend)
Bearish crossover between short‑term and long‑term moving averages
Market structure shifting into a downtrend with previous support levels breaking
This breakdown is for educational purposes only — it explains the technical reasoning behind the bearish trigger as well as the market context at the time.
It does not provide trade recommendations or promise any specific outcome.
🔍 You can explore and try the " RMBS Smart Detector " script directly from my TradingView profile – available in the “Scripts” section.
inverse head and shoulder buildingi dont see the problem?
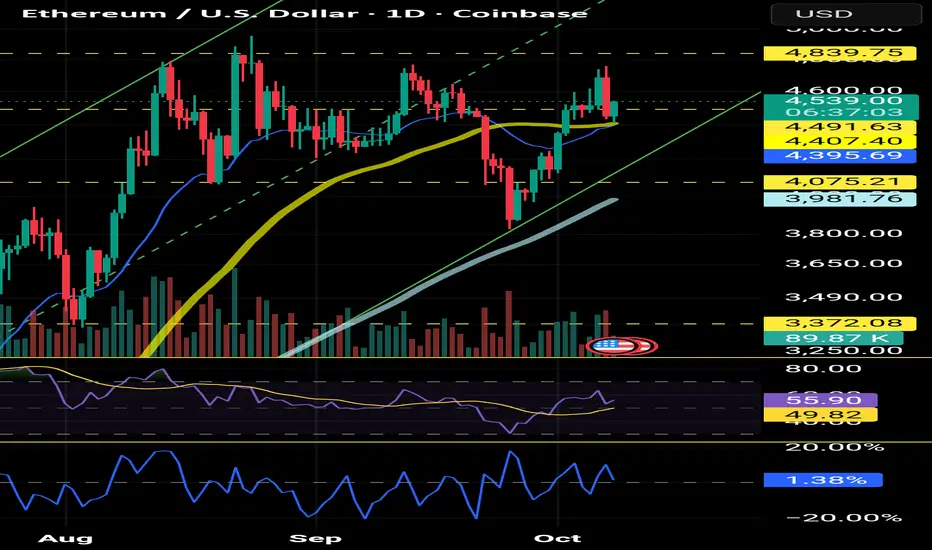
ethereum has hit the long term channel bottom that been lasting since april on 25 sept $3840.
After hitting this bottom ethereum has rallyed 24%.
now ethereum is taking a breath of that rally and is nearing the $4276 support zone wich is also the 0.5fib zone.
i expect ethereum to find support here or a little above as we are in the golden fib zone.
even if the 0.5 fib zone does not hold we still have the 0.61 fib zone wich is also at the bottom of the channel again.
if we find support at the 4260 zone we are also at the bottom of the left shoulder of the inverse head and shoulders forming.
if we reverse there we are looking at another jump back to the 4750 zone and then watching for a inverse head and shoulders breakout wich has a target of psychological level $6000

Of course. Here is a technical analysis of Ethereum (ETH) in EngOf course. Here is a technical analysis of Ethereum (ETH) in English:
Ethereum is currently consolidating at a critical technical juncture. On the daily chart, the price has been contained within a $3,400 to $3,750 range, forming a tightening pattern that often precedes a significant volatility expansion.
Key moving averages are clustered tightly. The 30-day EMA (around $3,550**) and the 60-day EMA (around **$3,520) are providing a dynamic equilibrium point, but their convergence indicates a lack of strong directional momentum. The MACD histogram is flatlining near zero, with its lines intertwined, reflecting a market in perfect balance. The RSI is neutral, oscillating in the mid-40s to mid-50s, showing neither overbought nor oversold conditions.
The immediate and crucial resistance is the range high at $3,750**; a decisive break above this level could trigger a rally towards the key psychological barrier of **$4,000. On the downside, the $3,400** level is paramount, acting as both a psychological and a technical support, closely aligned with the 100-day moving average. A breakdown below this support could open a path toward **$3,200.
Volume has been conspicuously low during this consolidation, underscoring market indecision. The current setup is a classic springboard, coiled for a directional move. Traders should wait for a confirmed breakout with increasing volume before committing to a significant position.

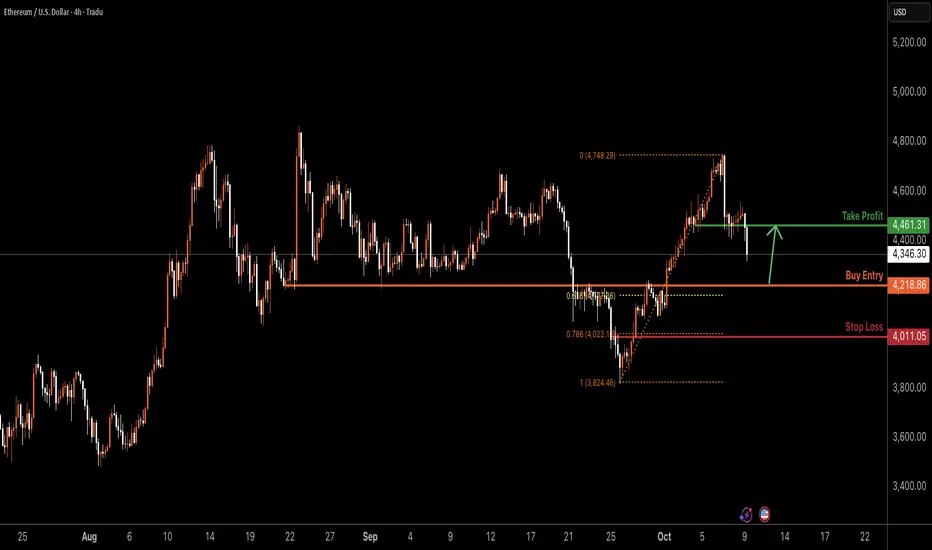
ETHUSD H4 | Bullish Reversal at Key SupportETH/USD is falling towards the buy entry at 4,218.86, which is an overlap support that is slightly above the 61.8% Fibonacci retracement and could bounce from this level ot the upside.
Stop loss is at 4,011.05, which is a pullback support that aligns with the 78.6% Fibonacci retracement.
Take profit is at 4,461.31, which is a pullback resistance.
High Risk Investment Warning
Trading Forex/CFDs on margin carries a high level of risk and may not be suitable for all investors. Leverage can work against you.
Stratos Markets Limited (tradu.com ):
CFDs are complex instruments and come with a high risk of losing money rapidly due to leverage. 65% of retail investor accounts lose money when trading CFDs with this provider. You should consider whether you understand how CFDs work and whether you can afford to take the high risk of losing your money.
Stratos Europe Ltd (tradu.com ):
CFDs are complex instruments and come with a high risk of losing money rapidly due to leverage. 66% of retail investor accounts lose money when trading CFDs with this provider. You should consider whether you understand how CFDs work and whether you can afford to take the high risk of losing your money.
Stratos Global LLC (tradu.com ):
Losses can exceed deposits.
Please be advised that the information presented on TradingView is provided to Tradu (‘Company’, ‘we’) by a third-party provider (‘TFA Global Pte Ltd’). Please be reminded that you are solely responsible for the trading decisions on your account. There is a very high degree of risk involved in trading. Any information and/or content is intended entirely for research, educational and informational purposes only and does not constitute investment or consultation advice or investment strategy. The information is not tailored to the investment needs of any specific person and therefore does not involve a consideration of any of the investment objectives, financial situation or needs of any viewer that may receive it. Kindly also note that past performance is not a reliable indicator of future results. Actual results may differ materially from those anticipated in forward-looking or past performance statements. We assume no liability as to the accuracy or completeness of any of the information and/or content provided herein and the Company cannot be held responsible for any omission, mistake nor for any loss or damage including without limitation to any loss of profit which may arise from reliance on any information supplied by TFA Global Pte Ltd.
The speaker(s) is neither an employee, agent nor representative of Tradu and is therefore acting independently. The opinions given are their own, constitute general market commentary, and do not constitute the opinion or advice of Tradu or any form of personal or investment advice. Tradu neither endorses nor guarantees offerings of third-party speakers, nor is Tradu responsible for the content, veracity or opinions of third-party speakers, presenters or participants.
ETH FORMED A DOUBLE TOP!COINBASE:ETHUSD eth forming a double top . If we dont see any pullback next stop is 4200.
NOTE: Im not any pro or guru. just sharing my thoughts .

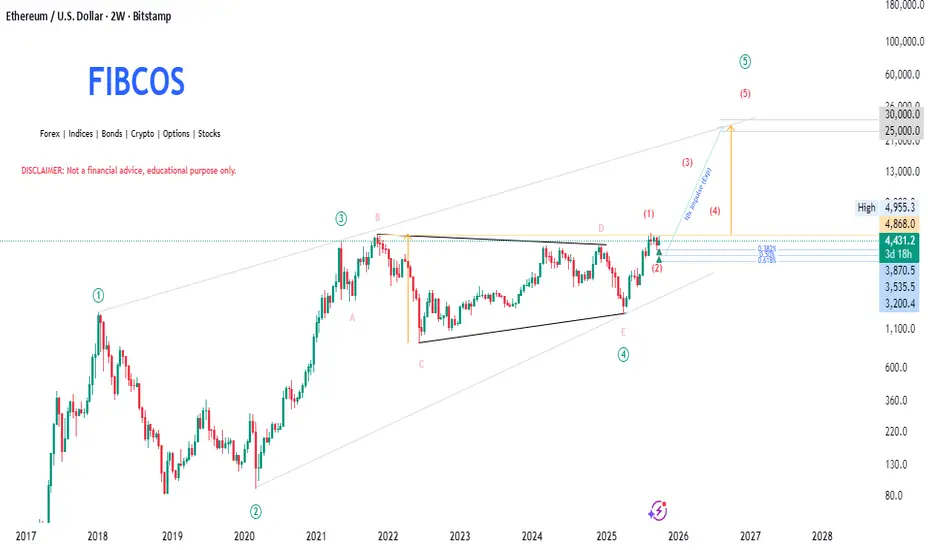
Ethereum(ETH) - Macro Outlook by FIBCOS🔍 Ethereum - Macro Outlook by FIBCOS 🧠
“From Contraction to Expansion – The Supercycle Awakens”
🌌 Super Market Cycle: The Final Push Begins
Ethereum is in the final stage of a Grand Supercycle 🌍 — a massive multi-year wave count aligning with the Elliott Wave Theory .
✅ Wave (1) and (2) established early strength
✅ Wave (3) peaked explosively in 2021 📈
✅ Wave (4) formed a beautiful contracting triangle (ABCDE) , a classic wave 4 corrective pattern
🟢 Now breaking out of Wave (4), we're entering Wave (5) — the euphoric leg 🚀
🌊 Wave Theory Magic: Riding the Impulse
We're deep into the impulsive sequence — and here's what stands out:
1️⃣ Wave (1) initiated the reversal from the triangle bottom
2️⃣ Wave (2) retraced perfectly to key Fib levels — golden pocket zone ✨
3️⃣ Current move is Wave (3) of (5) — historically the most powerful and extended wave 💥
🔮 Wave (5) targets extend toward $25,000–$30,000 based on Fibonacci projections 🧭
📐 Fibonacci Retracement & Extension: Precision Tools
After Wave (1), ETH retraced to the following golden zones:
🔵 0.382 – $3,870
🟣 0.50 – $3,535
🟢 0.618 – $3,200
These levels acted as strong demand zones 🛡️, where price was absorbed and reversed, showing institutional interest.
📈 For extensions:
Wave (3) targets: ~$15,000 (1.618 extension)
Wave (5) projection: $25K–$30K 🎯
🧠 Smart Money Concept (SMC): Liquidity Engineered Setup
SMC confirms the big players have already positioned:
🪤 ABCDE triangle = liquidity trap
🔥 Wave E = final sweep before the breakout
✅ Structure Break = Smart Money entry signal
🧱 Demand Zone @ ~$3,800–$4,200 = institutional orders filling 🏦
The Change of Character (ChoCH) + Break of Structure (BoS) = textbook confirmation of bullish intent 📚
🧱 Market Structure: From Consolidation to Expansion
We’ve broken multi-year resistance 💥
🔁 Previous All-Time High (ATH) now acting as strong support
📈 Higher highs and higher lows = full bullish market structure
🚀 Confirmed trend shift after accumulation → expansion phase
🔎 Price Action: Clean, Convincing, Bullish
The breakout candle is powerful:
✅ Big-bodied green candles
✅ Little-to-no upper wick = aggressive buyers in control 🐂
✅ Imbalance created below — potential “buy-the-dip” zones between $3,800–$4,200 📉🛒
ETH is now printing strength with every candle — the market is speaking clearly.
🌍 Macro-Fundamental Context – Ethereum’s Underlying Strengths
Ethereum’s fundamentals provide strong structural support for this technical forecast:
ETH ETF Approvals (Pending):
U.S. and global ETF prospects are building momentum, opening gates to institutional inflows akin to Bitcoin's ETF impact.
Layer-2 Scaling Adoption:
Networks like Arbitrum, Optimism, and zkSync are maturing rapidly, improving transaction efficiency and reducing on-chain congestion.
Ethereum 2.0 Transition/PoS Era:
Ongoing deflationary tokenomics (EIP-1559 burn + staking lock-up) are reducing effective circulating supply, supporting price growth.
DeFi Revival:
With macro liquidity cycles turning upward, usage and TVL (Total Value Locked) in Ethereum-based DeFi is expected to rise sharply.
AI x Blockchain Synergy:
Ethereum remains positioned to become the base layer for decentralized AI infrastructure — a potential catalyst for long-term valuation expansion.
These catalysts serve as the fundamental “fuel” behind the unfolding Wave (3) and the eventual Wave (5) .
🎯 Final Word: All Systems GO 🚀
The confluence is undeniable:
✅ Super Cycle 🔁
✅ Elliott Wave 📊
✅ SMC Smart Money 📈
✅ Price Action 🔍
✅ Market Structure 🏗️
✅ Fibonacci Levels 📏
✅ Fundamentals 🌍
💡 Ethereum is positioned to explode into its Wave (5) super-cycle with $30,000 as a potential macro target.
If you're looking for the high time frame narrative , this is as strong as it gets . Don’t chase. Plan the entry on retracements and ride the wave 🌊.
💬 "Structure unlocks direction, and Fibonacci refines destination." – FIBCOS
📘 Disclaimer: This is a structural, educational market outlook. Not financial advice. Please do your own due diligence and risk management.
#FIBCOS #ElliottWave #SmartMoneyConcept #MarketAnalysis #Gold #XAUUSD #ElliottWave #WaveTheory #SuperCycle #MacroTrend #SmartMoney #Fibonacci #PriceAction #Commodities #TechnicalAnalysis #LongTermOutlook
ETH is pushing down the chart is showing a strong sellers domination , either they trying to swipe as much liquidity as they can to aim for new hogh ; or is it the market finding a balance what's your opinion ?

ETH/USD: $6,000 at the End of the Cycle in Late 2025?While the debate over the timing of the end of the bullish cycle continues, Ether (ETH) has reached the 26th position worldwide ($540 billion USD) in the ranking of global market capitalizations across all asset classes. For comparison, gold ranks first at $27 trillion USD, and Bitcoin is in 7th place with $2.45 trillion USD.
Regarding Bitcoin’s price and the possible dates for the end of the bullish cycle linked to the 2024 halving, I invite you to click on the chart below. You’ll see that the end-of-cycle window lies between October 18 and November 20.
But let’s return to the focus of this analysis: Ethereum — specifically the ETH/USD price and a realistic price target for this cycle, taking into account its positive correlation with Bitcoin.
In this article, I will rely on chart analysis using weekly and daily timeframes, applying classical charting tools, Elliott Waves, and Fibonacci extension ratios.
1) According to the medium-term chart (Japanese candlesticks, weekly data), the underlying trend remains bullish above the $3,800 support.
The chart below shows that ETH/USD’s long-term trend remains bullish as long as the market price holds above a large triangular pattern that broke upward this summer. The primary trend is therefore bullish above the $3,800 support on a weekly closing basis.
The first chart below shows ETH/USD weekly Japanese candlesticks:
2) According to Elliott Wave analysis, the final end-of-cycle target could be $6,000 by late 2025.
On this Ethereum (ETH/USD) chart, Elliott Wave analysis shows a five-phase bullish structure, with Wave 5 yet to come. After the Wave 4 correction, the market appears to have found a bottom around $3,800 — an area corresponding to the 0.382 retracement of Wave 3. The current recovery suggests the potential start of the fifth impulsive wave.
The theoretical target for Wave 5 is around $6,000, corresponding to a 0.618 Fibonacci extension from the bottom of Wave 1 to the top of Wave 3, projected from Wave 4. This level also aligns with a major psychological zone and a classic target for the end of a full bullish cycle.
As long as the price stays above $3,800, this remains the most likely technical scenario.
The second chart below shows ETH/USD daily Japanese candlesticks:
DISCLAIMER:
This content is intended for individuals who are familiar with financial markets and instruments and is for information purposes only. The presented idea (including market commentary, market data and observations) is not a work product of any research department of Swissquote or its affiliates. This material is intended to highlight market action and does not constitute investment, legal or tax advice. If you are a retail investor or lack experience in trading complex financial products, it is advisable to seek professional advice from licensed advisor before making any financial decisions.
This content is not intended to manipulate the market or encourage any specific financial behavior.
Swissquote makes no representation or warranty as to the quality, completeness, accuracy, comprehensiveness or non-infringement of such content. The views expressed are those of the consultant and are provided for educational purposes only. Any information provided relating to a product or market should not be construed as recommending an investment strategy or transaction. Past performance is not a guarantee of future results.
Swissquote and its employees and representatives shall in no event be held liable for any damages or losses arising directly or indirectly from decisions made on the basis of this content.
The use of any third-party brands or trademarks is for information only and does not imply endorsement by Swissquote, or that the trademark owner has authorised Swissquote to promote its products or services.
Swissquote is the marketing brand for the activities of Swissquote Bank Ltd (Switzerland) regulated by FINMA, Swissquote Capital Markets Limited regulated by CySEC (Cyprus), Swissquote Bank Europe SA (Luxembourg) regulated by the CSSF, Swissquote Ltd (UK) regulated by the FCA, Swissquote Financial Services (Malta) Ltd regulated by the Malta Financial Services Authority, Swissquote MEA Ltd. (UAE) regulated by the Dubai Financial Services Authority, Swissquote Pte Ltd (Singapore) regulated by the Monetary Authority of Singapore, Swissquote Asia Limited (Hong Kong) licensed by the Hong Kong Securities and Futures Commission (SFC) and Swissquote South Africa (Pty) Ltd supervised by the FSCA.
Products and services of Swissquote are only intended for those permitted to receive them under local law.
All investments carry a degree of risk. The risk of loss in trading or holding financial instruments can be substantial. The value of financial instruments, including but not limited to stocks, bonds, cryptocurrencies, and other assets, can fluctuate both upwards and downwards. There is a significant risk of financial loss when buying, selling, holding, staking, or investing in these instruments. SQBE makes no recommendations regarding any specific investment, transaction, or the use of any particular investment strategy.
CFDs are complex instruments and come with a high risk of losing money rapidly due to leverage. The vast majority of retail client accounts suffer capital losses when trading in CFDs. You should consider whether you understand how CFDs work and whether you can afford to take the high risk of losing your money.
Digital Assets are unregulated in most countries and consumer protection rules may not apply. As highly volatile speculative investments, Digital Assets are not suitable for investors without a high-risk tolerance. Make sure you understand each Digital Asset before you trade.
Cryptocurrencies are not considered legal tender in some jurisdictions and are subject to regulatory uncertainties.
The use of Internet-based systems can involve high risks, including, but not limited to, fraud, cyber-attacks, network and communication failures, as well as identity theft and phishing attacks related to crypto-assets.

Fakeout, now breakout.Rejected the top resistance fell, then broke.. only up from here. Target potential between nov 11 to December 11.. minimum 11,500..

ETHEREUM Free Signal! Buy!
Hello,Traders!
ETHEREUM rebounds from the horizontal demand area, confirming Smart Money accumulation within discount territory. Liquidity has been swept below recent lows, opening the way for expansion toward 4,659$ as inefficiency gets filled.
-------------------
Stop Loss: 4,406$
Take Profit: 4,659$
Entry: 4,531$
Time Frame: 4H
-------------------
Buy!
Comment and subscribe to help us grow!
Check out other forecasts below too!
Disclosure: I am part of Trade Nation's Influencer program and receive a monthly fee for using their TradingView charts in my analysis.

ETHUSD 1H – Bulls Gaining StrengthBITSTAMP:ETHUSD
📊 🚀
Structure | Trend | Key Reaction Zones
ETH retested the strong demand zone (4400–4450) and showed a clear bullish reaction, reclaiming short-term structure with higher lows forming.
Market Overview
After the sharp rejection from the 4750 resistance zone, ETH entered accumulation and tapped the key demand box. Price is now showing momentum recovery with bullish candles breaking back above the 4500 level, indicating potential continuation toward upper resistance levels.
Key Scenarios
✅ Bullish Case 🚀 → 🎯 Target 1: 4620 | 🎯 Target 2: 4670 | 🎯 Target 3: 4750
❌ Bearish Case 📉 → Break below 4450 may shift bias back toward 4400.
Current Levels to Watch
Resistance 🔴: 4620 – 4670 – 4750
Support 🟢: 4450 – 4400
⚠️ Disclaimer: This analysis is for educational purposes only. Not financial advice.

Retested 21 ema and 50dma Ethereum has retested the breakout of the 50dma and the 21ema.
next stop is above ATH
ETHUSD – 1H | Bullish Reversal from Demand ZoneBITSTAMP:ETHUSD
Structure | Trend | Key Reaction Zones
Market retested the 4,440–4,465 strong demand zone, respecting structure after a deep liquidity sweep.
Overall structure remains bullish, with previous accumulation and breakout zones aligning with channel support.
Market Overview
ETH completed a sharp correction after facing rejection near 4,758 resistance, tapping into the demand base where buyers previously stepped in. With liquidity cleared and demand reaction visible, a bullish continuation is likely if price holds above 4,465.
Key Scenarios
✅ Bullish Case 🚀 →
🎯 Target 1: 4,535
🎯 Target 2: 4,621
🎯 Target 3: 4,672 (major resistance retest)
❌ Bearish Case 📉 →
Invalidation below 4,413 (break of demand zone).
Current Levels to Watch
Resistance 🔴: 4,621 / 4,672
Support 🟢: 4,465 / 4,413
⚠️ Disclaimer: This analysis is for educational purposes only. Not financial advice.

ETH: 4500 - The Crucial Flip
ETH: 4500 - The Crucial Flip
Ethereum (ETHUSD) on the 4-hour timeframe is currently undergoing a retracement from recent highs, testing the crucial "4500 Flip Zone" and the dynamic ascending trendline, with price at ap-proximately 4,476.
Bullish Scenario: A successful defense of the "4500 Flip Zone" and the trendline, leading to a bounce, would indicate a continuation of the upward trend, targeting the 4650 resistance and subsequently the "4800 to 4900 Sell Order Block."
Bearish Scenario (Immediate): Conversely, a confirmed breach and sustained trading below the "4500 Flip Zone" and the trendline would signal a weakening of the bullish structure, likely leading to a retest of the "4200 to 4300 Key Level."
Bearish Scenario (Deeper): Should the "4200 to 4300 Key Level" fail to hold, deeper support levels at "4000" would become the next significant areas to watch for potential buying interest.
Disclaimer:
The information provided in this chart is for educational and informational purposes only and should not be considered as investment advice. Trading and investing involve substantial risk and are not suitable for every investor. You should carefully consider your financial situation and consult with a financial advisor before making any investment decisions. The creator of this chart does not guarantee any specific outcome or profit and is not responsible for any losses incurred as a result of using this information. Past performance is not indicative of future results. Use this information at your own risk. This chart has been created for my own improvement in Trading and Investment Analysis. Please do your own analysis before any investments.

EthereumETHUSD
- RSI - Divergence
- Order Block
- Demand Zone
- Fibonacci Level - 38.20%
- Completed " 1234 " Impulsive Waves

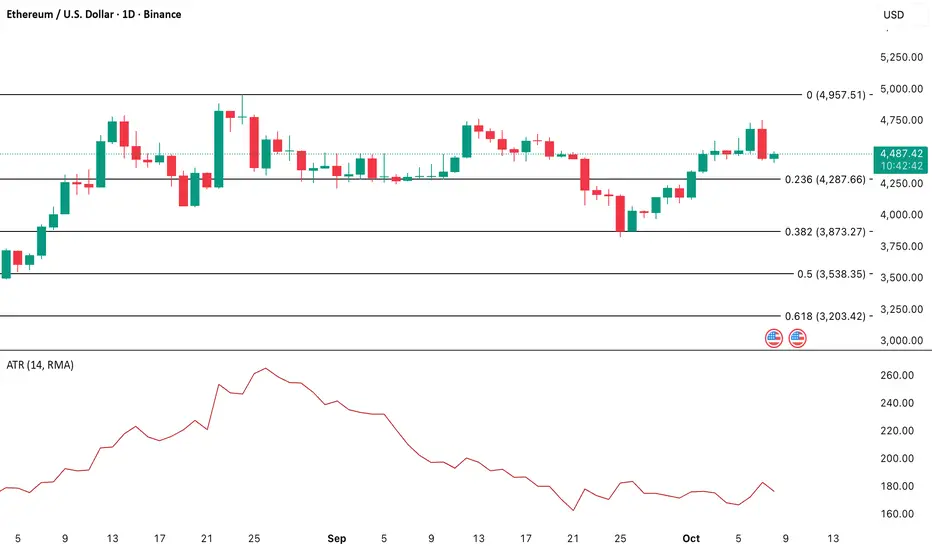
Ethereum Price Consolidates as Volatility FadesEthereum (ETH) is currently moving sideways, trading within a tight range. The one-day chart shows a clear decline in market volatility, reflecting a balance between buying and selling pressure.
The Average True Range (ATR), a key volatility indicator, has dropped to signaling reduced price swings and cautious market behavior. This decline in ATR highlights that traders are taking fewer risks, leading to smaller moves and lower trading activity.
Periods of compressed volatility like this often precede significant price moves. As ETH remains stuck in this narrow range, traders are watching closely for a potential breakout that could set the tone for the next major trend.
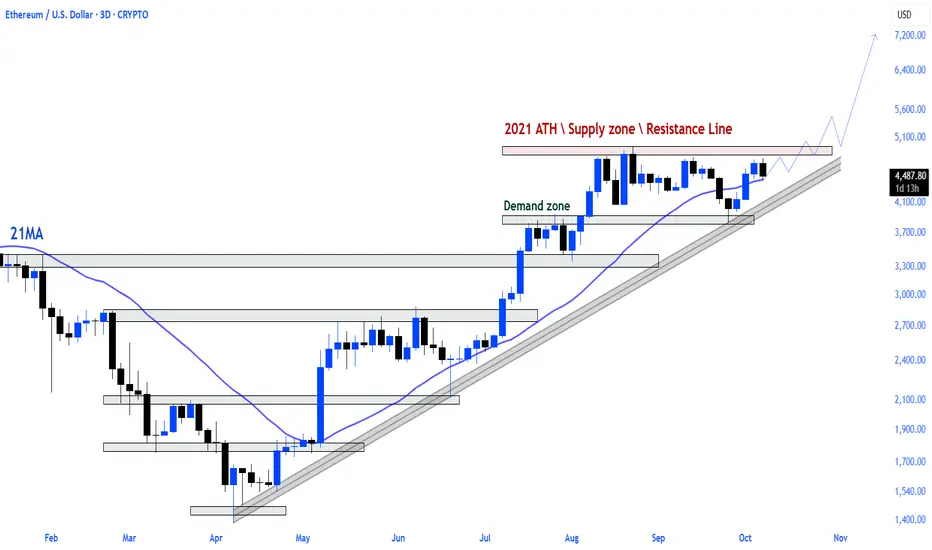
$ETH is pushing the critical threshold.Ethereum maintains its upward trend as it approaches the supply zone and major resistance line from its 2021 peak once again.
The price structure, backed by the 21MA support, shows that momentum remains upward with a strong series of higher lows.
A breakout from this region would mark a transition to a new parabolic phase for ETH.