ETHCRYPTOCAP:ETH remains within a descending channel pattern and is approaching the $3500 support level, likely for the final time in this cycle. Market structure suggests this could be the last shakeout before a major reversal. A breakout could accelerate toward $5000 sooner than expected.
Trade ideas

Ethereum is extremely bullish.TA view
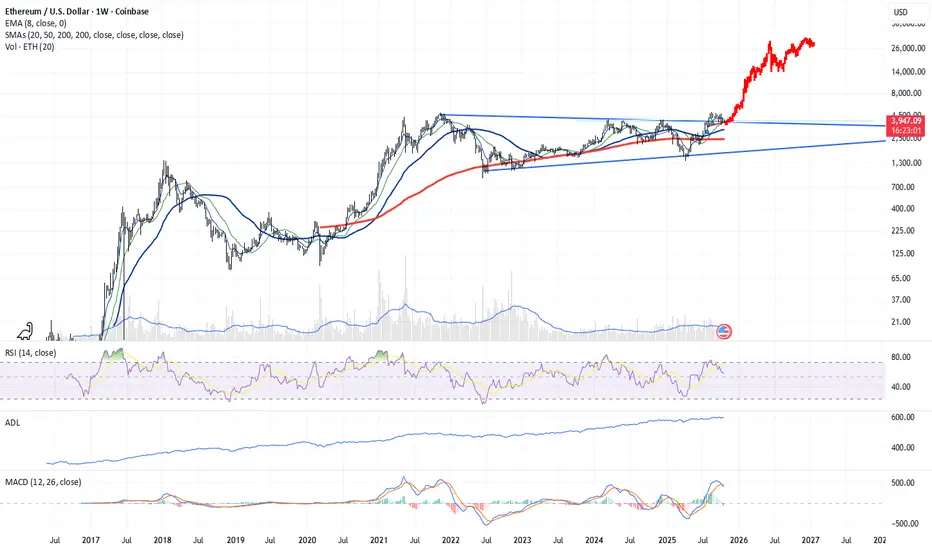
ETH successfully broke resistance in July and retested that line. The line is now holding perfectly as support. This line represents a huge symmetrical triangle, which is one of the most bullish patterns in TA, especially when followed by a confirmed retest.
The RSI has cooled down and is ready for the next move up, suggesting there is momentum room for a sustained rally.
Interestingly, the Advance/Decline Line is moving up while the ETH price is currently dropping, which is an extremely bullish divergence.
The MACD (Moving Average Convergence Divergence) is showing slight negativity, but it will "heal itself" as soon as the price starts moving up. It is possible that the move will be similar to 2021.
Macro Outlook
The End of the 4-Year cycle. The most important point is that the talk of a 4-year cycle is a lie; it does not exist. The current environment is different from 2021 and 2017. In 2017 and 2021, we had significant issues with the stock market, inflation, and rising interest rates; now, the opposite is true. Therefore, forget the 4-year cycle. Crypto will move like the stock market from now on, forever. People will finally accept this once Bitcoin (BTC) breaks its All-Time High (ATH) this year and definitively proves the cycle narrative is dead.
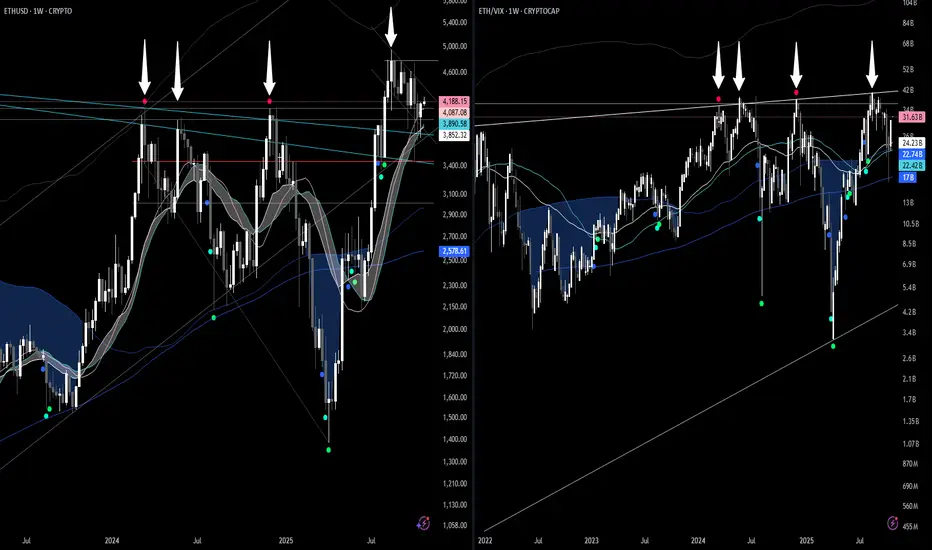
ETH and ETH/VIX Trend LineGoing to toss out a little free alpha for everyone... use the ETH/VIX ratio (works also for BTC and BTC/VIX ratio) to look for local tops. It has been 100% reliable this cycle. Likely will be accurate for the cycle top as well.
MAKE or BREAK for Ethereum: New ATH or Epic SHAKEOUT?This week is shaping up to be ABSOLUTELY CRUCIAL for ETHEREUM!
Low Exchange RESERVES are still drawing in investors like moths to a flame. But hold on—something feels OFF the table here.
The news is glaringly OBVIOUS to everyone: rate cuts, QE, trade deals, and all those technical factors screaming "bull run ahead." But in crypto, when EVERYONE knows something, it rarely plays out as expected. Contrarian vibes, anyone?
My gut is screaming: This will be a VOLATILE WEEK , and a SHAKEOUT is essential for a rock-solid BULL RUN in Ethereum during this cycle. Without it, hitting a new ALL-TIME HIGH could feel flimsy, leading to a HISTORICAL DUMP right after the hype fades.
Pro tip: Keep EXTRA MARGINS in your account to dodge those sneaky WHALE TRAPS.
Follow and like if this analysis fired you up! 🚀📉

UPCOMING NEW ALL TIME HIGH FOR ETH?I'm bullish with ETH!
1. As we can see in our TA, ETH is forming a bullflag in 1D time frame which is a very bullish pattern.
2. Are we going to a breakout in 9th wave?
We might see a bullish movement for ETH. Lets wait for more signals to come for us to support our technical analysis. Stay tuned! I'll be updating this technical analysis if we see more signal to come.
Lets go! Trade at your own risk and always do your own research!

ETHUSD: Bulls Are Winning! Long!
My dear friends,
Today we will analyse ETHUSD together☺️
The recent price action suggests a shift in mid-term momentum. A break above the current local range around 3,888.2 will confirm the new direction upwards with the target being the next key level of 3,903.0 and a reconvened placement of a stop-loss beyond the range.
❤️Sending you lots of Love and Hugs❤️

#ETH/USDT : Another Attempt To Resume Upward Movement
#ETH
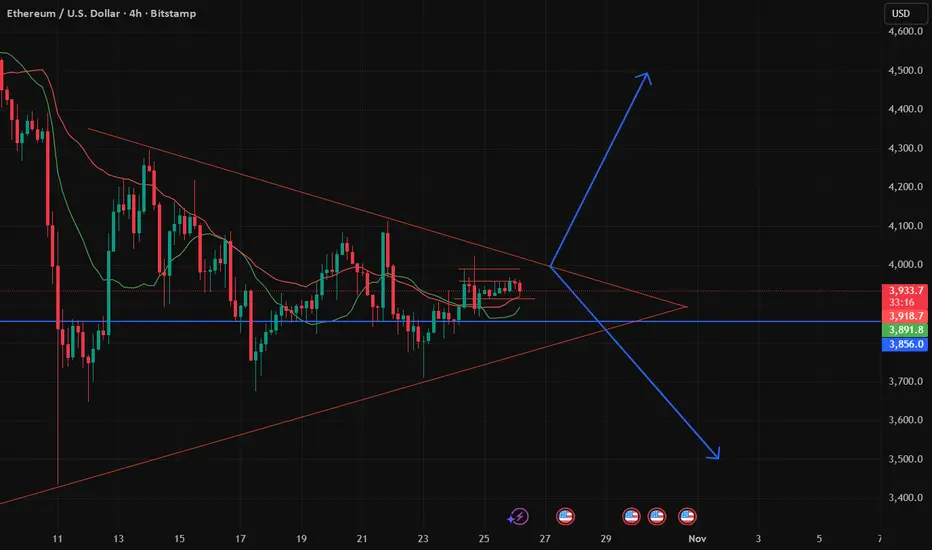
The price is moving within a descending channel on the 1-hour frame, adhering well to it, and is heading for a strong breakout and retest.
We have a bearish trend on the RSI indicator that is about to be broken and retested, which supports the upward breakout.
There is a major support area in green at 3826, which represents a strong support point.
We are heading for consolidation above the 100 moving average.
Entry price: 3831.
First target: 3920.
Second target: 3969.
Third target: 4200.
Don't forget a simple matter: capital management.
When you reach the first target, save some money and then change your stop-loss order to an entry order.
For inquiries, please leave a comment.
Thank you.

+40% CANDLE IN NOVEMBER FOR ETH!!!This is going to be the first of my two-part thesis on why I believe ETH is set up for a +40% rally in November. First, the fundamentals:
**FED RATE CUT TRAP:** It might be hard to notice we are in a rate cut cycle, as crypto prices seem to have ignored the core thesis that money is getting cheaper and assets should be worth more. Well, this isn’t the first time we’ve gone in the opposite direction in the middle of a rate cut cycle. Back in September 2024, the Fed cut rates by 50 bps, and the crypto market had a meh reaction to it. Another 25 bps cut was expected in early November and wasn’t priced in during October. ETH gained and lost roughly 3% in both months. Basically, my point is that the correlation between rates and crypto isn’t uncommon, but it’s usually an anomaly that never lasts. Some call it manipulation; I call it MARKET FORCES.
**WALL STREET IS BUILDING ON THE ETHEREUM NETWORK:** Ethereum has the largest share of tokenized assets. This only means there is strong demand for ETH beyond speculation. I believe dips should have been more painful if Wall Street wasn’t scooping up excess supply.
**ETH Pectra UPGRADE (formerly "Fukasa"):** Scheduled for early November 2025, Pectra combines Prague (execution) and Electra (consensus) upgrades which results in lower issuance, higher staking, and stronger institutional tooling.
Why +40% in November?
Timing Catalyst: The upgrade activates right after the U.S. election dust settles (Nov 5), giving the market a clean macro window to front-run the narrative.
Supply Shock: Pectra’s staking reforms are expected to push staking participation from ~28% to 35%+ within 60 days (per Lido/Figment forecasts), pulling ~2.5M ETH off exchanges. Combined with blob fee burns, issuance drops to its lowest post-Merge level.
The rate-cut “trap” was just the market mispricing cheaper capital; Pectra is the technical trigger that turns latent institutional balance sheets into aggressive ETH bids. November is when the flywheel spins.

Bullish reversal off major support?The Ethereum (ETH/USD) is reacting off the pivot and could bounce to the 1st resistance.
Pivot: 3,710/52
1st Support: 3,395.28
1st Resistance: 4,063.46
Disclaimer:
The above opinions given constitute general market commentary, and do not constitute the opinion or advice of IC Markets or any form of personal or investment advice.
Any opinions, news, research, analyses, prices, other information, or links to third-party sites contained on this website are provided on an "as-is" basis, are intended only to be informative, is not an advice nor a recommendation, nor research, or a record of our trading prices, or an offer of, or solicitation for a transaction in any financial instrument and thus should not be treated as such. The information provided does not involve any specific investment objectives, financial situation and needs of any specific person who may receive it. Please be aware, that past performance is not a reliable indicator of future performance and/or results. Past Performance or Forward-looking scenarios based upon the reasonable beliefs of the third-party provider are not a guarantee of future performance. Actual results may differ materially from those anticipated in forward-looking or past performance statements. IC Markets makes no representation or warranty and assumes no liability as to the accuracy or completeness of the information provided, nor any loss arising from any investment based on a recommendation, forecast or any information supplied by any third-party.

ETH/USD — Ethereum Holds Key Support, Bears Still in ControlEthereum (ETH/USD) remains within a medium-term downtrend, consolidating after testing the 3,750 zone (Murray level ) near the lower boundary of the descending channel last week. Despite multiple attempts, bears failed to push the price lower, leading to a rebound and short-term stabilization.
Currently, ETH is trading above 3,962.50 (Murray level , 23.6% Fibonacci retracement), supported by the middle Bollinger Band. However, confirmation of a trend reversal would only come if the price secures a breakout above 4,375.00 (Murray level ) — a move that would also break the upper boundary of the descending channel and open the path toward 5,000.00 (Murray level ) and 5,625.00 (Murray level ).
On the downside, the key bearish level remains 3,750.00; a break below it could accelerate the decline toward 3,125.00 (Murray level , 50.0% Fibonacci retracement) and 2,500.00 (Murray level ).
⸻
Technical Setup
• Bollinger Bands are turning downward, reflecting a continuation of bearish pressure.
• MACD remains in negative territory, though its histogram is flattening — suggesting short-term consolidation.
• Stochastic has entered the overbought zone and is starting to turn down, hinting at a potential pullback.
Resistance levels: 4,375 — 5,000 — 5,625
Support levels: 3,750 — 3,125 — 2,500
⸻
Trading Plan
Primary Scenario (Sell Stop)
• Entry: 3,749.95
• Take Profit: 3,125 / 2,500
• Stop Loss: 4,075
• Bias: Bearish below 3,750
• Timeframe: Weekly
Alternative Scenario (Buy Stop)
• Entry: 4,375.05
• Take Profit: 5,000 / 5,625
• Stop Loss: 3,960
• Bias: Bullish above 4,375
⸻
💬 ETH/USD continues to trade under medium-term pressure. A breakout above 4,375 would shift sentiment bullish, while a move below 3,750 opens the door to deeper correction targets near 3,125 and 2,500.

Potential bearish drop off?Ethereum (ETH/USD) has rejected off the pivot, which is an overlap resistance and could drop to the 1st support.
Pivot: 4,263.96
1st Support: 3,938.73
1st Resistance: 4,455.38
Disclaimer:
The above opinions given constitute general market commentary, and do not constitute the opinion or advice of IC Markets or any form of personal or investment advice.
Any opinions, news, research, analyses, prices, other information, or links to third-party sites contained on this website are provided on an "as-is" basis, are intended only to be informative, is not an advice nor a recommendation, nor research, or a record of our trading prices, or an offer of, or solicitation for a transaction in any financial instrument and thus should not be treated as such. The information provided does not involve any specific investment objectives, financial situation and needs of any specific person who may receive it. Please be aware, that past performance is not a reliable indicator of future performance and/or results. Past Performance or Forward-looking scenarios based upon the reasonable beliefs of the third-party provider are not a guarantee of future performance. Actual results may differ materially from those anticipated in forward-looking or past performance statements. IC Markets makes no representation or warranty and assumes no liability as to the accuracy or completeness of the information provided, nor any loss arising from any investment based on a recommendation, forecast or any information supplied by any third-party.

ETH ShortMirroring my BTC analysis I see support clearly broken with consolidation below support showing its getting ready for the next leg down. Short ETH with little risk right now. Smart money is selling

Potential bearish drop off?Ethereum (ETH/USD) has rejected off the pivot and could drop to the multi swing low support.
Pivot: 3,934.93
1st Support: 3,691.52
1st Resistance: 4,093.31
Disclaimer:
The above opinions given constitute general market commentary, and do not constitute the opinion or advice of IC Markets or any form of personal or investment advice.
Any opinions, news, research, analyses, prices, other information, or links to third-party sites contained on this website are provided on an "as-is" basis, are intended only to be informative, is not an advice nor a recommendation, nor research, or a record of our trading prices, or an offer of, or solicitation for a transaction in any financial instrument and thus should not be treated as such. The information provided does not involve any specific investment objectives, financial situation and needs of any specific person who may receive it. Please be aware, that past performance is not a reliable indicator of future performance and/or results. Past Performance or Forward-looking scenarios based upon the reasonable beliefs of the third-party provider are not a guarantee of future performance. Actual results may differ materially from those anticipated in forward-looking or past performance statements. IC Markets makes no representation or warranty and assumes no liability as to the accuracy or completeness of the information provided, nor any loss arising from any investment based on a recommendation, forecast or any information supplied by any third-party.

Quantum computing will kill cryptoNo US administration has been so pro-crypto.No US administration has been so pro-crypto. Historically, Ether rallies are 5,000 percent: 50 x 1,500 = £75,000.

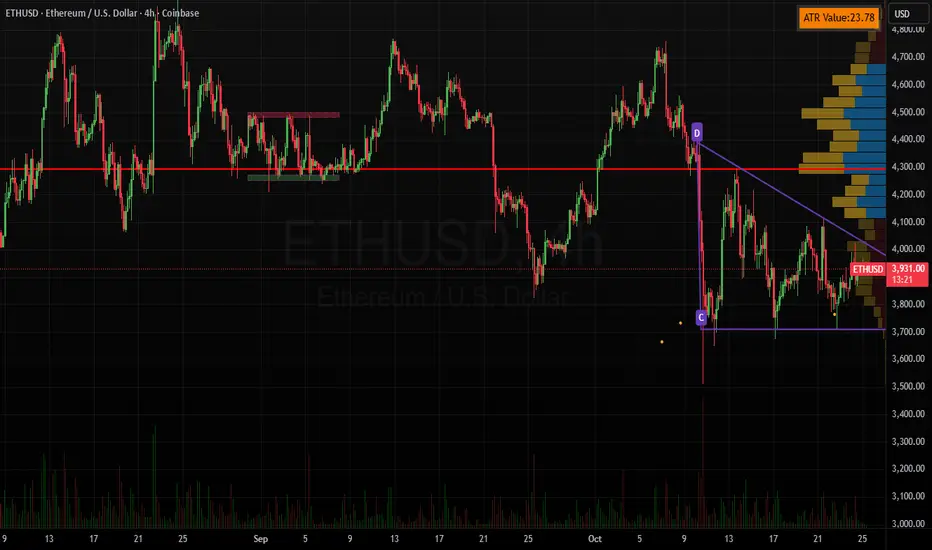
Eth Short :: ETF Outflows / DAT RiskETH is in a descending triangle on the 4 hour chart which is a bearish pattern.
A few other factors outside of price action that suggest a possible correction:
Net weekly ETF outflows. -63k ETH last week.
Potential multi-year double top playing out but that won't be invalidated until price falls below $1,000ish which is highly unlikely.
ETH validator exit queue at record high level of 43 days with roughly 25 million ETH queued to exit staking. Not all is likely to be sold, but the record exodus can't be bullish. www.validatorqueue.com
Proliferation of Digital Asset Treasuries (DATs) that add very little value to the ecosystem to justify a premium over readily available ETFs. Given the recent decline in ETH price, many are now trading at a discount to NAV. This creates the potential for a negative spiral by forcing sales of assets which adds further pressure to others. Tom Lee who has a vested interest in DAT success said the DAT bubble has started to pop (DAT bubble..not specifically ETH). This by far is the biggest risk to the space. It may take some time to materialize but if it does, I suspect that it will be unwind rapidly.
There are many incredibly bullish counterarguments that could easily take this back up quickly, so this idea will be invalidated when the upper trend line is broken on volume.
My long-term view is bullish but there is a lot of hype and excess in the space that periodically needs to be cleared out. If the descending triangle plays out, we could see another ~20% drop to the $3,000 range.
I am already short but the more cautious approach is to wait until the lower support is broken on volume.
ETHUSDWait for ETH to reach 4085 (entry trigger).
If it does, the short position opens automatically.
If price falls to 4025, trade closes in profit.
If price rises to 4148, trade closes in loss.

Final Push into the 24MA weekly This could be the final Push into the 24MA before we slingshot higher. Time will tell first target should be 6500ish

Ethereum (ETH) — Symmetrical Triangle Formation1. Validity of the pattern
A symmetrical triangle is a neutral continuation (or sometimes reversal) pattern: price makes lower highs and higher lows, squeezing into the apex.
Important for you: verify that each “touch” of the trendlines is clean (price reacts at the lines, shows rejection or bounce) — this gives the pattern structural credibility.
On the chart, “multiple clear reactions from both boundaries”.
Also note: the longer the duration of compression (here many weeks), the greater the potential breakout move. Good for you because you prefer swing trading supported by structure.
2. Entry strategy
For a bullish scenario: wait for confirmation of a breakout above ~$4,265. This could be for example a daily close above that trendline / resistance level, or a strong candlestick close + volume spike.
For a bearish scenario: wait for a confirmed breakdown below ~$3,640 (lower trendline + support) with follow-through.
Because you emphasise risk management: Place a stop‐loss maybe just outside the triangle boundary (above resistance for short, below support for long), depending on direction.
3. Risk/Reward & Targeting
The analyst’s target ~$4,720 (for the breakout) gives a potential ~10%+ move from ~$4,265. That’s decent for a swing.
On the downside, target ~$3,300 from ~$3,640 gives ~10%+ also.
For you: calculate your risk (distance to stop-loss) vs reward (distance to target) and only take the trade if the ratio is acceptable (e.g., 1:2 or better).
Given you also do scalping, you could also watch for a smaller move out of the triangle if the breakout slows, or for a retest of the breakout zone.
4. Context & confirmation
Patterns don’t always work. Use other confirmations: volume increase on breakout, maybe RSI divergence, or a candlestick structure (hammer, engulfing etc) at breakout.
Also consider macro / crypto‐market context: Are news, fundamentals, sentiment aligning with a bullish or bearish breakout?
Since you’re also into institutional footprints and liquidity zones: check if the breakout happens near a major liquidity level or order‐block; sometimes institutions will trap retail before the move.
5. Your action plan (for your “advanced path” mindset)
Mark the triangle on your charting software (e.g., MetaTrader 5 if you’re using it for crypto via feed, or a dedicated crypto charting platform).
Set alerts at ~$4,265 and ~$3,640 for price crossing these levels (you can add a buffer e.g., 1-2%).
Prepare two trade plans:
Plan-A (Bull): Entry after breakout above $4,265, stop-loss maybe ~$4,000 (for example), target ~$4,720 + beyond.
Plan-B (Bear): Entry after breakdown below $3,640, stop-loss maybe ~$3,800, target ~$3,300.
⚠️ Risks & caveats
Breakouts from triangles often see retests of the breakout line. Beware false breakouts (fakeouts).
Crypto markets (and especially ETH) can be volatile and news/whale moves can override chart structure. Always manage capital accordingly.
The triangular pattern suggests the range is narrowing: less room inside means bigger explosion once it exits — but also more risk of whipsaw.
As this is a self‐published chart by an analyst (not guaranteed) — always do your own research.
ETH LONG 30 MIN SETUPConcepts: ICT | SMC | Bill Williams
ETH is showing a smart money bullish structure after sweeping liquidity below the previous range low and reacting from a discount zone. The market has now shifted bullish, forming a clean break of structure to the upside.
ICT View:
Sell-side liquidity swept below range.
Price reclaimed an old demand zone, showing displacement.
Entry refined on retracement into the FVG (Fair Value Gap).
SMC Confirmation:
Change of Character (ChoCH) confirmed after liquidity grab.
Entry: 4,123
Stop loss: 4,067 (below the sweep)
Take profit: 4,254 (previous internal high)
Bill Williams’ Alligator:
The lips, teeth, and jaw (green, red, blue) are starting to open upward, signaling the transition from a sleeping phase (accumulation) into a potential impulsive wave.
Trade plan:
🟩 Long: 4,123
🔴 SL: 4,067
🎯 TP: 4,254
RR ≈ 3.1:1
If momentum holds and the Alligator continues to widen, ETH could target higher timeframe liquidity above 4,250–4,300.

ETHUSD trading levels ETHUSD trading levels. Anyone can trade at the given price levels. Check the price action at those levels.

ETHUSDT.P - little bit hopium for price bouncing on premium fibCRYPTOCAP:ETH Little bit hopium in the current downtrend. Technical viewpoint I expect some bounce happening in the premium fib zone which aligns macro 0.382 fib level also. Depending on the BTC that bounce can be only lower high.
Danger zone is below if price goes below the daily OBs loosing support and having loose weekly fvgs.

ETH/USDShift prediction to the right.
Global market cooler anticipated. Crypto should be hit the hardest and fastest.

ETH/USD: Latest Wave Impulse (5) or Extended Correksi Slide?ETH/USD: Latest Wave Impulse (5) or Extended Correksi Slide?
📈 Weekly Scenarios
Bullish scenario: ETH holds the ~$3,800 zone, then breaks through ~$4,500 → wave (5) begins → moves towards ~$5,000+.
Consolidation: The price moves in the ~$3,800–$4,500 range without a clear breakout.
Bearish scenario: Breakout of support at ~$3,800 with volume → corrective wave A-B-C → target ~$3,400–$3,600.
✅ Conclusion
The weekly analysis of ETH/USD shows that the market is at a key point: either a strong rally (wave (5)) is beginning, or a correction is underway.
Holding support at ~$3,800 is critical for the bulls.
A breakout of resistance at ~$4,500 will provide upward momentum.
A breakout below ~$3,800 is a signal for caution and a possible decline.
