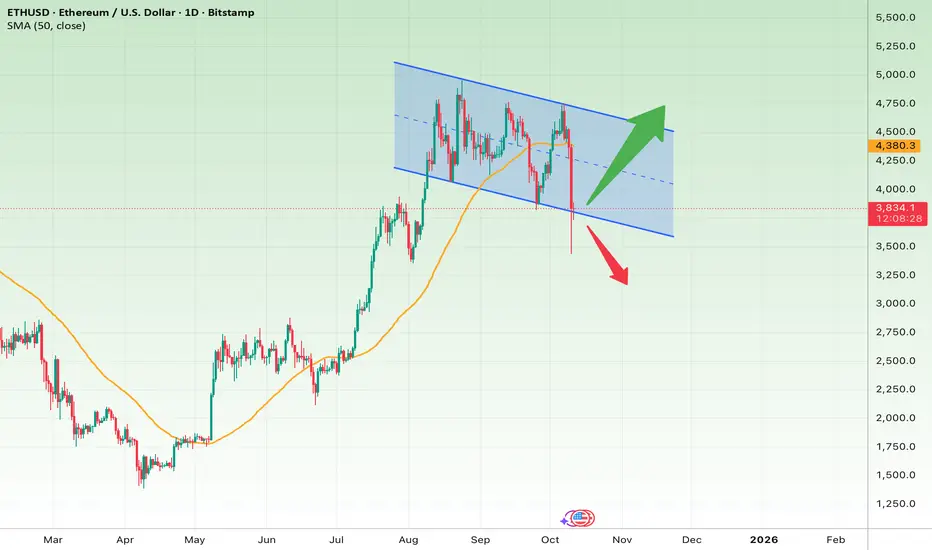
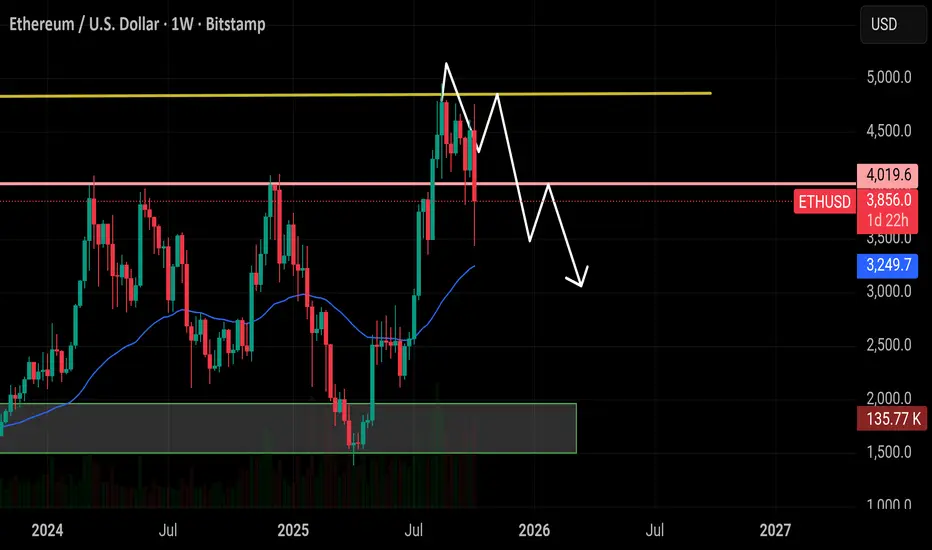
Ethereum at a Turning PointShort-Term Outlook (1–2 Weeks)
Ethereum has been moving inside a descending channel, with recent price action testing the lower boundary. The 50-day moving average (SMA50) around $4,380 acts as strong resistance.
Currently, ETH is trading below that level and close to the lower trendline — a zone of high sensitivity.
If price rebounds and closes above $3,900, a short-term recovery toward $4,250–$4,500 is likely.
However, a daily close below $3,700 would confirm a breakdown, opening the path toward $3,400–$3,200.
Short-Term Setup:
Entry Zone: Above $3,900 after confirmation
Targets: $4,250 → $4,500
Stop Loss: Daily close below $3,700
Long-Term Outlook (1–3 Months)
ETH remains within a medium-term descending channel, showing no confirmed breakout yet.
If it can reclaim and sustain above $4,500, the bearish pattern would be invalidated, and a rally toward $4,800–$5,000 could follow.
But a confirmed breakdown below $3,700 would strengthen the bearish case, potentially leading price down to $3,200–$2,900.
Long-Term Setup:
Bullish Case: Close above $4,500 → Targets: $4,800 → $5,000
Stop Loss: Below $3,900
Bearish Case: Close below $3,700 → Targets: $3,200 → $2,900
Stop Loss: Reclaim above $3,900
Summary:
Ethereum is standing right at a decision zone. The $3,700 level acts as the key pivot — holding it could trigger a rebound toward $4,500, while losing it might mark the start of a deeper correction in the months ahead.
Trade ideas
ETH : good short!On October 9, the indicator showed a short signal, after which the price fell by 20%

20K Awaits: ETH reloading before the next runETH is looking very, very strong — there’s a powerful accumulation globally, and to me, it looks extremely bullish. We’re seeing both higher lows and a squeeze toward the $4,400 level. A breakout could be massive.
BUT since the short signals on Bitcoin (wedge + divergence) haven’t played out yet, according to my trading rules, I have no right to even look at longs.
Key support zone: $2,000–2,200.
We could drop to $1,500, but it’s crucial to hold above $2K.
I’m waiting to go long on ETH for the long term — getting the capital ready :)
The potential up to $20,000 is on the table — making a 10x wouldn’t be bad at all.

Megaphone pattern eth potentially to go up to.....With this potential megaphone pattern, there is no way the bull run is over.
For eth to pump to geary ATH's, it NEEDED to this correction, or test the diagonal support line.....
As you can see the measurements have been taken, the dotted lines, give an indication where ETH may hit, minimum $6500!!
Any thoughts would be ever so grateful, including constructive criticism.
Further market dynamicsTo date, the market has fully fulfilled its targets at the 3500 retest against the background of brent leaving below 64. Further, until the second half of Sunday, the probability of purchases up to the 4500 retest prevails. An important guideline for further dynamics will be the opening level of the new week and the second half of the month. If these periods open at least above 4,100, the probability of a flat and maintaining the market with the possibility of a breakout next month will remain. With weak purchase dynamics, there is a chance of opening the second half of the month below 4,100. In this case, in any case, we will see purchases before the end of the month for a pullback on the monthly candle, but then the market will consolidate around 3500. The available technical signals currently outweigh the bullish scenario. In this case, individual coins will turn the current month into a bullish one with significant interruptions.
The main contenders for this month's move are MITO VIC BMT HOOK, which are highly unlikely to be contenders for the monitoring tag and are more suitable for medium-term investments. It is also possible to consider scalping in the short term CHESS FIO COS QUICK DATA, which have reached supports and can show a deeper drawdown only when the ether falls below 3500. A signal has been left for a move to the ADX, however, there is a possibility of a deeper drawdown to 0.075-85 before the reversal.

Do Not Miss This...What I assume is a Bull retrace before we trend much higher - Many people will fumble this as they don't believe it's possible - this is going to suck so much $ going forward in 2026 - hard to say if the retrace is over but it can be as it tagged our .382 - anywhere in the box shown is a great entry - if we retrace the whole move this idea is invalidated - send it.

ETHEREUM: From Climb to Collapse, Read ETH’s Technical Trap It appears that ETHEREUM may be anticipating a bearish trend.
Analyzing the 4-hour time frame, I spotted a rising parallel channel and a confirmed breakout of its lower boundary.
The final challenge for sellers lies at the 4464 - 4422 support level on the 4-hour chart, where the price is currently consolidating on the horizontal support.
Should the bears break and close below that level, it would signal a significant bearish indication.
Subsequently, a bearish continuation could potentially lead to the 4200-support level.
Currency Shifts and Their Impact on Global Trade1. Understanding Currency Shifts
A currency shift refers to a change in the value of one nation’s currency relative to another in the foreign exchange (forex) market. This movement is driven by multiple factors including interest rates, inflation, fiscal policies, political events, and market psychology.
The value of a currency is typically measured against others through exchange rates — for instance, 1 U.S. Dollar equals ₹83 Indian Rupees. If the rupee weakens to ₹85 per dollar, it means the rupee has depreciated; conversely, if it strengthens to ₹80, it has appreciated.
Key Drivers of Currency Shifts:
Interest Rate Differentials: Higher interest rates attract foreign capital, boosting demand for that currency.
Inflation: Low inflation generally strengthens a currency; high inflation erodes purchasing power.
Economic Growth: Strong GDP growth signals a healthy economy, attracting investment.
Political Stability: Investors prefer stable nations with predictable economic policies.
Trade Balances: Countries with large trade surpluses tend to have stronger currencies due to export demand.
Market Sentiment: Traders’ expectations often move currencies even before data confirms trends.
2. The Mechanics of Currency Appreciation and Depreciation
When a currency appreciates, it gains value relative to others. For example, if the euro strengthens against the dollar, European goods become more expensive for U.S. buyers, potentially reducing exports. On the other hand, depreciation makes exports cheaper and imports more expensive, often improving trade balances for export-heavy economies.
Currency Appreciation:
Exports become costlier, reducing demand abroad.
Imports become cheaper, increasing domestic consumption of foreign goods.
Inflationary pressures ease due to cheaper imports.
Tourism becomes costlier for foreign visitors.
Currency Depreciation:
Exports become cheaper and more competitive globally.
Imports become expensive, raising domestic inflation.
Foreign investors may hesitate due to reduced returns in depreciated terms.
Tourism becomes attractive to foreign travelers.
These movements create ripple effects in trade balances, corporate earnings, and even employment rates in export-dependent industries.
3. Currency Shifts and Export Competitiveness
The direct relationship between currency values and export competitiveness is one of the most crucial aspects of international trade.
When a nation’s currency weakens, its goods and services become more affordable to global buyers. This often leads to:
Increased export volumes.
Higher revenues for export industries.
Improved trade balance.
For example, China’s export boom in the 2000s was partly supported by a deliberately undervalued yuan, which kept Chinese products inexpensive in global markets.
Conversely, a strong currency can hurt exporters. Japan’s experience in the 1990s and early 2000s is a classic case — a strong yen made Japanese goods costly overseas, slowing growth and triggering deflationary pressures.
Example: The Indian Perspective
A weaker Indian Rupee benefits textile and IT exporters, as they earn in dollars but pay costs in rupees. However, it hurts oil importers and increases domestic inflation — showing how currency shifts can have both winners and losers within the same economy.
4. Impact on Imports and Domestic Consumption
Currency shifts don’t just affect exports — they deeply influence imports and consumer prices.
When a country’s currency depreciates, imported goods become more expensive. This can drive up prices of:
Crude oil and energy.
Machinery and electronics.
Raw materials for manufacturing.
As import costs rise, domestic inflation tends to follow, reducing the purchasing power of consumers.
On the other hand, currency appreciation makes imported goods cheaper. This benefits consumers and import-heavy industries but can also weaken domestic producers who face tougher competition from foreign suppliers.
Example: The U.S. Dollar’s Global Role
A strong U.S. dollar makes imports cheaper for Americans — from electronics to automobiles — but can hurt U.S. exporters like Boeing or Caterpillar, as their goods become more expensive abroad.
5. Balance of Payments and Trade Deficits
Currency shifts are closely tied to a country’s balance of payments (BoP) — the record of all transactions between residents of a country and the rest of the world.
A depreciating currency can reduce trade deficits by boosting exports and curbing imports.
An appreciating currency can widen trade deficits as imports rise and exports fall.
However, this relationship isn’t always linear. Sometimes, despite a weaker currency, exports may not rise if:
Global demand is weak.
Supply chains are disrupted.
Exporters rely on imported raw materials (which become costlier).
Case Example: The U.S. Trade Deficit
Despite periodic dollar weakness, the U.S. maintains a persistent trade deficit because of its reliance on imports and strong consumer demand. The dollar’s status as a global reserve currency also keeps it artificially strong, sustaining the deficit.
6. Currency Shifts and Multinational Corporations (MNCs)
For multinational corporations, currency shifts are a constant strategic concern. A company earning revenue in multiple currencies faces exchange rate risk, which can affect profits when converting earnings into the home currency.
Impact Areas:
Revenues: Exporters gain from weaker home currencies, while importers benefit from stronger ones.
Costs: Companies sourcing materials abroad face rising costs when their home currency weakens.
Profits: Fluctuating exchange rates can distort earnings reports and shareholder returns.
Example: Apple and the Dollar
Apple earns a major portion of its revenue overseas. When the U.S. dollar strengthens, Apple’s international earnings, once converted into dollars, decline — even if sales volumes remain constant. Hence, large firms use hedging instruments like forward contracts and options to manage this risk.
7. Currency Wars: Competitive Devaluation and Trade Tensions
At times, nations deliberately weaken their currencies to gain a trade advantage — a phenomenon known as a currency war. By devaluing their currency, they make exports cheaper and imports costlier, spurring domestic production and employment.
However, this often leads to retaliatory devaluations and trade frictions.
For instance:
The 1930s Great Depression saw major economies engage in competitive devaluation, worsening global instability.
The 2010s U.S.-China tensions reignited accusations of “currency manipulation” as China kept the yuan undervalued to boost exports.
Currency wars can escalate into trade wars, where countries impose tariffs or restrictions to counter perceived unfair advantages.
8. Currency Shifts and Commodity Trade
Commodities like oil, gold, and agricultural products are traded globally in U.S. dollars. Therefore, currency shifts — especially movements in the dollar — significantly affect commodity prices.
Strong Dollar:
Commodities become more expensive in other currencies, reducing demand.
Oil and gold prices typically fall.
Weak Dollar:
Commodities become cheaper for foreign buyers.
Prices of oil, metals, and gold usually rise.
This dynamic explains why emerging markets, which rely on commodity exports, are highly sensitive to dollar strength. For example, when the dollar weakens, countries like Brazil, Russia, and Indonesia benefit from higher export revenues.
9. Managing Currency Risks in Global Trade
Given the unpredictability of exchange rates, businesses and governments employ various strategies to manage currency risk.
For Businesses:
Hedging Instruments: Using forward contracts, futures, and options to lock in exchange rates.
Currency Diversification: Operating in multiple markets to balance currency exposure.
Natural Hedging: Matching revenues and expenses in the same currency to minimize conversion losses.
For Governments:
Foreign Exchange Reserves: Central banks hold large reserves to stabilize their currencies.
Monetary Policy Interventions: Adjusting interest rates or directly buying/selling currencies in forex markets.
Trade Policy Adjustments: Imposing tariffs or export incentives to offset currency shifts.
Example: India’s RBI Strategy
The Reserve Bank of India often intervenes to smooth excessive volatility in the rupee, buying or selling dollars to maintain stability. This ensures predictability for exporters and importers alike.
10. The Future of Currency and Global Trade
The 21st century is witnessing rapid shifts in the global currency landscape. The rise of digital currencies, blockchain-based settlements, and central bank digital currencies (CBDCs) may reshape how trade is conducted and how exchange rates are managed.
Key Future Trends:
De-dollarization: Countries are gradually reducing dependence on the U.S. dollar in global trade, using local currencies or alternatives like the yuan.
Digital Payments Revolution: Instant cross-border settlements via blockchain can reduce currency conversion costs.
Geopolitical Realignment: Emerging economies, especially in Asia and Africa, are forming regional trade blocs with local currency trade mechanisms.
AI-Driven Forex Models: Advanced algorithms are increasingly predicting and managing exchange rate risks for corporations and funds.
In the coming decade, the line between traditional currency systems and digital ecosystems may blur, making global trade faster but also more complex to regulate.
Conclusion: The Currency-Trade Equation in a Globalized World
Currency shifts are not mere financial statistics; they are powerful forces shaping the destinies of nations, industries, and individuals. From determining the price of crude oil to influencing job growth in export sectors, exchange rate movements ripple through every layer of the global economy.
A weaker currency can boost exports and employment but risk inflation. A stronger one may curb inflation but dampen competitiveness. Striking the right balance is a constant challenge for policymakers and traders alike.
In today’s interconnected world, understanding the interplay between currency shifts and trade is essential not only for economists and governments but also for investors, businesses, and consumers.
As technology, geopolitics, and digital finance redefine global commerce, the ability to adapt to currency movements will determine who thrives — and who struggles — in the ever-evolving landscape of international trade.
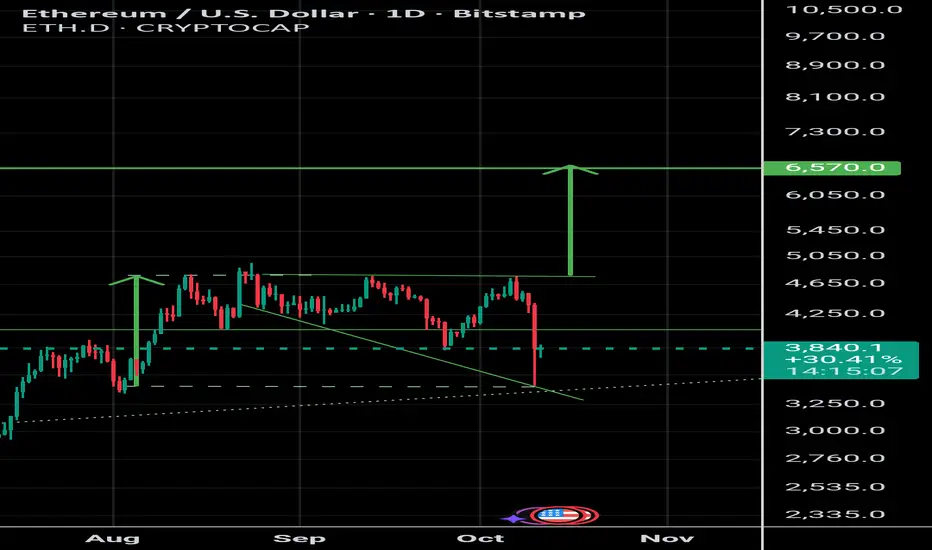
$ETH hit our first target at $3,500 exactly as expected.CRYPTOCAP:ETH hit our first target at $3,500 exactly as expected. As mentioned, a short bounce from that zone played out with an $800 move, pushing the price above $4,300. Now ETH is trading around $3,800. For a sustained upside, it needs to reclaim $4,000 as support. I’m still holding my short setup if $4,000 isn’t regained, the next downside targets remain $3,500 and $3,000.
Only your like motivate me
$ETH market update 5-10-2025📊 Ethereum Market Update (on request)
Right now, there’s nothing major happening for Ethereum. It continues to consolidate in a range between the ATH at $4800 and the $3800 level, because of this massive bearish divergeance.
On the daily chart, the MACD is bullish and the Stochastic RSI is supportive, but momentum looks exhausted. There isn’t much conviction in this move. Bitcoin is the real superstar, while Ethereum is fading in its shadow.
From my analysis, we might still have about one more week of growth, potentially pushing to a new ATH — but don’t expect a parabolic rally. This looks more like a technical follow of BTC rather than genuine investor interest.
⚠️ That means the probability is high that we see a dump back below $4000, likely testing $3800 as support.
If bulls regain control and Bitcoin rotation restarts, ETH could resume its rally. Otherwise, we may see deeper consolidation, possibly down to $3400, before finding the energy to push again toward a new ATH.
#Ethereum #ETH #EthereumPrice #Crypto #CryptoNews #CryptoMarket #Bitcoin #BTC #Altcoins #Trading #TechnicalAnalysis #CryptoUpdate #MACD #StochasticRSI #ATH #CryptoTrading #Investing

ETHUSD: Reversal Expected Near 4100The bullish outlook remains unchanged. We are expecting the price to reverse near 4100 . The sharp move on wave a, a small correction for wave b, indicates a sharp decline and rapid rise in the upcoming days.
Previous research:
Stay Tuned!
@money_dictators
Thanks :)

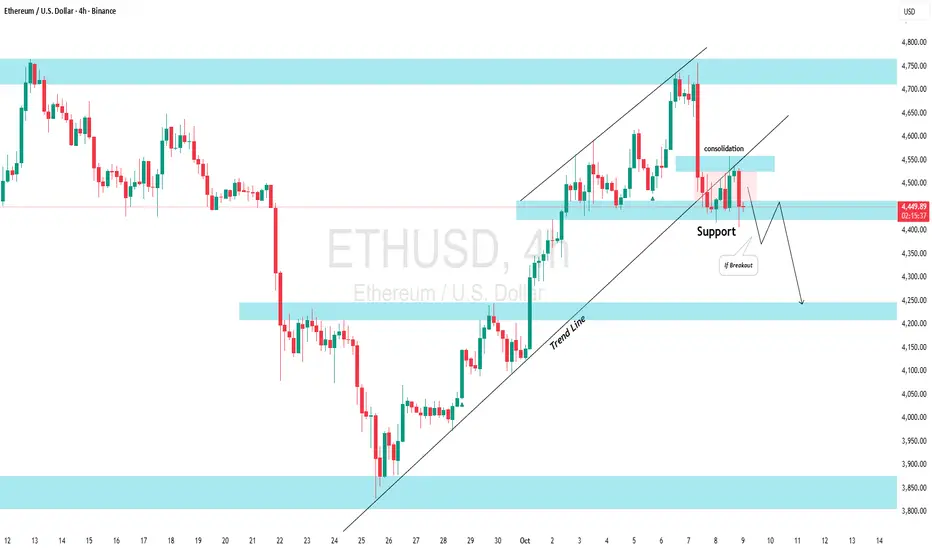
ETHUSD 4H: Bears Dominate After Key Breakdown – $4000 Under Test
ETHUSD 4H: Bears Dominate After Key Breakdown – $4000 Under Test
Chart Overview:
On the 4-hour timeframe, Ethereum (ETH/USD) is currently exhibiting a strong bearish trend following a significant reversal from its early October highs. The chart clearly illustrates a shift in market sentiment, with price action now decisively within a descending channel after breaking a previously bullish structure.
Recent Price Action:
Ethereum experienced a robust rally from its late September lows, forming clear higher highs and higher lows within an ascending green trendline/channel. This bullish momentum propelled ETH towards the 4650 Resistance zone, which proved to be a strong ceiling, leading to a sharp rejection.
Following this peak, the market structure shifted. The previously supportive green ascending trendline was decisively broken, indicating a loss of bullish control. Price then struggled around the 4500 Flip Zone, an area that previously acted as both support and resistance, before eventually succumbing to selling pressure.
A critical event was the breakdown below the 4200 to 4300 Key Level. This zone, which had served as a pivotal support area during the prior consolidation, has now flipped into a major resistance. Currently, Ethereum is firmly trading within a descending red channel, consistently printing lower highs and lower lows, signifying strong bearish momentum. The present candle shows a significant drop, pushing price down to test the crucial psychological and structural support at $4000.
Key Resistance Levels to Watch:
4200 to 4300 Key Level: This is the immediate and most critical resistance overhead. A move back above this zone and a successful retest as support would be the first sign of a potential reversal in momentum.
4500 Flip Zone: If bulls manage to clear the 4200-4300 level, the 4500 Flip Zone will be the next significant hurdle, likely acting as a strong area of contention.
4650 Resistance: The ultimate overhead resistance, where the prior rally topped out. Bulls would need substantial buying pressure to challenge this level again.
Key Support Levels to Monitor:
With the price currently hovering around $4085 and testing the $4000 mark:
$4000: This is the immediate, crucial psychological and structural support level. A bounce from here could indicate short-term relief, while a decisive break below could trigger further downside.
3850 Key Level: Should $4000 fail to hold, the 3850 key level is the next significant structural support. A strong reaction here would be vital for preventing a deeper correction.
Outlook & Scenarios:
Bearish Scenario: If Ethereum fails to hold the $4000 support level and breaks decisively below it, we can expect a continued move lower towards the 3850 key level. A breakdown below 3850 would signify a deeper correction, potentially opening up the path to further structural supports not immediately visible on this chart.
Bullish Scenario: For bulls to regain control, ETH first needs to establish support at or above $4000 and demonstrate a clear rejection of further downside. A sustained push to reclaim the 4200 to 4300 Key Level and a breakout from the descending red trend channel would be strong bullish signals, indicating that the corrective phase might be easing.
Conclusion:
Ethereum is at a critical juncture on the 4-hour chart, with bears firmly in control and testing the significant $4000 support level. Traders should closely monitor the price action around $4000, as a breakdown could lead to a deeper correction towards the 3850 key level. Conversely, a strong bounce and reclaim of the 4200-4300 Key Level would be necessary for any signs of a bullish recovery.
Disclaimer:
The information provided in this chart is for educational and informational purposes only and should not be considered as investment advice. Trading and investing involve substantial risk and are not suitable for every investor. You should carefully consider your financial situation and consult with a financial advisor before making any investment decisions. The creator of this chart does not guarantee any specific outcome or profit and is not responsible for any losses incurred as a result of using this information. Past performance is not indicative of future results. Use this information at your own risk. This chart has been created for my own improvement in Trading and Investment Analysis. Please do your own analysis before any investments.

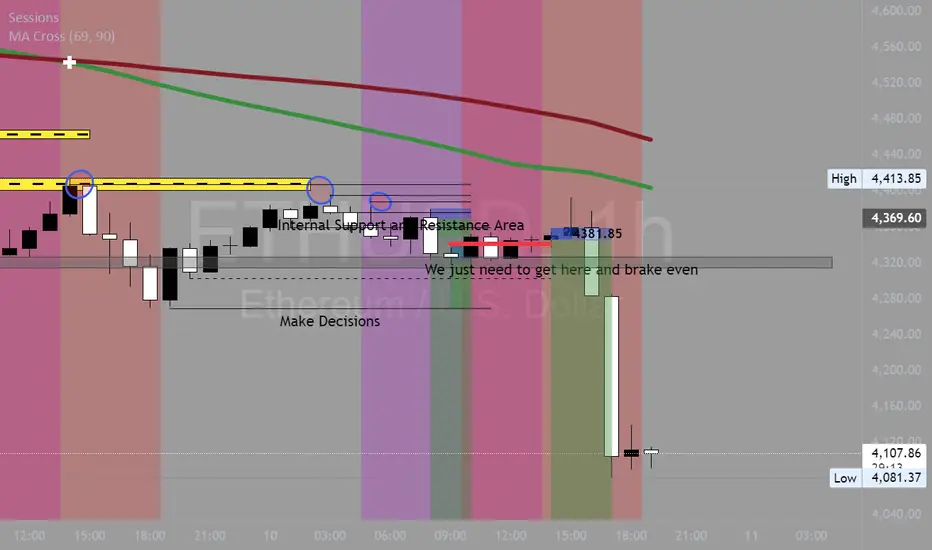
Fix my Stops, fix my profits (save up for a bigger account)I was trying to short ETHUSD but my mistake was to use vey small stops which my stops should have been above that high i identified with the circle. next time if i cant move my stops above or under a 1 hr major area but at least 50 points then i shouldn't take that trade because il be entering emotionally and not putting my stops based on structure #ICCMAFIA
ETH - Inverse H&S #2Yesterday we made a post outlining a potential inverse H&S pattern for ETH if price could hold $4,250.
However, with Trump's tariff announcement today that low was broken therefore negating the pattern. Looking at the chart now there is still a potential for a larger H&S to develop if this $1,070 low can hold. So far that is exactly where price wicked to (white line) and so far has held.
If we readjust the left shoulder to the first low that was established we could be forming the right shoulder at the exact same level! We have been outline the $1,060-$1,090 level as an EXTREMLY key level for many of our past posts so its important to see how price action develops here. If price can hold this level and rebound, the right shoulder should be completed still giving us a measured breakout of around $6k.
Keep in mind, if the low is broken then all eyes will be on if we create a lower low before our last low. If that is the case, refer to our last post outlining that scenario.

ETH BUY (Long) Update from $4350ETH BUY (Long) Update from $4350
20% Longs added from $4350
Right now around $4350
Support Levels $4200-4300
Targets to Watch $4600 ,$4640 & $4670
Even possible to $4700 or Above
Stoploss $4150
Not a Financial advice

ETH LONG TA UPDATE Anything below $4480, is a good buy ETH LONG TA UPDATE
Anything below $4480, is a good buy
Right now at $4470
Stoploss at $4200
Demand Zone $4350-4450
Expecting a bounce soon
towards $4710-4730 Area
Targeting $4730 or Above
Not a Financial advice

ETH PERPETUAL TRADE BUY SETUP Long from $4700ETH PERPETUAL TRADE
BUY SETUP
Long from $4700
Currently $4700
Targeting $4770 or Above
(Trading plan IF ETH
go down to $4640 will add more longs)
Follow the notes for updates
In the event of an early exit,
this analysis will be updated.
Its not a Financial advice

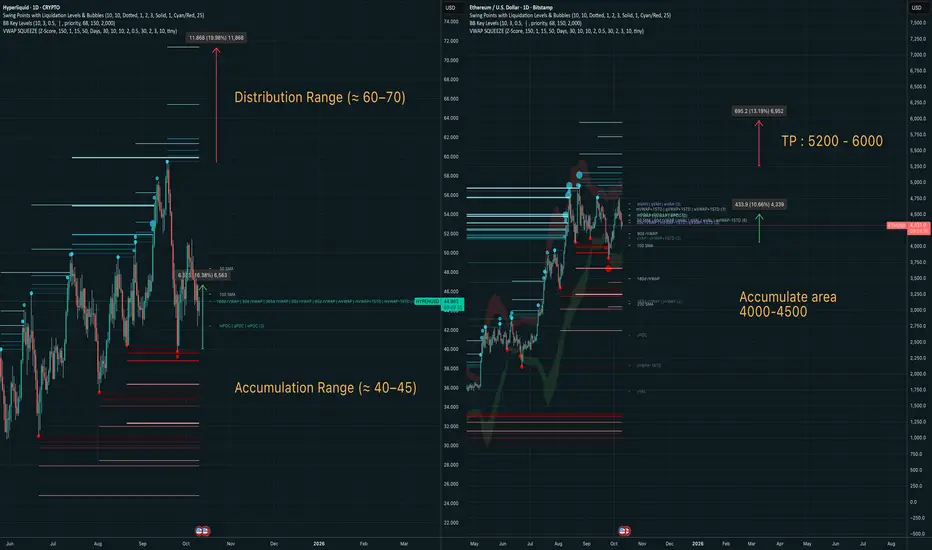
Ethereum + Hyperliquid | Macro Accumulation → Distribution FrameSpot Strategy | 0xPareto Thesis
This chart visualizes the ongoing macro accumulation phase across both Ethereum and Hyperliquid, aligning with cyclical VWAP structure and liquidity maps.
Ethereum (Right):
Accumulation area: $4,000–$4,500
Target: $5,200–$6,000
Hyperliquid (Left):
Accumulation range: $40–$45
Distribution range: $60–$70
Mean reversion setup with high confluence on 180d VWAP and prior liquidity clusters.
ETHUSD support at 4,263The ETHUSD remains in a bullish trend, with recent price action showing signs of a breakout within the broader uptrend.
Support Zone: 4,263 – a key level from previous consolidation. Price is currently testing or approaching this level.
A bullish rebound from 4,263 would confirm ongoing upside momentum, with potential targets at:
4,564 – initial resistance
4,654 – psychological and structural level
4,757 – extended resistance on the longer-term chart
Bearish Scenario:
A confirmed break and daily close below 4,263 would weaken the bullish outlook and suggest deeper downside risk toward:
4,180 – minor support
4,100 – stronger support and potential demand zone
Outlook:
Bullish bias remains intact while the ETHUSD holds above 4,263. A sustained break below this level could shift momentum to the downside in the short term.
This communication is for informational purposes only and should not be viewed as any form of recommendation as to a particular course of action or as investment advice. It is not intended as an offer or solicitation for the purchase or sale of any financial instrument or as an official confirmation of any transaction. Opinions, estimates and assumptions expressed herein are made as of the date of this communication and are subject to change without notice. This communication has been prepared based upon information, including market prices, data and other information, believed to be reliable; however, Trade Nation does not warrant its completeness or accuracy. All market prices and market data contained in or attached to this communication are indicative and subject to change without notice.

Eth/Usd - Bullish Trendline BreakoutTrendline Breakout Confirmed
Price has broken out of the resistance trendline, forming a bullish structure with confirmation from multiple CHoCH (Change of Character) and BOS (Break of Structure).
Entry Executed
Entry was taken on breakout retest (highlighted zone). Price is now pushing above the resistance line, showing strong bullish momentum.
Target: 4430
Based on breakout projection and previous highs, next target is set at 4430.
Structure Overview:
Support Trendline holding price structure
Resistance Trendline broken with strong bullish candle
CHoCH and BOS indicate shift in market structure
15-minute timeframe suggests short-term bullish bias.
Target: 4430
Monitor for volume confirmation and continuation.

ETH Correction Complete? Bullish Setup Reemerges As I mentioned in my previous ETH analysis, while my medium-term outlook remains bullish, I was anticipating a short-term correction.
That’s exactly what unfolded. After retesting the 4750 resistance zone, Ethereum began to retrace, reaching the support area just below 4300 earlier today.
Currently, the price is rebounding, and there’s a strong probability that the corrective phase has ended.
I’m now looking to re-enter long, as even a move back to the recent highs could offer a 1:2.5 risk–reward setup — a solid short-term opportunity within the broader bullish structure.
$ETH 3rd Cycle the retest before parabolic.We can see that Ethereum has exhibited a similar pattern before every major bull run.
1st Cycle (2017)
Retest of the demand zone, followed by a parabolic rise.
2nd Cycle (2020)
Same structure, same momentum.
3rd Cycle (2025)
We are now back in the same zone, Pre-Parabolic phase after retest.
This is not just a correction, it will be the beginning of the next major wave of Ethereum.

$ETH Performing Ascending Channel
An ascending channel, or rising channel, is a chart pattern used in technical analysis to identify a security's ongoing uptrend. It is characterized by the price fluctuating between two parallel, upward-sloping trendlines.
Key components
Higher highs and higher lows:
The price consistently makes higher swing highs and higher swing lows over a period of time, indicating steady bullish momentum.
Parallel trendlines:
Two parallel lines are drawn to frame the price action.
Upper line (resistance):
Connects the higher swing highs. It represents the point where selling pressure is strong enough to temporarily stop the price from rising.
Lower line (support):
Connects the higher swing lows. This line indicates where buying pressure is strong enough to prevent the price from falling further.
