ETHEREUM HIGH PROBABILITY SETUP SOON!!!🚨 ETHER HIGH PROBABILITY SELL/BUY SETUP 🚨
* Here We Can See Clearly The Next Potential Moves For ETHUSD Coming Hours/Days.
* Keep Your Eyes Close On Your Trading Positions.
* Happy PIP Hunting Traders.
FXKILLA.
Trade ideas

ETH: Ethereum Foundation Launch Sparks 5% Rebound ETH: Ethereum Foundation Launch Sparks 5% Rebound Amid Institutional Buzz – SWOT, Price Action, and Intrinsic Value Insights
📊 Introduction
As of October 30, 2025, Ethereum (ETH) is navigating post-Fed volatility with a mild rebound trend, climbing 1% intraday to around $3,939 after dipping to $3,854 earlier, on volume exceeding $40B. This price movement follows the Ethereum Foundation's launch of a new institutional adoption portal, amid viral social media buzz (#EthereumInstitutional trending with over 800K mentions) highlighting DeFi growth and staking opportunities.
Applying timeless investing principles to identify profitable setups, this reveals potential mispricings in the blockchain sector, influenced by macroeconomic factors like Fed's 25bps rate cut hints and $2T liquidity boosts, though sector dynamics reflect Ethereum's 67% DeFi dominance amid competition from L2s and regulatory shifts.
🔍 SWOT Analysis
**Strengths 💪**: Ethereum's robust ecosystem, with over 1.6M daily transactions and average fees near $0.01 per filings and on-chain data, supports a secure network with 35.7M ETH staked (29% of supply). This has driven recent price rebounds from $3,800 lows, tying into strategies for capitalizing on network effects and scarcity for long-term returns.
**Weaknesses ⚠️**: High long-term holder selling (3-month high in October) and energy consumption concerns contribute to 5-10% price pullbacks during sentiment shifts, emphasizing the need for safety in volatile assets.
**Opportunities 🌟**: The Foundation's portal for tradfi onboarding, coupled with TVL at $85B+ and projected 30% growth in DeFi, positions for 15-20% price surges on adoption news, with valuation metrics like P/TVL ~8x offering re-rating asymmetries to generate compounding gains.
**Threats 🚩**: Fed rate cut profit-taking and competition from Solana (faster TPS) risk 10-15% corrections, as seen in recent dips post-BTC dominance spikes, but proven principles help filter for profitable navigation.
💰 Intrinsic Value Calculation
Employing a value investing approach to estimate intrinsic value, we adapt a discounted network model with a margin of safety as emphasized in classic methodologies, ensuring actionable, money-making insights. Key inputs from public data: TVL ~$100B (averaged from reports), circulating supply 120.7M ETH, staking yield ~3.5%, projected growth rate 40% (based on DeFi surges and institutional catalysts).
Formula: Intrinsic Value per Token = (TVL per Token * Weight) + (Annualized Yield * Growth Multiplier)
- TVL per Token = $100B / 120.7M ≈ $828.50 (weighted at 0.7 for core value)
- Annualized Yield = 3.5% (weighted at 0.3, multiplied by 12x growth factor for ecosystem)
Calculation:
(828.50 * 0.7) + (0.035 * 12) = 579.95 + 0.42 = 580.37
Scaled to market comparables (e.g., BTC's P/TVL ~10 vs. ETH's current 8.5): Adjusted Intrinsic = 580.37 * 7 (blended for scalability) ≈ $4,062.59
Apply 20% margin of safety: $4,062.59 * 0.8 ≈ $3,250.07
At current price ~$3,939, ETH appears overvalued by ~18% (factoring limited upside to $4,063 fair value per adoption alignment). No debt flags, but sustainability depends on TVL growth outpacing holder sell-offs. 📉 Overvalued.
🚀 Entry Strategy Insights
Rooted in time-tested disciplines for compounding wealth, identify support zones around $3,800-3,850 (near 200-day SMA) for unleveraged, long-term positions via dollar-cost averaging, entering on breakouts above $4,000 after 5-10% corrections from news events. Tie non-repainting momentum signals to viral launches like the Foundation portal for profitable timing amid volatility.
⚠️ Risk Management
Position sizing at 1-5% allocation to preserve capital during crypto swings, diversifying across Layer-1s and stables. Watch for 15-25% volatility from Fed news; use trailing stops 10% below entry (e.g., $3,545) and hold long-term if fundamentals hold, ensuring sustainable profitability through principle-driven caution.
🔚 Conclusion
Ethereum's institutional push, rebound dynamics, and overvalued metrics signal caution in the current rally, but principle-driven analysis highlights opportunities in dips for measured gains. Key takeaways: Prioritize network adoption for value, verify TVL trends independently. Share your thoughts in comments – does this Foundation launch change your view? #ValueInvesting #Ethereum #CryptoRally #DeFi #Blockchain
This is educational content only; not financial advice. Always conduct your own due diligence.

ETHUSD range trading support at 3,830The ETHUSD remains in a neutral trend, with recent price action indicating a corrective pullback within the broader trading range.
Support Zone: 3,830 – a key level from previous consolidation. Price is currently testing or approaching this level.
A bullish rebound from 3,830 would confirm ongoing upside momentum, with potential targets at:
4,107 – initial resistance
4,185 – psychological and structural level
4,290 – extended resistance on the longer-term chart
Bearish Scenario:
A confirmed break and daily close below 3,830 would weaken the bullish outlook and suggest deeper downside risk toward:
3,760 – minor support
3,713 – stronger support and potential demand zone
Outlook:
Bullish bias remains intact while the ETHUSD holds above 3,831 A sustained break below this level could shift momentum to the downside in the short term.
This communication is for informational purposes only and should not be viewed as any form of recommendation as to a particular course of action or as investment advice. It is not intended as an offer or solicitation for the purchase or sale of any financial instrument or as an official confirmation of any transaction. Opinions, estimates and assumptions expressed herein are made as of the date of this communication and are subject to change without notice. This communication has been prepared based upon information, including market prices, data and other information, believed to be reliable; however, Trade Nation does not warrant its completeness or accuracy. All market prices and market data contained in or attached to this communication are indicative and subject to change without notice.

ETH back above resistanceCRYPTOCAP:ETH megaphone channel is being respected as we approach the upper boundary after overcoming resistance High Volume Node now support.
The daily pivot will also proof tough to overcome and there should be no clean breakout to all time high as we climb the wall of worry from all of the cycle top nonsense... FEAR
Price tested the daily 200EMA as support, normal behaviour and printed bullish divergence from oversold W to Y.
Safe trading

eth to 6000 early next year?2026 would be much better for eth to head toward my target of
6000
8000
10,000
Q1 2026

Etherium Bullish Target 71000$When i analyze ETH chart on a weekly basis, and the sentiment in the political aspect, people
do not understand the power of sentiment and political power.
We have identified five key aspects to consider that can impact the price of ETH over the next year or more.
1, Regulation: GENIUS Act, FIT21, and changes in SEC/CFTC roles
2, Staking & ETF: Approval requests for spot-ETH ETFs, including staking
3, Politics: Crypto reserve and access via 401(k)
4, Technology: Pectra upgrade + EF treasury management
5, Market Reaction: Strong price increases fueled by institutional interest
Also, Treasury stock based on ETH accumulation is coming to life on the principle of Micro strategy "Strategy"
On the LOG chart, we can see what price of ETH is heading for. Personally, my first target is $71000 within the next year.
This is not guaranteed at all, but we must consider all the aspects mentioned.
I think the BTC 4-year cycle is dead, and we will get a completely new cycle due to institutional and political reasons.
Trade at own risk !!

ETHUSD: Next Move Is Up! Long!
My dear friends,
Today we will analyse ETHUSD together☺️
The market is at an inflection zone and price has now reached an area around 4,063.2 where previous reversals or breakouts have occurred.And a price reaction that we are seeing on multiple timeframes here could signal the next move up so we can enter on confirmation, and target the next key level of 4,103.7.Stop-loss is recommended beyond the inflection zone.
❤️Sending you lots of Love and Hugs❤️

$ETH cycle extensionPretty similar in terms of sentiments, momentum, price action and timeframe.
Many people are still sold to the idea of having a 4-year cycle, and believe that the top is already in or it must come in the next few months. But what if something similar to the post COVID dump happens and the current cycle does not follow your typical 4-year cycle but extends for another 6 months 🤔?
So far, it seems the macro conditions do support the potential setup with increasing crypto adoption, regulatory clarity and the easing of monetary conditions. In addition, many 4-year cycle believers probably have already derisked and if the market does not collapse like what they expect, then these money on the sideline could potential the narrative of an extended cycle.

I’ll Be Bearish If This Happens In Crypto🚀 Extreme Fear In Crypto — But I’m Still Bullish!
In this video, I break down the current market situation and why, despite extreme fear and bearish sentiment, I’m still bullish. Just like I called the recent dump weeks ago, I’m now spotting signals for a potential pump soon.
I also explain:
-What would invalidate my bullish bias and make me turn bearish
-Total Market Cap, BTC, and ETH analysis using ICT concepts
-Key levels to watch and possible scenarios for the coming week
Stay patient and stay focused — the market always gives us clear signals if you know where to look.
⚠️ Disclaimer:
I am not a financial advisor. The content shared on this channel is for educational and informational purposes only and should not be considered financial advice.
Trading and investing in cryptocurrency involve high risk — you could lose some, or all, of your money. Always do your own research and make sure you understand the risks before making any financial decisions.

TAKE YOUR CRYPTO PROFITS NOW.Eth dropped from $1,463.72
to $80 in 2018.
$4,382.31 to $1,1700 in 2021
$4,868.53 to $880 in 2022
$4,090.92 to $1,384 in 2024
$4,104.83 to $1,384.66 in 2025
If you are reading this then you likely are invested in ETH or BTC or an ALT. This is your 2nd or 3rd bullmarket. You're deciding right now if you should take profit while you still have a little profit left or hold and pray for an ALT SEASON. If you consider Cryptos getting wiped out nearly 100 percent then rallying back up over 1000 percent to the old price an Alt Season then go ahead. You have already lost most of your profit this cycle so far. The charts are saying sell but you're ignoring the clear signs like you did last bullmarket. You need to take profits while you still have some left. Ethereum will be alot cheaper in a month or two. You can always buy more. Don't mess this up like you did last cycle. Get out!!!!! The technical indicators says its over for now. Be smart and sell!!!!! You lost a lot of profit so far. You know I'm right. The last few cycles you tried to get the top and lost your profits and had to wait all over again. You know I am right. The point of investing in Crypto is to make a living while you are still alive or still young. ALTS will give back all your profits in a short time and leave you waiting for next cycle like last time.

Ethereum - The clear $20.000 target!🚀Ethereum ( CRYPTO:ETHUSD ) is breaking out:
🔎Analysis summary:
Despite the recent back and forth, Ethereum clearly remains bullish. We are still able to see the underlying triangle pattern, which Ethereum is attempting to break again. After a successful breakout, Ethereum will immediately start the next potential +350% rally.
📝Levels to watch:
$4,500 and $20,000
SwingTraderPhil
SwingTrading.Simplified. | Investing.Simplified. | #LONGTERMVISION

Has Life Sprung Back in ALTS?Quick ETH Trade Update — Market Showing Signs Of Life
Just a short update for everyone who’s been following my ETH long position — I’m still in, and we’re finally seeing some movement! There’s been a bit of news that brought life back into the market, especially across altcoins, and I wanted to share my quick thoughts on what this means.
I’ll also cover what I’m watching next, my invalidation levels, and what would make me either hold or scale out of the trade.
Stay patient, stay focused — the move could just be starting.
#Ethereum #ETH #Altcoins #CryptoMarket #CryptoTrading #Bitcoin #ICTStrategy

ETH busy with Right shoulder makingEthereum (ETH) is currently showing signs of completing a classic inverse head and shoulders pattern, which is a bullish technical indicator suggesting a potential trend reversal.
🧠 Pattern Breakdown
- Left Shoulder: Formed late 2024.
- Head: The lowest point, marked during the crash at April 2025.
- Right Shoulder: Recently completed, with ETH testing the neckline resistance around $4800.
📈 Implications
- If ETH breaks and holds above the neckline, it could signal a strong uptrend.
- Analysts like Tony Severino predict a potential rally toward $10,000–$12,000, based on the measured move from the head to the neckline.
- Whale accumulation is also rising, adding fuel to the bullish sentiment.

ETH/USD: Temporary Accumulation Before the Next BreakoutHello everyone, looking at the current price structure of ETH/USD, I believe the market is in a technical accumulation phase following a sharp decline, rather than showing clear reversal signals.
ETH is hovering around $3,825 after a small rebound from $3,780. This is a short-term support zone, but buyers remain weak as the price is still below the Ichimoku cloud on the 4H chart – confirming that the primary trend remains bearish. The Fair Value Gap areas at $3,900–$4,100 act as dynamic resistance, and any rebound toward these levels is likely to face selling pressure. Meanwhile, macro news continues to weigh on crypto, with the USD strengthening after strong PMI data and markets awaiting the GDP – PCE report at the end of the week for clues on the Fed’s next move. When liquidity is cautious, ETH struggles to gain momentum.
Given the current picture, I lean toward a scenario where ETH tests the $3,750–$3,780 support zone, potentially sweeping liquidity down to $3,700 before bouncing back toward $3,950–$4,050. However, if $3,700 is broken with high volume, the $3,500 area becomes the next target for sellers.
Do you think ETH will hold $3,780, or continue to drop deeper? Share your thoughts in the comments below.

ETHUSD trend prediction stage 3Anybody looking at the chart of ETHUSD, what do you think about the future trend of it?
I have been studying the charts price movement for years.
the status of ETHUSD is on the 3 downwards stage. But the sign of "3" is like sidewalk from the bottom. Anybody want to share your comment about that please?

$ETH Before the parabolic expansion.ETH is once again in a similar technical structure to that seen before its parabolic run in 2020.
As was the case then, the falling trend breakout and subsequent retest phase are now complete.
As seen previously, the RSI is still holding above the 50 level, clearly indicating that momentum continues in a positive direction.
The structure is clear in both linear and stick bar charts.
The trend has broken, the retest is happening, and Ethereum is on the verge of a major expansion movement.

Don't sleep on Ethereum!Ethereum is following the pattern seen before the 2021 bull run of Bitcoin, and we are now in the final stages before the parabolic run for Ethereum.
CRYPTOCAP:BTC 2017\2021 vs. CRYPTOCAP:ETH 2021\2025

ETH long ideaETH long idea.
Taking into account November could be bullish. If not, we are about to have a deep bear market

Finally 5k? - ETH weekly update Oct 20 - 26thWelcome to my very shortterm analysis on Ethereum.
Currently, I think the most probable scenario is that we are in a wave 3 of the intermediate cycle and a wave 2 in the minor cycle. This structure is part of the first wave of the primary cycle. Alternatively, This structure could also potentially be a triple three pattern or a triple three with a triangle as the last pattern, as drawn into the chart. Those two alternatives are not my main scenario, because the structure of the X is clearly a five-parter and no valid pattern has this characteristics. Moving on, as you can see I expect the wave 2 of the minor cycle to be deeper than normal, because Liquidity is sitting just above the start of the minor wave 1 and as second waves in crypto often move a bit further, I do expect them to do that here to. It is only important to keep an eye on the chart, because as Ethereum breaks the low of the minor wave 1, the scenario will be invalidated. As price evolves it is also critical that Ethereum sustainably breaks the high of the minor wave 1. Indicators for the ending of the second wave could be negative or low funding rates, a low RSI and liquidity forming above the first wave's high because traders expect the price to drop further and open leveraged positions. Speaking of liquidity, the ETF shows more outflows than inflows and on-chain data is also showing large funds distributing they're Etehreum. This could also be a part of the fifth and last wave of the cycle, where institutionals sell and the retailers being the exit liquidity.
Till next update have a successful week, see ya✌️.

Ethereum Near Breakout as Whales AccumulateCOINBASE:ETHUSD ’s price is testing key resistance levels after a steady week of accumulation. On the daily chart, COINBASE:ETHUSD remains capped by Fibonacci barriers at $3,986 (0.382) and $4,281 (0.618) — both of which rejected earlier rally attempts. A daily close above $4,281 could confirm a reversal toward $4,491–$4,954, while losing $3,804 risks a drop to $3,509.
The RSI continues to show a bullish divergence, as the indicator made higher lows while price formed lower lows between September 25 and October 22, hinting at fading bearish momentum.
On-chain metrics back the setup: whales added 150,000 ETH ($588 million) in 24 hours, and spent coin movement dropped 88%, showing rising holder conviction. Together, these signals strengthen Ethereum’s rebound case — but confirmation still depends on a clean breakout above $4,281.

$ETH in the calm before the storm.In the HTF view, Ethereum maintained its structural strength with rising lows, broke the major supply zone and is currently progressing in the retest process.
It is quietly accumulating strength and preparing for a new move between the 2021 ATH resistance and the area that used to be the supply zone and now serves as support as the demand zone.
Bear market rhetoric may be prevalent, but structural data suggests Ethereum is preparing for a major rally.

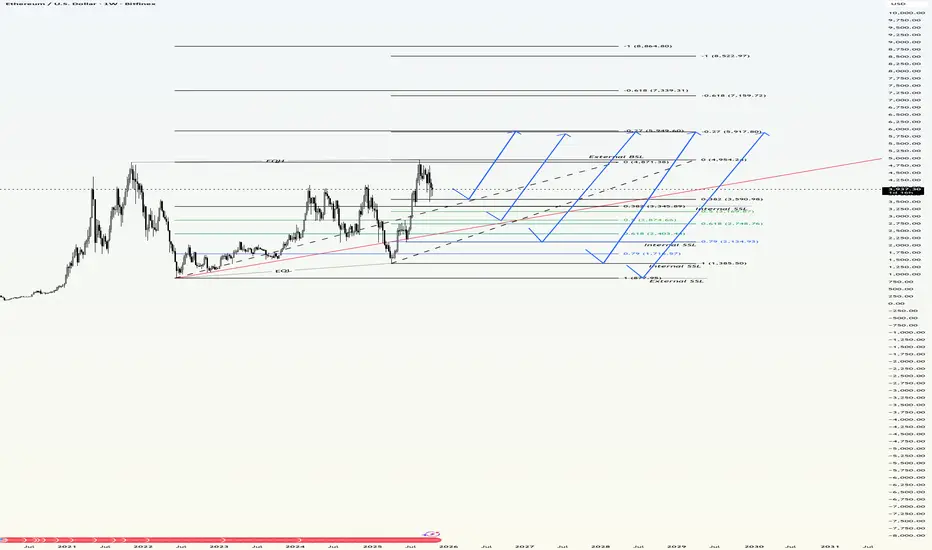
Possible scenarioos for the development of events on the weekly A good weekly sidebar. Which combines the Wyckoff method, J. Murphy method. Smart money concept. And a possible scenario or scenarios for the extension of Fibonacci. we have a return to the sidebar testing 0.38 Fibonacci of the last impulse up, if we go up from here it will be a trend execution, that is, aggressively. and so we have five possible scenarios . development of events on the chart. the market maker tried hard to make a good weekly chart. This is not investment advice!!! This is just the author's opinion!
ETHUSDT: Head And Shoulders Pattern, Price Targets! $3,676Hi everyone,
Lets grasp a sight on ETHUSDT, we can clearly notice that Ethereum have lately concluded the head and shoulders pattern setup. the price have been ranging for some few hours after touching the neckline region, presently we are expecting a breakdown below this region.
Meanwhile a confirmed breakout from the neckline region would activate a downside movement with momentum aim for $3,676.
Like and follow up,
Thanks for reading.
