Trade ideas

Ethereum / USD – 15M | Testing Rejection & Demand Zones
ETH is ranging between rejection above and demand below. Market structure shows equal highs forming resistance while strong lows hold the downside.
**Bullish Scenario:**
* Price respects 4230 demand zone (rejection block)
* Break above 4410–4425 equal highs
* Target 4500 → 4650 rejection block
**Bearish Scenario:**
* Fail to hold 4230 zone
* Drop below 4215–4200
* Opens path to deeper levels around 4100–4050
**Key Levels:**
* Resistance: 4410 / 4500 / 4650
* Support: 4230 / 4215 / 4200
💬 Will ETH break equal highs or revisit demand first?

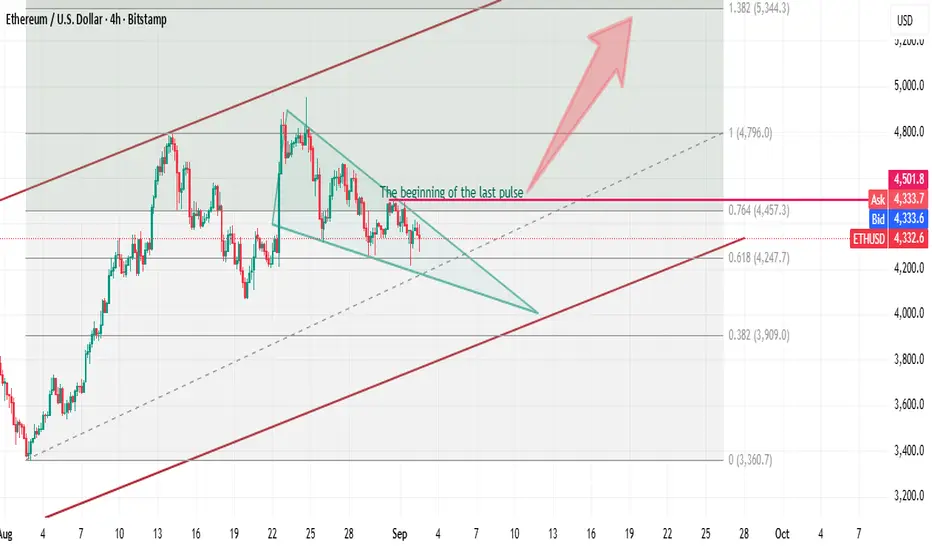
Descending wedge on Ethereum ETHUSDHello, dear traders.
Ethereum is moving in an uptrend. Locally, we see a correction forming in the form of a descending wedge.
The price is already close to the trend support level. According to FRL rules, an exit from a descending wedge is considered valid when the price consolidates above the start of the last impulse of this wedge, because its lows constantly update the lows.
Thus, at the moment, this level is at a price of 4500. But this wedge may continue, and this level may drop lower. In any case, this is already a great level that will break this descending wedge. In addition, a bullish divergence is forming on the MACD in H4.
The target of the potential downward movement is the 1.382 level according to Fibonacci levels.
These are my thoughts. What are your thoughts on the current situation?


ETHUSD Sell Plan – 28/8/2025ETHUSD Sell Plan – 28/8/2025
Entry after rejection at resistance
Stop loss above recent swing high
First target at next liquidity pool
Final target at demand zone
Approx. 1:3 Risk/Reward
📌 Bearish bias valid as long as market stays below resistance.

ETH/USD (Ethereum vs US Dollar) ETH/USD (Ethereum vs US Dollar) 2-hour chart on Coinbase.
From My chart setup:
Price is consolidating inside a falling wedge pattern.
I have marked two breakout targets already.
📌 Targets shown on your chart:
First target point: around 4,700 – 4,720
Second target point: around 4,940 – 4,960
⚠ Important Notes:
A wedge breakout to the upside would confirm these targets if volume supports the move.
If ETH fails to break above the wedge and loses support (~4,300 – 4,250), the setup becomes invalid and could drop further.

$ETH pumping up againCRYPTOCAP:ETH testing the support again and reversing back up. Placing stop loss at breakeven.

Ethereum Eyes Resistance Amid Bearish OutlookFenzoFx—Ethereum is consolidating after forming a triple bottom at equal lows of $4,207.0. It recently tapped the mean threshold of the inverted fair value gap near $4,400.0. Momentum picked up after ETH swept liquidity below $4,257.0, suggesting a potential move toward equal highs at $4,516.0.
However, this uptick doesn’t signal a market structure shift. The broader outlook remains bearish until Ethereum revisits the equal lows at $4,207.0, where significant stop orders have accumulated, especially since Monday.

1:2 RR SELL Trade on Ethereum NOW📉 Ethereum (ETH/USD) – 1:2 RR Sell Trade Setup
You're executing a sharp short trade on Ethereum with a clean 1:2 risk-to-reward ratio. Here's a crisp TradingView idea description:
🔻 Trade Snapshot
- Bias: Bearish momentum
- Entry: Near recent resistance or breakdown level
- Stop Loss: Above key structure or wick rejection
- Target: 2x the risk, aligned with next support zone or Fibonacci level
- Confirmation: Bearish engulfing, RSI divergence, or MACD crossover
💬 "ETH showing signs of exhaustion—perfect setup for a disciplined 1:2 RR short. Tight stop, clear target, and momentum on our side."

ATH Bull Run scenariosTwo scenarios I'm tracking in log time. Looking to either retest the mini-bear channel as support, or retest the 2021 resistance line as support.

ETHUSDT (2H) – Testing Demand vs Trendline ResistanceBITSTAMP:ETHUSD
Structure | Trend | Key Reaction Zones
ETH continues to print Lower Highs (LH) and Lower Lows (LL) showing sustained bearish pressure 📉. Price is now hovering inside a key demand zone (4,285–4,305) while facing a major descending trendline resistance above 🚨. This is a critical decision area.
Market Overview
The market structure remains bearish with supply zones holding and buyers only reacting at demand levels. Any relief rally could face heavy rejection at the trendline (around 4,485–4,520). A breakdown of 4,210 support would confirm bearish continuation, while a sustained reclaim above 4,485 may shift bias back to bullish.
Key Scenarios
✅ Bullish Case 🚀
Relief rally from demand zone →
🎯 Target 1: 4,485
🎯 Target 2: 4,542
🎯 Target 3: 4,677
❌ Bearish Case 📉
If rejection from trendline & breakdown below 4,210 →
🎯 Downside Target 1: 4,086
🎯 Downside Target 2: 4,000
Current Levels to Watch
Resistance 🔴: 4,485 → 4,542 → 4,677
Support 🟢: 4,305 → 4,210 → 4,086
⚠️ Disclaimer: This analysis is for educational purposes only. Not financial advice.

ETHUSD Update (1H)Price has broken structure from the supply zone around 4483 – 4540 and is now retesting the previous support-turned-resistance near 4380 – 4440.
🔻 Bias: Bearish
📍 Entry Zone: 4380 – 4440 retest
🎯 Targets: 4290, 4250, 4125
⛔ Invalidation (SL): Above 4483
Looking for a clean retest rejection to continue downside momentum.

ETH Bull Options on longer time framesThis chart is an attempt to zoom out and consider various bull options, including ones with a large drop near-term.

ETH (30m): Head & Shoulders Breakdown, Key Supports AwaitETH (30m): Head & Shoulders Breakdown, Key Supports Await
Bearish Reversal Pattern: Ethereum has completed a classic Head and Shoulders pattern, which is a bearish reversal formation, and has clearly broken below its crucial neckline. This indicates a significant shift in short-term momentum to the downside.
Failed Retest & Resistance: The price has tried to recover, making an attempt to retest the broken neckline, but it looks like that area (around 4,400−4,500, marked by the blue box and circle) is now acting as strong resistance, pushing prices back down.
Bullish Confirmation: For us to even consider a bullish outlook on this timeframe, Ethereum needs to decisively break and hold above the $4,700 mark. Until then, the path of least resistance appears to be downwards.
Key Support Target: Our primary downside target and critical support zone is the $4,000 to $4,100 range. This is where we anticipate buyers might step in if the current selling pressure persists.
Disclaimer:
The information provided in this chart is for educational and informational purposes only and should not be considered as investment advice. Trading and investing involve substantial risk and are not suitable for every investor. You should carefully consider your financial situation and consult with a financial advisor before making any investment decisions. The creator of this chart does not guarantee any specific outcome or profit and is not responsible for any losses incurred as a result of using this information. Past performance is not indicative of future results. Use this information at your own risk. This chart has been created for my own improvement in Trading and Investment Analysis. Please do your own analysis before any investments.

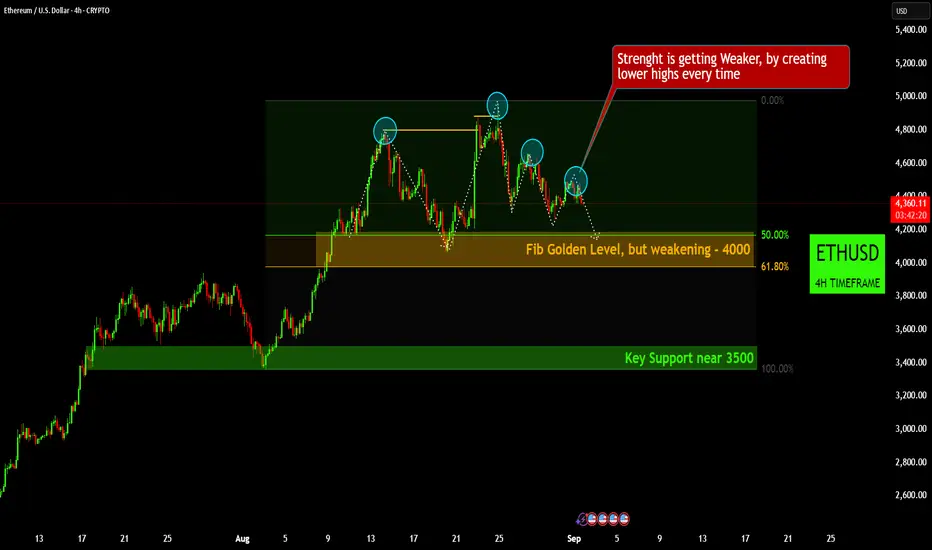
Ethereum (4H) Alert: Weakening Strength & Key Support LevelsEthereum (4H) Alert: Weakening Strength & Key Support Levels
Fading Momentum: We're seeing clear signs that bullish strength is weakening. Ethereum has been creating a pattern of "lower highs" since its recent peak, indicating that sellers are gaining control on bounces.
Fibonacci Level Under Pressure: The "Fib Golden Level" around $4,000 is a crucial support, but it appears to be weakening. This suggests that if selling pressure continues, this level might not hold firmly.
Key Support Zone: If the current levels fail, the next major "Key Support" area we'll be watching is near $3,500. This will be a critical zone for potential buyers to step in and prevent further significant declines.
Short-Term Outlook: Given the series of lower highs and the weakening Fibonacci support, traders should be cautious. The market is signaling a potential continuation of this correctional phase unless we see a strong reversal of the current downtrend.
Disclaimer:
The information provided in this chart is for educational and informational purposes only and should not be considered as investment advice. Trading and investing involve substantial risk and are not suitable for every investor. You should carefully consider your financial situation and consult with a financial advisor before making any investment decisions. The creator of this chart does not guarantee any specific outcome or profit and is not responsible for any losses incurred as a result of using this information. Past performance is not indicative of future results. Use this information at your own risk. This chart has been created for my own improvement in Trading and Investment Analysis. Please do your own analysis before any investments.
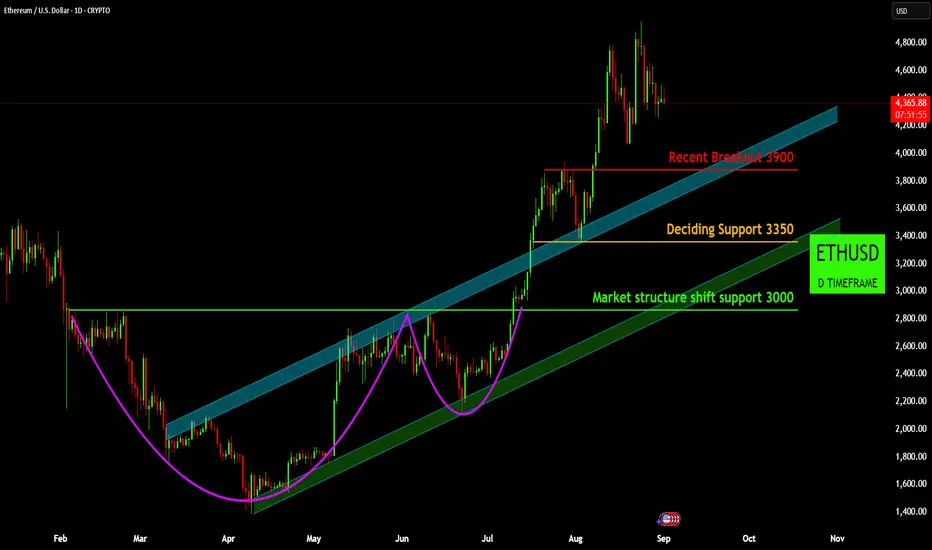
Ethereum Daily: Bullish Structure Intact, Key Supports AheadEthereum Daily: Bullish Structure Intact, Key Supports Ahead
Established Uptrend & Breakout: Ethereum has successfully completed a bullish "Cup and Handle" pattern, leading to a strong move upwards. It has since been trading within a well-defined ascending channel on the daily timeframe.
Key Support from Prior Breakout: The $3,900 level, previously a resistance that marked a "Recent Breakout," is now a significant area of support that we should watch closely on any pullbacks.
Critical Deciding Support: A more crucial "Deciding Support" for the current bullish impulse is found at $3,350. Maintaining above this level is essential for the immediate continuation of the uptrend.
Long-Term Structural Integrity: The long-term bullish market structure remains intact as long as Ethereum holds above the "Market structure shift support" at $3,000. A break below this would signal a significant change in the trend.
Disclaimer:
The information provided in this chart is for educational and informational purposes only and should not be considered as investment advice. Trading and investing involve substantial risk and are not suitable for every investor. You should carefully consider your financial situation and consult with a financial advisor before making any investment decisions. The creator of this chart does not guarantee any specific outcome or profit and is not responsible for any losses incurred as a result of using this information. Past performance is not indicative of future results. Use this information at your own risk. This chart has been created for my own improvement in Trading and Investment Analysis. Please do your own analysis before any investments.
Be careful - ETH weekly analysis Sep 1 - 7ththereum currently presents two possible interpretations. Either we remain in a corrective structure within Intermediate Wave 4, or we are already forming a 1–2 setup at the Minute degree, which would imply the start of an impulsive rally. My primary scenario, however, favors the correction. The reason is simple: despite the current bullish news flow, the internal structure does not provide enough confirmation for me to adopt the 1–2 setup as the main count.
The order book shows notable order clusters around $4.2k and additional orders at $4k, while the liquidation heatmap highlights significant liquidity at the $4k level. Of course, shorter-term liquidity and orders exist above current price, but the fact that the recent pump occurred as a typical “Sunday pump” makes me cautious about taking longs in this environment.
Derivative data supports the cautious stance. Open interest has stabilized, while funding rates have slipped back into negative territory. This suggests bearish sentiment is still dominant. When combined with the liquidity sitting above current price, the bearish argument is further reinforced.
Additionally, it is worth noting that Fetch.ai has recently broken its bullish structure, and from experience, other altcoins often follow such bearish turnarounds. For now, I am short positioned. Key levels to watch include the 0.618 retracement of the supposed Minute Wave 2, which could act as a potential reversal zone. However, once the low of Minute Wave 1 is broken, I expect the path toward $4,000 to open up.

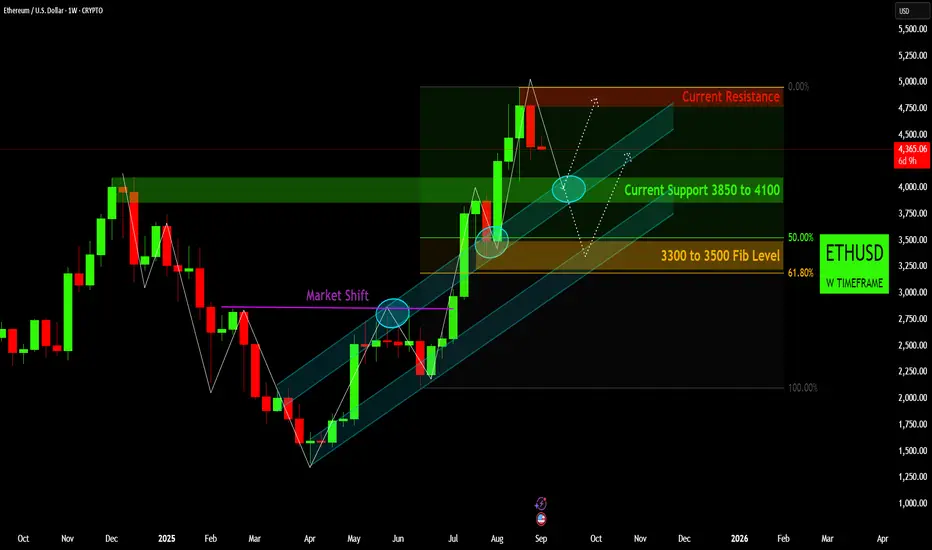
Ethereum Weekly Outlook: Pullback to Key Support LevelsEthereum Weekly Outlook: Pullback to Key Support Levels
Established Uptrend: Ethereum has been in a clear and strong uptrend since the "Market Shift" earlier in the year, consistently trading within its ascending channel.
Recent Pullback from Resistance: After reaching recent highs, ETH is currently experiencing a pullback, having met resistance around the 4,800−5,000 level.
Immediate Support Zone: The first critical support area to watch is between $3,850 and $4,100. This zone coincides with the lower boundary of our uptrend channel, suggesting it could be a strong bounce point.
Deeper Fibonacci Support: Should the initial support fail, the next significant level for buyers to step in is the "3300 to 3500 Fib Level." This represents a healthy retracement (50% to 61.8%) within the larger bullish structure.
Disclaimer:
The information provided in this chart is for educational and informational purposes only and should not be considered as investment advice. Trading and investing involve substantial risk and are not suitable for every investor. You should carefully consider your financial situation and consult with a financial advisor before making any investment decisions. The creator of this chart does not guarantee any specific outcome or profit and is not responsible for any losses incurred as a result of using this information. Past performance is not indicative of future results. Use this information at your own risk. This chart has been created for my own improvement in Trading and Investment Analysis. Please do your own analysis before any investments.
Ethereum / U.S. Dollar – 15m | Order Block at Play
ETH is sitting on a fresh order block after rejecting from equal highs. Market is at decision point — either bulls reclaim highs or bears drag it into deeper demand.
**Bullish Scenario:**
* Hold above 4,380–4,400 order block
* Break through 4,410–4,420
* Push to 4,480 equal highs → extension towards 4,520 strong high
**Bearish Scenario:**
* Lose 4,380 support
* Drop towards 4,340 strong low
* Further downside could target 4,300 FVG and 4,218–4,200 rejection block
**Key Levels:**
* 4,480: Equal Highs
* 4,520: Strong High
* 4,380–4,400: Order Block (Support)
* 4,340: Strong Low
* 4,300: FVG
* 4,218–4,200: Rejection Block
💬 ETH is balancing on its OB — breakout for new highs or deeper sweep into demand next?

NEWBORN GREY BEAR CHANNEL: 3950 still in play - 5200 if rejectedA few things here. The Purple micro bear channel was broken, a new ATH was made, now we consolidate in a newborn GREY bear channel. The red line is important to me on a macro level. It represents the mid-point on a larger bull channel created from the DEC 2024 highs & APR 2025 lows. This channel is where others derive from. Getting above that red line targets an above fib at 4795, and if we pressure below, it can target 3950. Both local golden majors. In my opinion, the monthly pennant breakout should be retested as support after proving resistance for years. This is all just my opinion. I use geometrical channel trading as my confirmation for all other indicators. They always align. GL.

GREY CHANNEL: Shifted, still in discovery. 4230's-3950 possibleFuny action over the weekend. The micro bear trend / channel is still finding a clear path. Equities markets will have the biggest say this week. GL

Ethereum Meta ReportWhat I believe eth is likely to do over the next month or so given the current landscape.
