Big Crypto Heist: ETH/USD Swing Plan Targeting 5200 Exit!🚨💎ETH/USD “Ethereum vs U.S Dollar” Crypto Heist Plan (Swing Trade)💎🚨
Dear Ladies & Gentlemen… my Thief OG’s 🕶️💰, the vault is open and the police are distracted — time for the Ethereum Heist Plan!
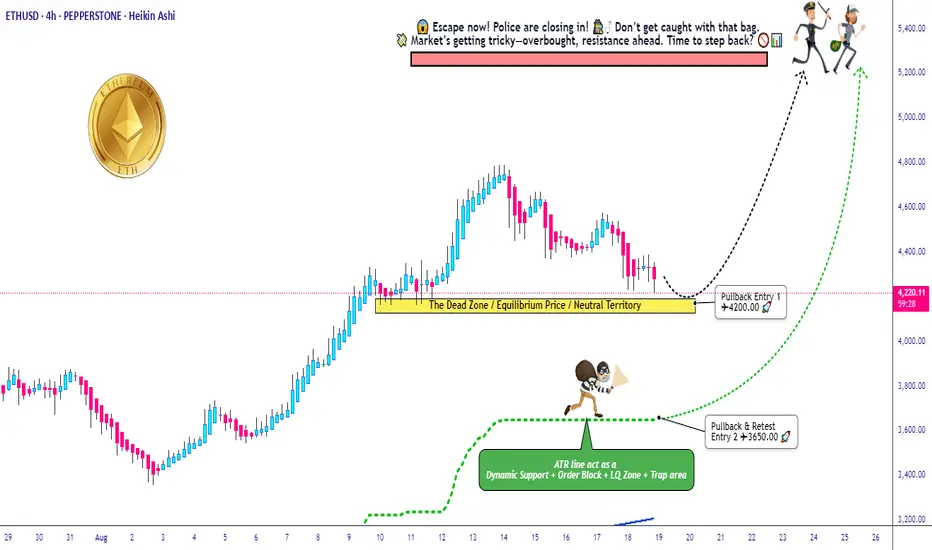
Entry Plan (Pullback Loot Zones)
Pullback Entry 1: 💵 4200.00
Pullback Entry 2: 💵 3650.00
Load your bags in layers (Thief layering strategy – multiple buy limit orders). Patience is the key, we strike when guards are weakest.
🛑 Stop Loss (Escape Route)
Entry 1 SL: 3850.00
Entry 2 SL: 3300.00
👉 Adjust your SL according to your risk appetite & strategy — every thief has their own escape route.
🎯 Target (Cash-Out Point)
Police barricade ahead! 🚔💨 Secure your loot & exit before capture:
Take Profit @ 5200.00 🤑💸
📜 Thief Note:
This ETH/USD setup is a bullish robbery mission 🕵️♂️. Market guards (bears) are getting weaker, giving us the opening. Our layered pullback entries ensure we don’t rush the vault — we strike smart, not desperate.
⚡ Always remember: news releases = alarm triggers 🚨. Stay sharp, use trailing stops, and never get too greedy.
💖 If this plan helps your heist bag grow — Hit the Boost Button 💥 and power up our robbery crew. Together, we raid the markets daily with the Thief Trading Style. 🏆💪💰
🚀 Stay ready, stay sneaky… The next target is always around the corner.
Trade ideas
Accumulate for uptrend ! ETH September 01💎 ETH WEEKLY PLAN UPDATE (09/01 )
Medium-term ETH Plan & Trend Outlook
ETH has completed the test of the resistance zone at 4,800 (4k8 resistance DONE) and is currently in a corrective move.
The price is still holding above the 4,200 – 4,215 support zone, which coincides with EMA89, showing that this is an important medium-term demand area.
As long as ETH stays above 4,200, the main trend remains bullish, with the next target aiming toward 6,000 (Fib 2.618 resistance + strong supply zone).
Key Support Zones:
• 4,200 – 4,215 → short-term demand, main support pillar.
• 3,600 – 3,620 → medium-term support (EMA200 + previous breakout).
• 3,200 – 3,216 → deeper support if 4,200 breaks.
• 2,500 – 2,520 → long-term support, major base zone.
Key Resistance Zones:
• 4,800 – 4,825 → short-term resistance, recently tested.
• 6,000 – 6,050 → medium-term bullish target, strong supply zone.
Trend Outlook:
ETH is currently undergoing a healthy correction after a 5-wave rally.
• The positive scenario: price holds above 4,200, then rebounds to retest 4,800, and if it breaks, the uptrend could extend to 6,000.
• The negative scenario: if 4,200 breaks, the market could retrace to deeper support levels at 3,600 or 3,200 before forming the next bullish wave.

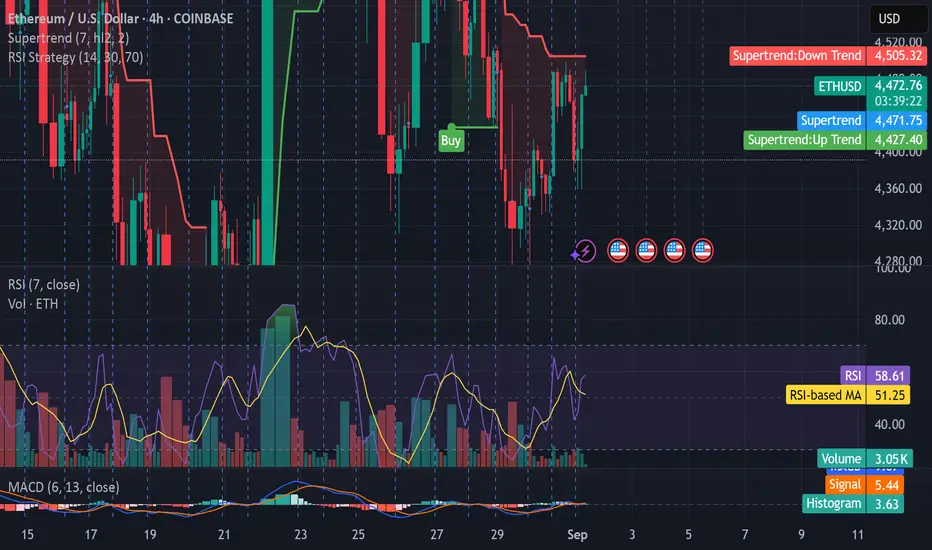
ethusd buy tradeThe Relative Strength Index (RSI) is showing an upward trend, indicating increasing momentum. Additionally, the Moving Average Convergence Divergence (MACD) is showing a bullish crossover, further supporting the potential for an upward move

New to this, with these signals breakout Imment for Swing traderCan someone Analyze this chat for me? Good or bad tie to buy?
Silver, Platinum & Precious Metals Market1. Introduction
Precious metals such as silver, platinum, gold, and palladium have fascinated humanity for centuries. They hold cultural, monetary, and industrial importance that makes them unique in the global economy. Unlike common metals such as iron, aluminum, or copper, precious metals are rare, valuable, and often used as a store of wealth. They also play a crucial role in industries ranging from jewelry to electronics, automotive, renewable energy, and even healthcare.
Among these, silver and platinum stand out as vital markets in their own right. While gold typically dominates headlines as the “safe-haven asset,” silver and platinum are equally influential because they serve dual roles—as investment assets and essential industrial commodities. Their prices, supply-demand dynamics, and market structures are influenced by both economic conditions and technological advancements.
This essay will explore the global market for silver, platinum, and other precious metals, focusing on their historical evolution, supply-demand factors, industrial applications, investment value, geopolitical dynamics, and future outlook.
2. Historical Significance of Precious Metals
2.1 Silver
Silver has been used for thousands of years as a currency, in jewelry, and for ceremonial purposes. Ancient civilizations, including the Greeks, Romans, and Egyptians, valued silver coins for trade. In medieval Europe, silver played a role in shaping international commerce through the Spanish “pieces of eight” minted from silver mined in South America.
2.2 Platinum
Platinum was discovered later than gold and silver. Indigenous South American tribes used platinum in jewelry as early as 1200 AD, but it wasn’t until the 18th century that it gained recognition in Europe. Due to its high melting point and resistance to tarnish, platinum became associated with luxury, prestige, and industrial innovation.
2.3 Broader Precious Metals
Other precious metals like palladium, rhodium, and iridium have also gained prominence due to their industrial and catalytic uses, especially in the automotive and clean energy sectors.
3. Supply Side of Precious Metals
3.1 Mining & Production
Silver: The majority of silver is produced as a by-product of mining other metals such as copper, gold, lead, and zinc. Major producers include Mexico, Peru, China, Chile, and Russia.
Platinum: Platinum group metals (PGMs) are found mainly in South Africa, which accounts for around 70% of global supply, followed by Russia, Zimbabwe, and North America. Mining is capital-intensive and often subject to political and labor disruptions.
3.2 Recycling
Both silver and platinum are extensively recycled.
Silver recycling comes mainly from photographic films (now declining), electronics, and jewelry.
Platinum recycling is significant in the auto industry, particularly from catalytic converters in vehicles.
3.3 Geopolitical Risks
Supply is concentrated in a few countries, which makes the market sensitive to political instability, strikes, sanctions, and trade restrictions. For example:
South Africa’s mining strikes often disrupt platinum supply.
Russian sanctions have impacted palladium and platinum exports.
4. Demand Side of Precious Metals
4.1 Investment Demand
Investors buy silver and platinum in the form of:
Coins and bars
Exchange-traded funds (ETFs)
Futures and options contracts
During times of inflation, currency devaluation, or geopolitical uncertainty, demand rises as investors seek safe-haven assets.
4.2 Jewelry Demand
Silver: Affordable and widely used in ornaments worldwide, especially in India and China.
Platinum: Associated with luxury and exclusivity, favored in high-end jewelry markets like Japan, the US, and Europe.
4.3 Industrial Demand
This is where silver and platinum truly stand out from gold:
Silver: Essential in electronics, solar panels, batteries, and medical applications due to its conductivity and antibacterial properties.
Platinum: Used in catalytic converters, fuel cells, medical devices, and chemical processing.
4.4 Emerging Technologies
Silver demand is rising due to green energy (solar PV cells, EV batteries).
Platinum demand is expanding due to hydrogen fuel cells and decarbonization trends.
5. Price Dynamics
5.1 Factors Influencing Prices
Macroeconomic conditions: Inflation, interest rates, and currency strength (especially the US Dollar).
Industrial cycles: Tech advancements and auto sector demand strongly influence silver and platinum.
Geopolitical events: Wars, sanctions, and mining strikes cause price spikes.
Investor sentiment: Market perception of economic uncertainty drives safe-haven demand.
5.2 Volatility
Silver is historically more volatile than gold because of its dual role (investment + industrial). Platinum prices are highly cyclical, linked to auto and manufacturing sectors.
6. Silver Market in Detail
6.1 Global Silver Reserves
Estimated global reserves: ~530,000 metric tons.
Major miners: Fresnillo (Mexico), KGHM (Poland), Glencore (Switzerland), Pan American Silver (Canada).
6.2 Industrial Usage
Electronics: Smartphones, 5G equipment, circuit boards.
Solar Energy: Photovoltaic panels account for over 10% of silver demand and rising.
Medicine: Antibacterial coatings, surgical tools, wound dressings.
Batteries & EVs: Silver paste improves conductivity in modern batteries.
6.3 Investment Trends
Silver ETFs like iShares Silver Trust (SLV) attract large capital inflows. Physical silver coins such as the American Silver Eagle and Canadian Maple Leaf are popular among retail investors.
7. Platinum Market in Detail
7.1 Global Platinum Reserves
Concentrated in South Africa’s Bushveld Complex and Russia.
Major companies: Anglo American Platinum, Impala Platinum, Norilsk Nickel.
7.2 Industrial Usage
Catalytic Converters: Critical in reducing vehicle emissions.
Fuel Cells: Platinum is a core catalyst in hydrogen fuel cell vehicles.
Jewelry: Particularly popular in Asia and Western luxury markets.
Medical Applications: Stents, pacemakers, anti-cancer drugs.
7.3 Market Challenges
Dependence on South Africa creates supply risk.
Competition from palladium in catalytic converters.
Transition to electric vehicles (EVs) may reduce demand for platinum in traditional auto markets, though hydrogen fuel cells could offset this.
8. Other Precious Metals Worth Noting
Palladium: Used in catalytic converters, often more expensive than platinum.
Rhodium: Scarce and extremely valuable, also used in emissions control.
Iridium & Ruthenium: Used in electronics, alloys, and chemical catalysts.
9. Role in Global Financial System
9.1 Safe-Haven Asset
During crises (e.g., 2008 financial crash, COVID-19 pandemic, geopolitical conflicts), investors flock to precious metals as protection against inflation and market instability.
9.2 Central Banks
Unlike gold, silver and platinum are not majorly held in central bank reserves. However, their role in private investment portfolios is rising.
10. Future Outlook
10.1 Silver
Growth in green energy (solar, EV batteries) is expected to boost demand.
Increasing use in electronics and medical tech will support prices.
Long-term investment appeal remains strong, though volatility will persist.
10.2 Platinum
Growth in hydrogen economy is the biggest opportunity.
Jewelry demand may grow in Asia, though automotive demand faces structural shifts with EVs.
Supply risks in South Africa could drive periodic price spikes.
10.3 Broader Precious Metals
The transition to a low-carbon economy is expected to keep demand high for platinum group metals (PGMs) and silver. Scarcity and recycling efficiency will shape market stability.
Conclusion
The silver, platinum, and precious metals market is a fascinating mix of luxury, technology, and geopolitics. Unlike gold, which is primarily an investment vehicle, silver and platinum straddle both worlds—acting as a hedge against inflation while also being indispensable for modern industries.
In the decades ahead, climate change policies, green energy adoption, and technological breakthroughs will reshape demand patterns. Silver will thrive with solar and electronics, while platinum’s future will depend heavily on hydrogen fuel cells and sustainable industries.
For investors, traders, and policymakers, understanding these dual roles is crucial. Precious metals are not just shiny relics of the past—they are strategic resources of the future.

Can ETH make it out of this clearly defined correction range?
Excuse my mic quality, my Airpods highjacked my audio 🥹
If you can still understand what I'm saying, please let me know if I missed anything and what you think about this range. Thanks 🫡

Ether projection 2025
Ether may hit all time high this week($5k). Price made clear market shift and pulled back to a demand zone where it met bullish order block and fair value gap where it will start buying. Also, dollar index has shown weakness which will give power to all dollar paired asset.
#Eth
#Btc
#Altcoin
#Cryptonews
#cryptotrading
#Cryptocurrency
#Tradertinomars

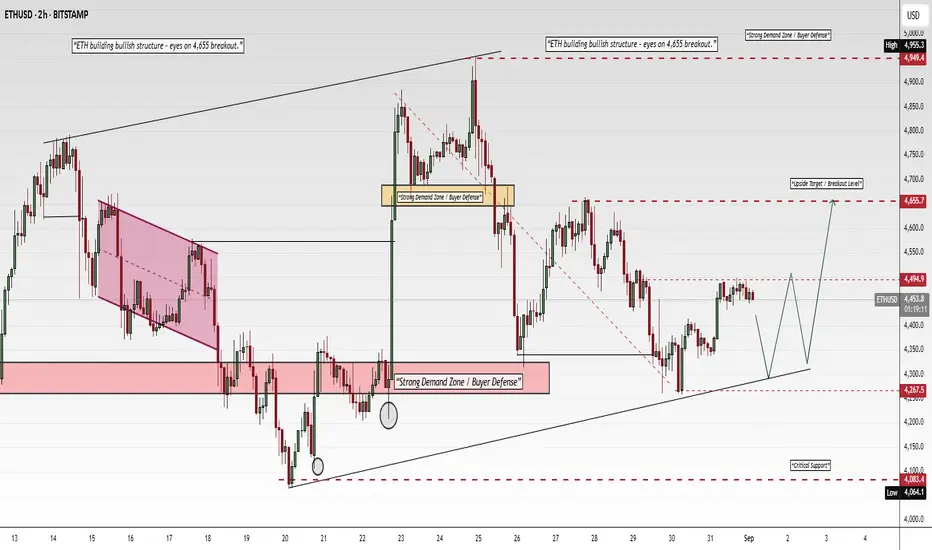
ETHUSDT (2H) – Bullish Structure Intact, Eyeing BreakoutBITSTAMP:ETHUSD
Structure | Trend | Key Reaction Zones
ETH continues to respect higher demand zones 🟢 with buyers defending 4,267 strongly. Resistance 🔴 sits at 4,655 and higher at 4,949, forming the next breakout levels. The trend structure remains bullish as long as demand holds.
Market Overview
ETH has been consolidating within a rising bullish structure after rejecting lower levels near 4,267. Buyers remain active, and price is pressing higher toward resistance. A successful breakout above 4,655 could open the path to 4,949. However, failure here may trigger another dip toward demand before continuation.
Key Scenarios
✅ Bullish Case 🚀 → Break above 4,655 confirms upside.
🎯 Target 1: 4,800
🎯 Target 2: 4,949
❌ Bearish Case 📉 → Rejection from resistance and break of 4,267 demand zone.
🎯 Target 1: 4,200
🎯 Target 2: 4,083
Current Levels to Watch
Resistance 🔴: 4,655 → 4,949
Support 🟢: 4,267 → 4,083
⚠️ Disclaimer: For educational purposes only. Not financial advice.
ETH 1D – Testing ATH Resistance, Will Trendline Hold Ethereum is consolidating beneath the all-time high resistance at $4,844, with price respecting a strong ascending trendline support. A breakout above resistance could open the door to new highs, while failure here risks a retest of lower Fibonacci retracement zones.
Key levels to watch:
Resistance: $4,844 (ATH supply zone)
Support: Trendline currently near $4,400
Downside Fib Levels: $3,536 (0.5), $3,203 (0.618 golden pocket), $2,728 (0.786)
The Stoch RSI has reset into oversold territory, suggesting momentum could recharge for another leg higher — but the reaction at this resistance will be critical. A daily close above ATH confirms strength, while rejection could send ETH back into the Fib retracement zone.
Traders should watch for trendline breaks or daily closes above $4,844 for directional cues.

ETH SHORT RESULT ETH price formed an ascending channel at the supply zone and broke down which is from where I took the short and it moved down as predicted.
_THE_KLASSIC_TRADER_.💪🔥

Bearish Reversal?Ethereum (ETH/USD) is rising towards the pivot and could drop to the 1st support that aligns with the 161.8% Fibonacci extension.
Pivot: 4,862.36
1st Support: 3,853.80
1st Resistance: 5,225.73
Risk Warning:
Trading Forex and CFDs carries a high level of risk to your capital and you should only trade with money you can afford to lose. Trading Forex and CFDs may not be suitable for all investors, so please ensure that you fully understand the risks involved and seek independent advice if necessary.
Disclaimer:
The above opinions given constitute general market commentary, and do not constitute the opinion or advice of IC Markets or any form of personal or investment advice.
Any opinions, news, research, analyses, prices, other information, or links to third-party sites contained on this website are provided on an "as-is" basis, are intended only to be informative, is not an advice nor a recommendation, nor research, or a record of our trading prices, or an offer of, or solicitation for a transaction in any financial instrument and thus should not be treated as such. The information provided does not involve any specific investment objectives, financial situation and needs of any specific person who may receive it. Please be aware, that past performance is not a reliable indicator of future performance and/or results. Past Performance or Forward-looking scenarios based upon the reasonable beliefs of the third-party provider are not a guarantee of future performance. Actual results may differ materially from those anticipated in forward-looking or past performance statements. IC Markets makes no representation or warranty and assumes no liability as to the accuracy or completeness of the information provided, nor any loss arising from any investment based on a recommendation, forecast or any information supplied by any third-party.


ETH looks Bullish here 4458 gave a good buying pressureas you can see the resistance plays an important roll here.
as we saw ETH was strong at 4458 and it took a reversal from 4458 and now heading towards 4520 and completing its last wave.
BINANCE:ETHUSD


ETHUSD-SELL strategy 3D chart Reg. ChannelShort-term maybe slight upward pressure, but from a medium-term basis, I feel we may see $ 3,750 again. The indicators are negative, and there is room within the Reg. Channel to see lower over-time.
Strategy SELL $ 4,400-4,800 and take profit near $ 3,780 for now.
