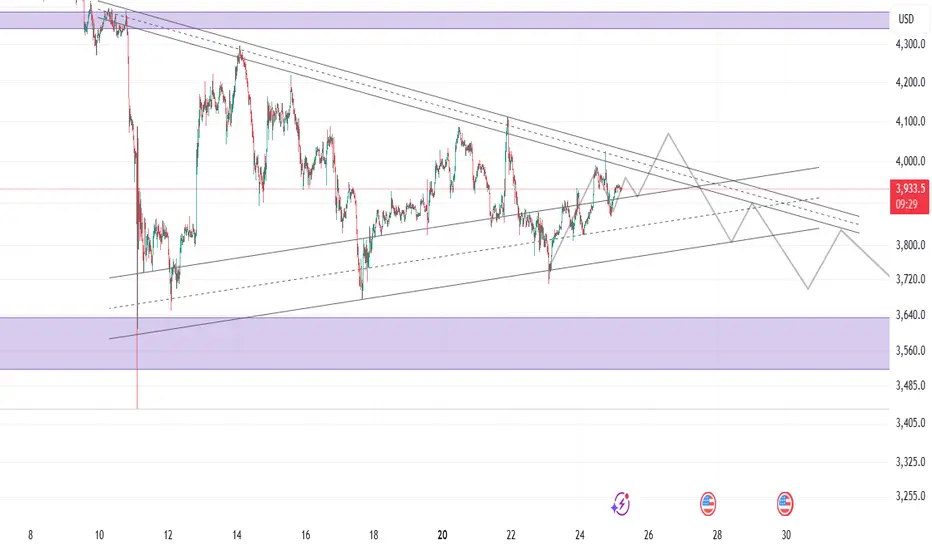
ETH UpdateBounced off support yesterday afternoon, probably goes up. That flat line is a weekend so it'll be in a different spot this time.
Trade ideas

Ethereum Short-Term Breakdown Imminent | ETHUSD Short Setup🚨 Ethereum (ETHUSD) Market Update – Short-Term Setup 🚨
Ethereum is displaying clear weakness on higher levels, as the recent bounce appears to be a relief move rather than a full trend reversal. The resistance zone between $4074 – $4175 remains crucial — price rejection from this area can offer a high-probability short opportunity.
We’re currently holding short positions from $3930, and if ETH extends upward, DCA shorts will activate near $4175 for a better average entry.
📉 Downside targets to watch:
🎯 $3750
🎯 $3636
🎯 $3540
🎯 $3480
Until a confirmed correction forms, avoid aggressive long setups. Market sentiment remains fragile, and bulls may face strong resistance around the upper range.
⚠️ Timeframe: 15-Minute (Scalp / Short-Term Setup)
💡 Tip: Manage risk carefully and trail stops as price moves in your favor.
📊 Follow me on TradingView for more real-time ETH and BTC updates, short-term scalps, and market breakdowns. Your feedback and comments are always welcome!
ETHUSD Ascending channel breakdown selling strong🚨 ETHUSD Technical Update 🚨
📉 Breakdown Alert!
ETHUSD has officially broken down from its ascending channel and key support area around $3,950 — signaling potential bearish momentum ahead.
💥 Selling Zone: $3,950
🎯 Technical Target: $3,700 (next major support zone)
📊 Indicators:
✅ EMA 50 breakdown confirmed — bearish bias strengthening.
⚠️ EMA 20 is crossing down toward the EMA 50, which could confirm further downside pressure.
🧭 Bias: Bearish below $3,950
💡 Watch for potential retests of the breakdown zone before continuation lower.
#ETH #Ethereum #CryptoAnalysis #TechnicalAnalysis #TradingSetup #BearishSignal 🐻📉

ETHEREUM (ETH/USD): Comeback? Eyes on $4300 Resistance.ETHEREUM appears to be showing some bullish signals following a test of a significant daily support level.
The price formed an inverted head and shoulders pattern on that, succeeded by a bullish breakout above its neckline, which is serving as a minor resistance, thereby confirming a local change of character.
Considering these factors, there is a possibility that the price of the coin could potentially rise to the $4300 level.

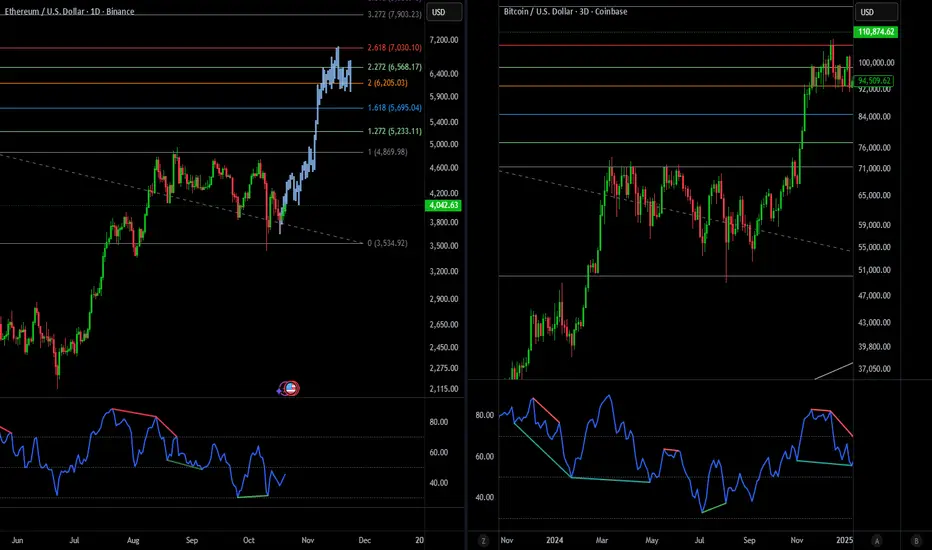
Same Pattern, 3x times fasterI can see a same pattern in #ETH in 2025 as #BTC played in 2024 but 3 times faster (1D timeframe vs 3D timeframe).
The target would be around 7000 in 30-35 days.

Momentum Cooling Off, Eyes on $3,700 Support ZoneETHUSD – Daily Chart | Momentum Cooling, Consolidation at Key Support
Market Context:
Ethereum’s daily chart continues to show a controlled consolidation after the strong rally earlier this quarter.
Price action remains confined between the $3,700–$3,850 support zone and $4,350–$4,450 resistance.
While sentiment across crypto remains moderately positive, short-term indicators suggest fading momentum and compression rather than a confirmed breakout.
________________________________________
Trend Structure:
The broader trend remains constructive, but recent daily candles have formed lower highs — suggesting a mild corrective bias.
As long as ETH holds above $3,700, the long-term structure stays intact; a break below would open the door for a deeper pullback toward $3,400–$3,600.
A decisive close above $4,450 would confirm renewed momentum and likely invite trend-following participation.
________________________________________
Moving Averages:
The 20-day EMA is flattening and currently near price — acting as short-term resistance.
The 50-day EMA sits slightly above, showing the market is still in a pause within its bullish structure.
The 100- and 200-day EMAs remain well below current levels, confirming the long-term trend remains intact.
________________________________________
Momentum Indicators:
RSI (14): hovering around 45–48, reflecting neutral-to-slightly-bearish momentum. A reclaim above 55 would indicate buyers returning.
MACD: histogram narrowing, signal lines converging — momentum cooling but not yet reversing.
Stochastic RSI: mid-range, curling upward — early sign of potential energy buildup.
ADX (14): around 20–25, suggesting weak trend strength; look for ADX rising above 25 for confirmation of direction.
ATR: contracting steadily — volatility compression often precedes expansion.
________________________________________
Key Levels:
Resistance: 4,350–4,450 — multi-touch supply zone.
Next Resistance: 4,600–5,000 — major breakout region if momentum builds.
Support: 3,700–3,850 — critical daily support, repeatedly defended.
Secondary Support: 3,400–3,600 — previous accumulation area.
________________________________________
Indicator Summary:
RSI & Stoch RSI → Neutral; momentum reset after an overbought phase.
MACD → Flattening; no strong divergence, just cooling momentum.
ADX → Low; confirming a sideways, non-trending environment.
EMAs → Flat; short-term equilibrium within a long-term bullish trend.
Volume → Gradually declining on dips, suggesting no panic selling.
________________________________________
Outlook:
Ethereum’s daily chart reflects a classic consolidation within an ongoing uptrend.
Until price closes firmly beyond either $4,450 or $3,700, traders should expect range-bound action and momentum-reset conditions.
The next significant move is likely to align with an RSI breakout above 55 , MACD expansion , and a rising ADX above 25 — all signaling renewed directional strength.
________________________________________
Summary:
ETH remains structurally bullish on higher timeframes, but short-term momentum has cooled.
Volatility compression, neutral oscillators, and flattening EMAs define a market gathering energy for its next impulsive phase.
As long as $3,700 holds, the broader outlook stays constructive — this is the “calm before expansion”.

ETHUSD H1 | Possible Bearish Turn Ahead”ETH/USD is rising towards the sell entry, which is a pullback resistance that is slightly above the 50% Fibonacci retracement and could reverse from this levle to the downside.
Sell entry is at 3,936.30, which is a pullback resistance that is slightly above the 50% Fibonacci retracement.
Stop loss is at 4,079.07, which is a pullback resistance.
Take profit is at 3,703.89, which is a multi-swing low support.
Stratos Markets Limited (tradu.com ):
CFDs are complex instruments and come with a high risk of losing money rapidly due to leverage. 68% of retail investor accounts lose money when trading CFDs with this provider. You should consider whether you understand how CFDs work and whether you can afford to take the high risk of losing your money.
Stratos Europe Ltd (tradu.com ):
CFDs are complex instruments and come with a high risk of losing money rapidly due to leverage. 70% of retail investor accounts lose money when trading CFDs with this provider. You should consider whether you understand how CFDs work and whether you can afford to take the high risk of losing your money.

ETH/USD: Is Ethereum Entering Wave V or Preparing for a ReversalETH/USD: Is Ethereum Entering Wave V or Preparing for a Reversal?
Weekly Scenarios
Bullish scenario: ETH holds the $3,800 level, breaks $4,500 → target near $5,000.
Consolidation: The price fluctuates between $3,800 and $4,500, preparing for the next move.
Bearish scenario: Break of support at $3,800 with volume → possible decline to $3,400–$3,600.
✅ Conclusion
The weekly analysis of ETH/USD shows that the market is at a key point: either the final uptrend is starting, or a correction is forming.
Holding support near $3,800 is the main bullish signal.
Break of resistance at $4,500 is the start of a rally.
A break below $3,800 is a signal for caution and a possible decline.

Ethereum Buying OpportunityGold has seen a massive decline, and capital often seeks new strongholds during such shifts. With investors moving away from metals, crypto — particularly Ethereum — looks like an attractive alternative.
From a technical standpoint, ETH has experienced a healthy correction and is now forming a bullish wedge pattern, hinting at potential upside momentum. The structure suggests that accumulation is taking place before a possible breakout.
If the price breaks and holds above the upper trendline, a strong rally could follow, offering a potential 25% upside from current levels.
📈 Target zone: Around $4,713
💡 Setup bias: Bullish continuation after consolidation
Ethereum’s blend of solid fundamentals, renewed investor attention, and technical setup could make it one of the top assets to watch in the coming days.

ETH/USD – The Next Big Move Is Loading!Ethereum is setting up for a potential massive bullish reversal after finding strong support at a key demand zone (green box).
📊 Here’s my breakdown:
Demand Zone (Buy Area): 3,600 – 3,700
Target Zone (Sell Area): 4,350 – 4,400
Bias: Bullish — price is likely to tap into the demand zone before pushing upward.
Confirmation: Watch for bullish rejections or strong momentum candles from the green zone.
🧠 This setup aligns with previous liquidity sweeps and market structure shifts, showing clear signs that smart money may be reloading before the next leg up.
🔥 My Plan:
Waiting for a clean bounce from the green area → confirmation entry → target red zone.
💬 What do you think — will ETH respect the zone or break lower first?
Drop your view below 👇
⚠️ Not financial advice — for educational purposes only.
📈 Like & comment “ETH TO 4.4K 🚀” if you’re watching this move too!

$eth 15 min , new york setup 🧠 Session-Based Liquidity & Manipulation
Asia low was swept — liquidity grab confirmed.
Price is now stabilizing above the Alligator, signaling potential reversal.
🐊 Bill Williams Alligator Signal
Alligator is coiling and turning up — bullish awakening in progress.
Price holding above lips/teeth supports long bias.
🎯 Corrected ETHUSD Trade Plan – Long Setup
Entry Zone: 3,846 – 3,850 (retest of Alligator support)
Stop Loss: 3,777 (below recent swing low — as per chart)
TP1: 3,875 (first liquidity above)
TP2: 3,900 (next HTF level & Asia high)
✅ Confirmation Needed:
Bullish candle close above 3,850.
Hold above Alligator lips (~3,840–3,845).
Volume spike on the move up.
Bottom Line:
Asia low taken, manipulation complete.
Alligator supports bullish reversal.
Long above 3,846, stop below 3,777.
— origami_capita133 | TradingView
👉 Like & Follow if this helps your trading. Trade with discipline, not emotion.

$ETH Retest completed, now It's time to run.The downtrend from the November 2021 peak has broken and is in a retest phase.
Ethereum is no longer in a "rejection" phase, but in a "retest" phase.
Next page \ price discovery.

Ethereum's Moment of Truth, Will the 3850 Support Hold?
ETHUSD is currently at a critical inflection point, testing the ascending trendline support which coincides with the 3850 to 3950 multiple retest zone.
A strong bounce from this support could lead to another test of the descending trendline resistance, with a breakout targeting the 4085 level and then the 4200 to 4300 strong resistance zone.
Conversely, a failure to hold this ascending support and a breakdown below 3850 would signal a bearish turn in the short term.
In the event of a breakdown, the price would likely seek lower support levels, with the next significant targets being the 3700 key level and then the key support near 3500.
Disclaimer:
The information provided in this chart is for educational and informational purposes only and should not be considered as investment advice. Trading and investing involve substantial risk and are not suitable for every investor. You should carefully consider your financial situation and consult with a financial advisor before making any investment decisions. The creator of this chart does not guarantee any specific outcome or profit and is not responsible for any losses incurred as a result of using this information. Past performance is not indicative of future results. Use this information at your own risk. This chart has been created for my own improvement in Trading and Investment Analysis. Please do your own analysis before any investments.

Ethereum Wave Analysis – 24 October 2025
- Ethereum reversed from support zone
- Likely to rise to resistance level 4095,00
Ethereum cryptocurrency recently reversed up from the support zone between the strong support level 3745.00 (which reversed the price multiple times this month) and the 38.2% Fibonacci correction of the upward impulse from June.
The upward reversal form this support zone is likely to form the daily Japanese candlesticks reversal pattern Morning Star – strong buy signal for Ethereum.
Given the clear daily uptrend, Ethereum cryptocurrency can be expected rise fall to the next resistance level 4095,00 (which stopped the previous correction ii).

bulish ETHafter breack this are 45% go up and aravei this price and now the price back to suport area and now wait for new target....

Eth Bullish Continuation IdeaEth bullish continuation idea. Buyers must recapture $3950 first and foremost. Eth is showing potential classic bullish divergence on both the MacD and RSI here on the daily time frame. It is in a well-established uptrend (not considering the most recent price action, where it has been consolidating for some time up here in the high $3k's - low $4k's). Let's see what happens. Easy to strategize an entry, stop loss, take profit(s) where you can take on minimal losses if it fails. kangz.

ETH UpdateETH seemed to be having issues holding on to gains today. Revised my plot.
CPI numbers tomorrow, so no positions. Crypto could possibly tank tomorrow if inflation is high. Conversely if CPI numbers are good then we'll see a bump up as shown.

RSI Never Lies🧠 RSI Never Lies
I believe the RSI indicator, especially on the daily timeframe, is the most powerful signal in the market.
Since the moment I noticed the bearish divergence on Ethereum, the price has dropped over 15%, even touching $3500.
I didn’t do anything special — I’m no fortune teller.
I just listened to my dear friend, RSI.
Now RSI is around 40 on the daily chart, which clearly suggests that the downtrend may continue.
#ETH #Ethereum #RSI #TechnicalAnalysis #TradingView #RMBS

ETH/USD (Ethereum to USD, 2-hour timeframe)...ETH/USD (Ethereum to USD, 2-hour timeframe) — here’s what’s shown and how to interpret it:
Current price: Around $3,885
The pattern: Symmetrical triangle — price consolidation before a breakout.
Breakout direction (based on my arrows): Upward (bullish bias).
📈 Target Points (as marked on my chart):
1. First target: Around $4,100
2. Second (main) target: Around $4,300–$4,320
These levels correspond to the blue arrows labeled “Target Point” — they reflect the projected breakout move from the triangle formation.
✅ Summary:
Entry zone (breakout confirmation): Around $3,950–$3,960 (above resistance line)
Target 1: ~$4,100
Target 2: ~$4,300
Stop-loss suggestion (if trading): Below $3,800 (triangle support)

Ether is a buy between 1300-1500!!This price point is significant as it aligns with Ethereum's previous highs from 2018, suggesting a potential support level. The occurrence of a monthly divergence indicates that selling pressure may be diminishing, potentially paving the way for a bullish reversal.
Looking ahead, industry projections are optimistic about Ethereum's future performance. Analysts anticipate that Ethereum could reach new all-time highs, with some forecasts suggesting prices exceeding $5,000 in the coming year.
From a fundamental perspective, Ethereum's transition to a proof-of-stake consensus mechanism has significantly reduced its energy consumption and introduced deflationary pressures on its supply. This shift, along with ongoing network upgrades, enhances Ethereum's scalability and security, reinforcing its position as a leading platform for decentralized applications and finance.
Furthermore, the approval of Ethereum-focused exchange-traded funds (ETFs) has opened new avenues for institutional investment, contributing to increased demand and potential price appreciation.
In summary, the current price dip presents a favorable buying opportunity, supported by technical indicators and robust economic fundamentals. With continued network enhancements and growing institutional interest, Ethereum's outlook remains positive.
Please note alot of these things can take time to reflect in price. So although some of these news are a few years long it does not make it any less impactful! Buy when there is blood on the street.

Comparison: Gold’s Triple Top vs. EthereumLet’s take a look at the charts. Gold formed a triple top before breaking out strongly, and the current Ethereum structure looks strikingly similar, only moving much faster.
The gold chart you see here developed over 15 years, while Ethereum’s pattern has taken shape in just 4 years.
When a resistance level is tested multiple times, it often eventually breaks.
I’m sharing this analysis to help you recognize recurring patterns across markets. History doesn’t repeat itself perfectly, but it often rhymes.

EthereumETHUSD
- RSI - Divergence
- SSL
- Change of Characteristics
- Order Block
- Symmetrical Triangle as an corrective pattern in Short Time Frame
