Trade ideas

ETH Is Testing the 0.786 Level With DeM at ExhaustionETH is pressing into a major support cluster built from the July 2025 swing low and the readings on the RB DeM indicator are finally reaching exhaustion territory.
The DeM value sitting near 0.18 lines up with the 0.786 retracement of the entire July push which creates a high probability reaction zone.
✓ RB DeM showing deep exhaustion
✓ Price tapping the 0.786 fib from the July 2025 cycle
✓ Structure approaching a level where bigger players usually reload
If buyers defend this zone the next rotation upward could build quickly. I am watching for my RB Swing Setups algo to trigger once momentum shifts.
Full multi timeframe analysis and weekly setups are inside my newsletter.
Link in profile.

ETHUSD TRADING LEVELS#ETHUSD TRADING LEVELS by TrAdiNgSoLiDLeVeLs. Anyone can trade on both sides with a strict stoploss.
Thank You for your support.

ETHUSD oversold & bearish ?The ETHUSD pair continues to display a bearish outlook, in line with the prevailing downward trend. Recent price action suggests a corrective pullback, potentially setting up for another move lower if resistance holds.
Key Level: 2,914
This zone, previously a consolidation area, now acts as a significant resistance level.
A failed test and rejection at 2,914 would likely resume the bearish momentum.
Downside targets include:
2,476 – Initial support
2,400 – Intermediate support
2,330 – Longer-term support level
Bullish Scenario (breakout above 2,914):
A confirmed breakout and daily close above 2,914 would invalidate the bearish setup.
In that case, potential upside resistance levels are:
2,960 – First resistance
3,040 – Further upside target
Conclusion
ETHUSD remains under bearish pressure, with the 2,914 level acting as a key inflection point. As long as price remains below this level, the bias favours further downside. Traders should watch for price confirmation around that level to assess the next move.
This communication is for informational purposes only and should not be viewed as any form of recommendation as to a particular course of action or as investment advice. It is not intended as an offer or solicitation for the purchase or sale of any financial instrument or as an official confirmation of any transaction. Opinions, estimates and assumptions expressed herein are made as of the date of this communication and are subject to change without notice. This communication has been prepared based upon information, including market prices, data and other information, believed to be reliable; however, Trade Nation does not warrant its completeness or accuracy. All market prices and market data contained in or attached to this communication are indicative and subject to change without notice.

ETH USDHI GUYS.
we have reached take profit for scalpers.
we expect (Thursday , Friday) continuation sells on (HS PATTERN)
hopefully we shall start the RT SELL STRUCTURE SOON.

ETHUSD - Log Band IndicatorIndicator shows that the top band is being tested
Places in circles are of similar movement, both containing a retest of this line
I still believe in an alt szn
Weekly chart

ETH: major key levels!ETH:
.
Major key levels!
Wait for signals with low supply volumes at the bottom and reversal signals.
.
US STOCKS- WALL STREET DREAM- LET'S THE MARKET SPEAK!

ETH DCA Opportunities: Targeting the $2,900 Zone and FibonacciEthereum Breakdown: Fibonacci Retracements and Strategy-Validated Supports
Let's dive into Ethereum ( BINANCE:ETHUSD ).
Ethereum is approaching an interesting zone established from March to May last year, confirmed by both my indicators around $2,900 USD. Currently, it's nearing that same level, which converges with the range from our recent low at $1,300 to the high from a few weeks ago hitting the 0.618 Fibonacci retracement.
This positions the current zone as a prime area to initiate DCA entries for a better average price. If the price doesn't hold and breaks through, the next strategy-confirmed zones would be around $2,400 USD, followed by another at $1,600.
My approach uses custom indicators like Trend Force (TF) and Smart Money (SM) for these validations confluences between them provide the strongest signals, but single indicator confirmations can also be reliable.
Since my indicators are private and not visible here on TradingView, head over to my Substack for the full chart, including a longer timeframe view of previous signals and zones based on the strategy. There, you can also find my detailed strategy explanation to interpret the traffic signals easily.
Remember, I'm not a financial advisor, and this isn't investment advice—always do your own research. I'm just sharing my analyses derived from proprietary tools. If you'd like me to review a specific asset, let me know in the comments.

ETHEREUM Thoughts - Potential Bottom front running the majority CRYPTOCAP:ETH has experienced a blood bath this month but I believe a potential bottom could be forming here. It really relies on several factors:
- CRYPTOCAP:BTC
- NASDAQ:NVDA
- Market wide sentiment
However, through technical analysis and hours of staring at this chart the past few weeks, I am spotting some interesting signs of life for a true bounce. I detail those in my video.
Spoiler Alert: Looks like a STRONG BULLISH DIVERGENCE is forming on the CRYPTOCAP:ETH daily chart - lets pay attention and see if the NASDAQ:NVDA earnings affect the price like I think it may...

ETHUSD | 1-Hour Bullish Continuation Concepts: ICT | SMC | Bill Williams | RR > 2:1
ETH is setting up for a significant bullish move on the 1-hour chart. After a clear sweep of sell-side liquidity, price has shown strong displacement and is now coiling above a key support confluence, suggesting a continuation toward the range high is likely.
ICT & SMC Analysis:
Liquidity Sweep & FVG: The wick down to $3,069.1 constituted a clear sweep of sell-side liquidity. The powerful bullish candle that followed created a significant Fair Value Gap (FVG) and a Bullish Order Block.
Market Structure Shift (MSS): The break above the recent swing high at $3,090.9 confirmed a shift from a ranging/downward structure to a bullish one.
Mitigation & Retest: The current pullback is retesting the confluence of the FVG, the Order Block, and the Alligator, offering a high-probability long entry.
Bill Williams’ Alligator Confirmation:
The Alligator on the 1-hour frame confirms the bullish bias:
Lips (3,078.4) > Teeth (3,079.5) > Jaw (3,079.8)
The alignment is bullish, and price holding above the Lips indicates the trend is awake and active. We are looking for the next impulsive leg to begin from this support.
Trade Plan (1-Hour Setup):
🟩 Entry Zone: $3,077 - $3,082 (Confluence of FVG, Order Block, and Alligator support)
🔴 Stop Loss: $3,068 (Below the recent liquidity sweep low)
🎯 Take Profit: $3,258 (Major previous high and a key liquidity pool on the 1H/4H chart)

Ethereum Accumulates Below Key ResistanceFenzoFx—Ethereum remains bearish, trading near $3,078.00. Price is below $3,170.00, with a bearish fair value gap overhead and resistance at $3,371.00. Technical indicators show an oversold market with bullish divergence, and candlestick patterns suggest accumulation around this zone.
Despite the bearish setup, a short-term rise may occur to grab liquidity before the downtrend resumes. In this case, Ethereum could target the bearish gap and resistance at $3,371.00.

ETHUSD bearish continuation below 3,508 resistanceThe ETHUSD pair continues to display a bearish outlook, in line with the prevailing downward trend. Recent price action suggests a corrective pullback, potentially setting up for another move lower if resistance holds.
Key Level: 3,508
This zone, previously a consolidation area, now acts as a significant resistance level.
A failed test and rejection at 3,508 would likely resume the bearish momentum.
Downside targets include:
2,878 – Initial support
2,784 – Intermediate support
2,700 – Longer-term support level
Bullish Scenario (breakout above 3,508):
A confirmed breakout and daily close above 3,508 would invalidate the bearish setup.
In that case, potential upside resistance levels are:
3,590 – First resistance
3,665 – Further upside target
Conclusion
ETHUSD remains under bearish pressure, with the 3,508 level acting as a key inflection point. As long as price remains below this level, the bias favours further downside. Traders should watch for price confirmation around that level to assess the next move.
This communication is for informational purposes only and should not be viewed as any form of recommendation as to a particular course of action or as investment advice. It is not intended as an offer or solicitation for the purchase or sale of any financial instrument or as an official confirmation of any transaction. Opinions, estimates and assumptions expressed herein are made as of the date of this communication and are subject to change without notice. This communication has been prepared based upon information, including market prices, data and other information, believed to be reliable; however, Trade Nation does not warrant its completeness or accuracy. All market prices and market data contained in or attached to this communication are indicative and subject to change without notice.

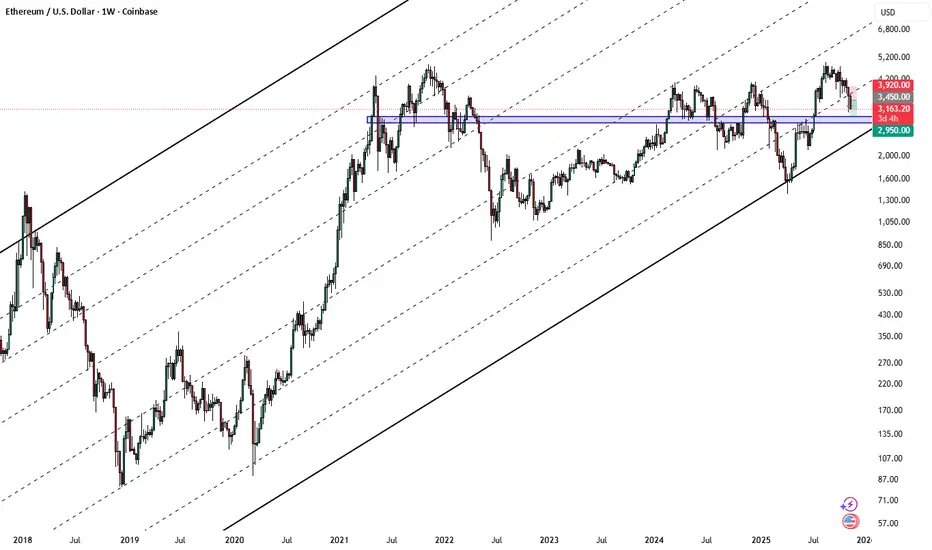
ETH/USD — Bearish Breakdown Toward 2,500 Ethereum extended its decline last week and broke below 3,125 (Murray ), updating the July low with a drop to 2,950. The market remains dominated by risk-off sentiment as the Fed signals the possibility of pausing rate cuts in December, geopolitical tension increases, and uncertainty around AI-driven tech investments grows.
The Fear & Greed Index sits at 11 (extreme fear), while ETF outflows intensified:
• ETH ETFs: –$1.4B (≈7% of AUM)
• BTC ETFs: –4%
On-chain activity also confirms weakening demand: ETH deposits fell 13% to a four-month low, and weekly DEX volume declined 27% to $17.4B.
The fundamental backdrop continues to favor the bears.
⸻
Technical Setup
ETH/USD broke below its descending channel and consolidated under 3,125, opening a clear path to deeper downside targets:
Bearish Structure
• Price trades below the mid-Bollinger band
• Bollinger Bands point downward
• MACD expands in the negative zone
• Stochastic remains flat inside oversold conditions
Unless ETH reclaims 3,750, the trend remains decisively bearish.
⸻
Key Levels
Resistance: 3,750 · 4,375 · 5,000
Support: 3,125 · 2,500 · 2,187
⸻
Trading Plan
🔻 Primary Scenario — SELL STOP
• Entry: 2,960
• TP1: 2,500
• TP2: 2,187
• SL: 3,300
• Bias: bearish continuation
• Timeframe: Weekly (5–7 days)
🔼 Alternative Scenario — BUY STOP
• Entry: 3,770
• TP1: 4,375
• TP2: 5,000
• SL: 3,360
• Bias: reversal only above 3,750
⸻
ETH remains in a strong downtrend after losing the 3,125 support zone. A move below 2,960 confirms continuation toward 2,500 → 2,187, while only a breakout above 3,750 would signal a potential trend reversal.

don't do (m)$ETH!IMO we are heading for the first neckline, as seen on the chart.
If it doesn't bounce there.. next neck line down below, and so on.
NFA, DYOR, for entertainment purposes only 🙄

ETH:USD When bottom?ETH is at a make or break area at the moment. $2870-$2950 is a super major support zone for ETH. If price wants to go down a bit more, then the 0.5 fib level at $2730-$2630 would be another very strong support. The last bit of support would be the golden zone area between $2270 - $2180. Elliott wave perspective, ETH might have come to a spot where no one would complain if it turned around from here. RSI is showing bullish divergence. We can make a case for a full 5 waves for C. If market has other ideas, then this could be a larger wave 3 for a nested 1/2, 1/2. If that is the case, then price might head down to the lower levels mentioned above. But, for now, it does seem like capitulation has taken place, and the sell pressure has peaked. Until price is above at least $4285, it can still be a larger AB with another leg down for C. Ideally, we would want to see another ATH with a complete 5 waves sequence up before we know for sure. My plan is to start nibbling ASAP to add back to my bag with a stop loss. When the sentiment is this bearish, it has always worked out, at least in the short term. If the minor Wave 2 is indeed over, then we should start prepping for massive fireworks. On macro cycle minor wave 3s are the strongest. We'll see how things go, but I am hopeful; until market decides to throw dirt in my eyes!

$ETHUSD: Riding the Lightning - The Short Trade is ActiveThe Trade is Active
Greetings, fellow navigators. The market has spoken, and our patience has been met with a trigger. The short setup we've been observing on BITSTAMP:ETHUSD is now live, with price having tagged our entry zone around the $4590 - $4600 level. If stopped out at 4800, we would be okay to re-enter, keeping the stop loss above the most recent swing high.
The thesis remains as discussed: after a powerful "inhale," the market appears to be taking a corrective "exhale." Price has broken the lower boundary of its immediate ascending channel, signaling a potential shift in short-term momentum. The plan is in motion.
Style: Short / Mean Reversion
Entry: ~$4590 (Active)
Stop Loss: ~$4814
Take Profit: ~$3000
Risk/Reward: Approximately 1 : 6.9
The Philosophy - A Word on Trading Crypto
To trade crypto is to engage with the market in its wildest form. It is the extreme sport of the financial world. The volatility here is a double-edged sword; it can carve out immense opportunity, but it demands the utmost respect and skill to handle without getting cut. Trying to catch a reversal in this space can feel like trying to catch a falling blade that has no handle.
This is why we don't "catch"; we plan. We define our risk before we ever enter. The "doctor's orders" for navigating this beautiful chaos are simple, but not easy:
A healthy dose of strategically placed stop losses.
A commitment to non-degenerate risk management.
A big smile, because the lessons learned here will forge you into a disciplined trader.
A Note on Your Well-Being
I speak of getting "cut" not to be grim, but to be real. This path can be intensely lonely, especially when the market delivers a harsh lesson. I've been there. If you are struggling, or ever lose more than you were prepared to, I want you to know that you do not have to carry that weight alone. Please reach out to someone.
Everything money can buy is cheap. You are priceless.
If you are struggling, you don't have to do it alone.
988 Suicide and Crisis Lifeline
Hours: Available 24 hours
Just shine.
Disclaimer: This is not financial advice. It is for educational and informational purposes only. Please conduct your own research and manage your risk accordingly.

MY MEDIUM TO LONG TERM VIEW ON ETHERIUM Dear Traders,
I have stayed long in this market to know the bigger picture and price action is KING. Whilst a lot of crypto traders believe that crypto is largely driven by fundamentals, I have seen different cycles to know that your ability to identify key levels and read price action correctly, whilst bringing in your understanding of MARKET STRUCTURE & PRICE ACTION with great knowledge of chart patterns for entry as well as how timeframe correlatives will help your winning rate significantly.
Whilst I believe that ETH may be overall bullish, I see some key support levels between $1,396 and $2,723 that tells me to be a bit more patient with early buy options. If price leaves me and makes a new high before getting to those level, I would let it go as that may mean that I am wrong. For now, I still feel there is a need for patience and waiting for confirmation to buy or sell.
Patience is a virtue in trading.

ETHUSD | Bullish H4 Countertrend IdeaHey Traders,
I'm not Eric Trump, but I think it's not a bad idea to buy ETH now... but you have to take profit quickly.
Because it's only a H4 countertrend , targeting the daily breakdown zone at (3,286.21-3,313.46) and the H4 breakdown and the daily pivot zone (3,374.89-3,400.46).
Invalidation: H4 Close < 3,166.30 (H4 pivot)
Better opportunities come when (and if) this bullish countertrend turns back, and the the bears may target the 3,000 level and the next target zone.
Stay disciplined!
Peter

ETH UpdateHey everyone,
so please see the green bull penant drawn on the closes, as you may notice, it has failed and is being broke back into.
Now, this is where I'd like to share a wild prediction. It will close above the green top rail for November, therefore keeping the pattern as valid.
This is why I say time frames matter, as false moves on patterns can be tricky on depending on the time frame the pattern is meant to hold on.
On weekly it looks disastrous, has cleanly closed below, but is that the correct time frame?
This is a game of chess, between yourselves and the market makers, the gods of this world. Therefore there is a layer of psychology. You need to know what is going to happen, to play this correctly.
If this fails to close above, I will put my hands up, but if it doesn't, understand this world has Gods, and there job is to take as much money from you as possible, and that's a dynamic you need to be able to play against, correctly.
Not financial advice.

Buy SetupWe have taken a Long position on ETHUSD target first red line where we take 50% profit and second red line we close the trade.

Ethereum Wave Analysis – 14 November 2025- Ethereum reversed from support zone
- Likely to rise to resistance level 3600.00
Ethereum cryptocurrency recently reversed from the support area between the support level 3090.00 (which stopped the previous impulse wave (C) at the start of November), 50% Fibonacci correction of the upward impulse from April and the lower daily Bollinger Band.
The upward reversal from this support zone stopped the previous medium-term ABC correction (2).
Given the strength of the support level 3090.00, Ethereum cryptocurrency can be expected to rise to the next resistance level 3600.00.

Global Soft Commodity Trading1. What Are Soft Commodities?
Soft commodities are agricultural goods used for food, textiles, beverages, and biofuels. They are classified into several broad segments:
a) Grains and Cereals
Wheat
Corn (maize)
Rice
Barley
These form the backbone of global food security and are traded extensively via futures contracts.
b) Oilseeds and Edible Oils
Soybeans
Palm oil
Sunflower oil
Rapeseed
These commodities are vital for cooking oil, animal feed, and industrial applications.
c) Tropical Products
Coffee
Cocoa
Sugar
Spices
Produced mostly in tropical regions, they are influenced by regional climate and weather events like El Niño and La Niña.
d) Fiber Commodities
Cotton
Rubber
Jute
Used primarily in textiles, manufacturing, and industrial processes.
e) Livestock and Dairy
Cattle
Hogs
Milk derivatives
These are essential for the food processing and meat industries.
2. Structure of Global Soft Commodity Trading
Soft commodity trading operates through two primary channels:
a) Physical (Spot) Trading
Involves buying and selling the actual agricultural product.
Participants include:
Farmers and cooperatives
Exporters and importers
Commodity merchants (e.g., Cargill, ADM, Bunge)
Food processing companies
Textile manufacturers
Physical trading focuses on logistics, shipping, storage, warehousing, and quality inspection.
b) Derivatives Trading
Soft commodities are widely traded on futures exchanges such as:
Chicago Board of Trade (CBOT)
Intercontinental Exchange (ICE)
NYMEX
Dalian Commodity Exchange (DCE)
Multi Commodity Exchange (MCX India)
Derivatives allow traders, corporations, and governments to hedge price risks or speculate on future price movements.
3. Key Players in the Soft Commodity Market
a) Producers
Countries in Latin America, Africa, India, China, and Southeast Asia dominate production. For example:
Brazil: coffee, soybeans, sugar
Ivory Coast & Ghana: cocoa
India: cotton, sugar, spices, wheat
China: soybeans, rice
b) Traders and Merchants
Large multinational firms manage procurement, logistics, and distribution networks.
c) Commodity Exchanges
Provide transparent pricing and risk-management tools for global participants.
d) Financial Institutions
Banks, hedge funds, and investment firms trade soft commodities for portfolio diversification and speculation.
e) End-Users
Food manufacturers, textile mills, beverage companies, and energy producers rely on stable supply.
4. Factors Influencing Soft Commodity Prices
Soft commodities are highly volatile because they depend on natural events and global economic fluctuations. Major price-moving factors include:
a) Weather and Climate
Extreme weather—droughts, floods, cyclones—can sharply reduce production.
Events like El Niño often disrupt supply chains worldwide.
b) Seasonal Cycles
Planting and harvesting seasons create predictable demand and supply patterns.
c) Geopolitics
Trade restrictions, sanctions, export bans, and conflict zones (like in the Black Sea region) significantly influence grain and oilseed prices.
d) Currency Movements
Most commodities are priced in USD, so a stronger dollar makes them more expensive for importing nations.
e) Supply Chain Disruptions
Port delays, shipping shortages, or logistical failures create shortages.
f) Global Demand Trends
Rising middle-class consumption boosts demand for:
Protein (livestock feed demand increases soy and corn usage)
Coffee and cocoa
Biofuels (palm oil, corn ethanol, sugar ethanol)
g) Government Policies
Minimum support prices, export taxes, and subsidies influence domestic and global markets.
5. Trading Strategies in Soft Commodities
Soft commodity traders use multiple strategies in derivatives and physical markets:
a) Hedging
Producers lock in prices to protect against volatility.
Example: a coffee farmer hedges future production by selling coffee futures.
b) Arbitrage
Traders exploit price differences:
Between markets (inter-market arbitrage)
Between expiration months (calendar spreads)
Between commodity grades (quality spreads)
c) Speculation
Traders take directional bets on future price movements based on:
Weather forecasts
Supply-demand data
Economic indicators
d) Spread Trading
Buying and selling correlated commodities:
Corn vs. wheat
Soybeans vs. soybean oil
e) Algorithmic and High-Frequency Trading
Increasingly used for short-term price anomalies.
6. Importance of Soft Commodity Trading in the Global Economy
a) Food Security and Stability
Soft commodities ensure availability of food grains and edible oils.
Their pricing impacts inflation, especially in developing countries.
b) Industrial and Manufacturing Input
Cotton, rubber, and other fibers support the textile and automotive sectors.
c) Employment Generation
Millions of farmers, traders, and logistics workers depend on agriculture.
d) Global Trade Balances
Major exporters—Brazil, Argentina, India, US—earn significant foreign exchange through soft commodity exports.
e) Price Discovery
Futures markets provide transparent global benchmarks that help governments and industries plan production and inventory.
7. Emerging Trends in Soft Commodity Trading
a) Sustainable and Ethical Sourcing
Consumers demand ethically sourced coffee, cocoa, and palm oil.
Traceability and ESG compliance are becoming mandatory.
b) Digital Farming and Smart Agriculture
Technologies like:
AI-based weather prediction
Drones and satellite imaging
Precision farming
These improve crop quality and supply forecasting.
c) Climate-Resilient Commodities
Investment is rising in drought-resistant seeds, alternative proteins, and regenerative agriculture.
d) Rise of Biofuels
Biofuel policies increase demand for:
Corn (ethanol)
Sugarcane (ethanol)
Soy/palm oil (biodiesel)
e) E-Trading Platforms
Digital trade platforms reduce intermediaries and streamline global trade.
8. Challenges in Soft Commodity Trading
a) High Volatility
Weather and geopolitics create unpredictable price swings.
b) Supply Chain Complexities
Quality inconsistencies, delays, and transportation losses can impact pricing.
c) Regulatory Changes
Sudden export bans (as seen with wheat, sugar, or rice) disrupt global markets.
d) Climate Change
Rising temperatures threaten yields and increase production risks.
e) Financial Constraints for Farmers
Small farmers in developing nations lack access to credit and hedging tools.
Conclusion
Global soft commodity trading plays a vital role in ensuring global food availability, supporting manufacturing industries, and stabilizing economic systems. It connects farmers to international markets, provides effective price discovery mechanisms, and helps manage risk through futures trading. However, the market is highly sensitive to weather, geopolitics, and global economic shifts.
With rising concerns around sustainability, digital transformation, and climate impacts, soft commodity trading is evolving rapidly. Countries and corporations that adapt to these changes—through better risk management, technology adoption, and sustainable practices—will shape the future of global agricultural trade.

$ETH following my macro planCRYPTOCAP:ETH is following my macro plan. I shorted it on the retest with a stoploss slightly above the highest wick of previous week. This was a simple 13% so far. This is why I like high time frame trading it shows you more than just noise on short timeframe charts.