Ethereum Wave Analysis – 31 October 2025- Ethereum reversed from support level 3800.00
- Likely to rise to resistance level 4200.00
Ethereum cryptocurrency recently reversed from the key support level 3800.00 (which has been reversing the price from the start of October) intersecting with the support trendline of the daily down channel from August and the support trendline from June.
The upward reversal from the support level 3800.00 stopped the previous short term correction ii – which is a part of the impulse waves 3 and (3).
Given the clear daily uptrend, Ethereum cryptocurrency can be expected to rise toward the next resistance level 4200.00, which stopped the previous waves 1 and i.
Trade ideas

ETHUSD Neutral bias remains intact above 3,723The ETHUSD remains in a neutral trend, with recent price action indicating a corrective pullback within the broader trading range.
Support Zone: 3,723 – a key level from previous consolidation. Price is currently testing or approaching this level.
A bullish rebound from 3,723 would confirm ongoing upside momentum, with potential targets at:
4,020 – initial resistance
4,118 – psychological and structural level
4,210 – extended resistance on the longer-term chart
Bearish Scenario:
A confirmed break and daily close below 3,723 would weaken the bullish outlook and suggest deeper downside risk toward:
3,620 – minor support
3,520 – stronger support and potential demand zone
Outlook:
Neutral bias remains intact while the ETHUSD holds above 3,723. A sustained break below this level could shift momentum to the downside in the short term.
This communication is for informational purposes only and should not be viewed as any form of recommendation as to a particular course of action or as investment advice. It is not intended as an offer or solicitation for the purchase or sale of any financial instrument or as an official confirmation of any transaction. Opinions, estimates and assumptions expressed herein are made as of the date of this communication and are subject to change without notice. This communication has been prepared based upon information, including market prices, data and other information, believed to be reliable; however, Trade Nation does not warrant its completeness or accuracy. All market prices and market data contained in or attached to this communication are indicative and subject to change without notice.

Triangle on ETHTrading in uncertain conditions, like when a triangle pattern appears on the charts, can be tricky. Such patterns often indicate consolidation, where price movement isn't clearly bullish or bearish.
Would you wait for a clear breakout from the pattern before taking a position ?

ETH Outlook after the Dip. What to expect NOW?Finally, the price broke the wedge, and the price experienced a significant drop. I think now is the time for ETH to rise again to 1900 . STRONG SUPPORT 1400 .
Give me some energy !!
✨We spend hours finding potential opportunities and writing useful ideas, we would be happy if you support us.
Best regards CobraVanguard.💚
_ _ _ _ __ _ _ _ _ _ _ _ _ _ _ _ _ _ _ _ _ _ _ _ _ _ _ _ _ _ _ _
✅Thank you, and for more ideas, hit ❤️Like❤️ and 🌟Follow🌟!
⚠️Things can change...
The markets are always changing and even with all these signals, the market changes tend to be strong and fast!!

ETH/USD | 1H Long SetupModels: ICT • SMC • Bill Williams
ETH swept liquidity beneath the SMT divergence low, tapping discount pricing and reacting strongly from a demand zone. Market structure shifted after the sweep, signaling accumulation and potential upside expansion.
The Alligator indicator shows the lips crossing upward — signaling the transition from compression to trend development, aligning with the bullish narrative.
✅ Trade Logic
ICT / SMC Confluence:
Sell-side liquidity taken below SMT divergence level
Bullish displacement breaking short-term structure
Return to mitigation block + FVG for entry
Price now operating above reclaimed structure
Bill Williams Confirmation:
Alligator waking up: green > red > blue
Early phase of new bullish wave
📊 Setup
Value
Entry 3,849
Stop Loss 3,676
Targets TP: 4,234 (buy-side liquidity pool)
RR ~4:1
🎯 Outlook
ETH is positioned for continuation if price sustains above reclaimed structure. Expecting continuation into premium levels and liquidity above 4.2K.
Smart Money Accumulation → Expansion Cycle underway

Bullish? Maybe This Will Change Your Mind About ETHHi guys,
This monthly inverse chart should make things clear to you that the market is about to crash hard!
Everyone is so bullish and Microstrategy just announced another BTC purchase which is a huge RED ALERT for all crypto investors.
Stay safe and let me know what do you guys think about this !

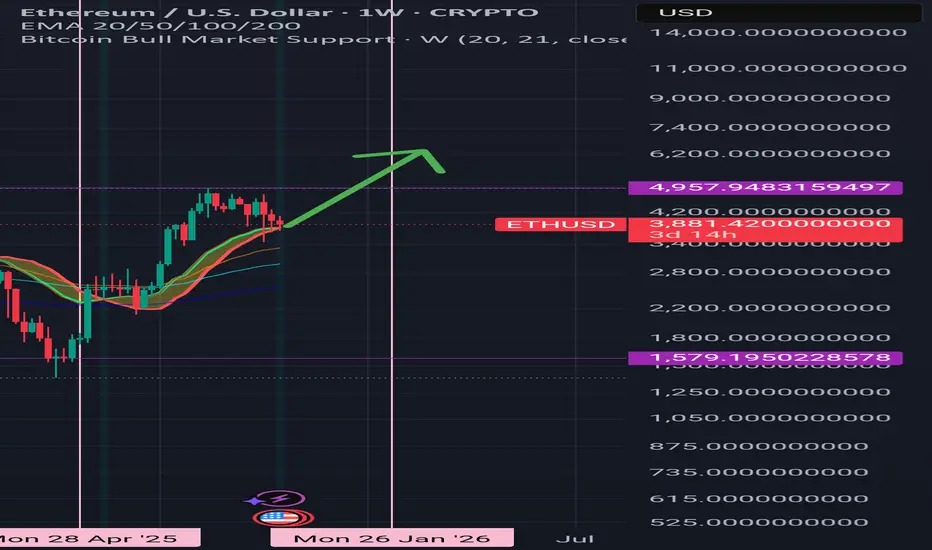
$ETH (DAILY): WAVE 5 to $5800+ likely NEXT?CRYPTOCAP:ETH has been stuck in this PIVOT ZONE around the $4,000 crucial SUPPORT/RESISTANCE level, and the whole #Altcoin world has been stuck with it.
We have just had another close below, but still above the $3,880 minor support (Fib 0.382 retracement level). If ETH can stay above $3.9K, that would be a HIGHER LOW after a minor HIGHER HIGH recently (rejected by the 50 MA), thus signaling a BULLISH MARKET STRUCTURE flip.
That’s the most likely scenario in my mind — I’ve been saying for a while that a WAVE 5 should be next, targeting $5,860.
In case of a flash crash (which I consider rather unlikely), I have my BUY LIMIT order ready between $3,330 and $3,551.
This sideways chop is coming to an end, surely — prepare for a bigger move in whichever direction.
200 MA at $3,320 — a BULL market coin, so the upside is much more likely.
👽💙

Ethereum Sellers Halt Breakout — But One Group Is Still Hopeful COINBASE:ETHUSD price failed to confirm its breakout as sellers rejected the move near $4,283–$4,326 — a dense supply zone that continues to block upside. The token has gained about 3.5% weekly but slipped over 2% in the past 24 hours, showing hesitation around key resistance.
COINBASE:ETHUSD remains inside a symmetrical triangle that has guided price since October 7. A breakout above $4,254–$4,395, confirmed by a 12-hour close, could trigger a short rally toward $4,500. Until then, the range stays neutral with immediate support at $3,918 and deeper protection near $3,711.
The RSI remains stable, but momentum shows fading strength near upper levels. A drop below $3,918 would weaken the pattern and invite further downside. On-chain data supports this caution: holder accumulation dropped 1%, and exchange outflows fell 43%, showing cooling demand. Still, smart money wallets have been adding since October 22, hinting at quiet confidence in a rebound.

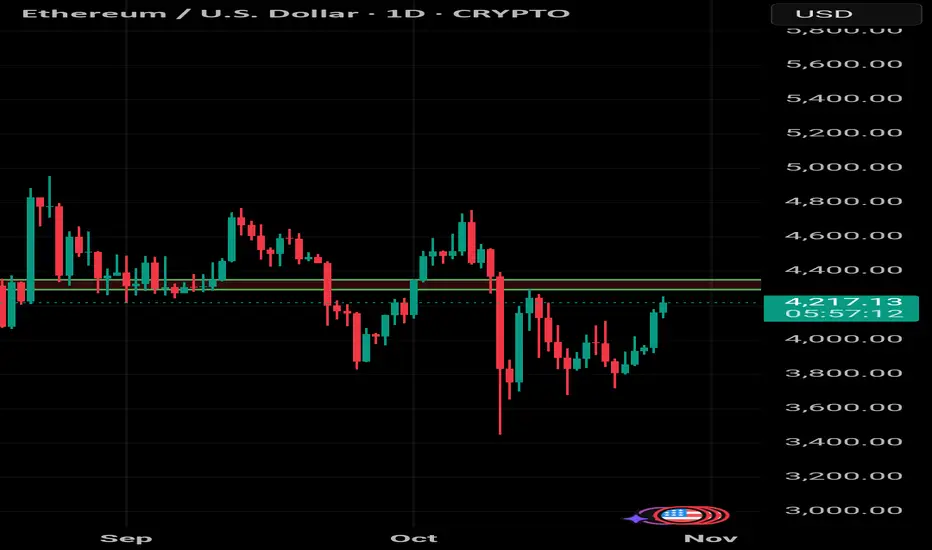
Ethereum Buying opportunity Previous week Ethereum closed above weekly resistance level $4093. Currently trading within a top range. ETH has decisively broken above the prior week's High, signalling continued bullish momentum. The probability of ETH retesting its previous all-time high of $4,951 in the near future is very high.

ETH Liquidity Zone in Focus: Stop-Runs & Fakeouts AheadETH has marked its bottom and is moving cleanly in an uptrend.
Now it gets exciting: the 4293–4350 USDT range is the decisive Liquidity Zone – this is where orders cluster, and where stop-runs and fakeouts usually happen.
eth long 15min -long The market is showing strength, trading above key dynamic support, and is poised for a potential continuation higher following a successful retest.
1. Bill Williams' Alligator: The Trend Framework
The Alligator indicator is giving us a crucial, albeit subtle, bullish signal.
The Setup: The lines are tightly coiled and bullishly aligned: the Lips (Green, 4,164.9) is above the Teeth (Red, 4,162.7), which is above the Jaw (Blue, 4,164.4). While the Jaw and Lips are nearly equal, the alignment is correct.
The Interpretation: This configuration suggests the Alligator is "awakening" from sleep. The tight coiling indicates a period of consolidation, often preceding a strong directional move. The fact that price is currently trading above all three lines is a sign of underlying bullish strength. The Alligator's "mouth" (the Teeth and Lips) now acts as a consolidated support zone.
2. ICT & SMC Concepts: The "Why" and "Where"
This framework helps us identify the strength of the move and key levels for continuation.
Market Structure Shift (MSS): The price has clearly broken above a previous significant swing high, shifting the structure from bearish to bullish.
Break of Structure (BOS): The push above the resistance zone (likely around the 4,200-4,225 area) was the BOS that confirmed buyer dominance.
Change of Character (CHoCH): The move up from the lows, breaking past key levels, represents a clear CHoCH, indicating a shift from sellers in control to buyers in control.
Current Retracement & Support Confluence: The price has pulled back from its high of 4,194.5 and is finding support precisely at a critical confluence zone:
The Alligator's Mouth (4,162 - 4,165): Dynamic support.
Previous Resistance Turned Support: The level around 4,177.6 and the general zone now acts as support.
Fair Value Gap (FVG): The chart is annotated with "4hr fys" (assumed to be FVG). This 4-hour FVG below the current price, if it exists in the 4,150 - 4,170 zone, would create a "liquidity vacuum" that price retraced to fill. This is a classic ICT setup for longs—price fills the FVG and then resumes the trend.
3. Synthesis: The Trading Plan for Followers
Here’s how it all comes together for a potential long entry or continuation:
The Trend (Alligator): The trend is turning bullish (Alligator awakening). We favor long setups.
The Retracement (ICT/SMC): The dip from ~4,194 to the current ~4,188 is a healthy retracement into a key confluence support zone.
The Confluence Support Zone: The 4,162 - 4,177 area is our High-Probability Buying Zone. This zone contains:
The entire Alligator indicator (dynamic support cluster).
A Previous Resistance level turned support.
A potential 4-Hour FVG.
Entry Trigger: We look for a bullish confirmation signal at this support zone. This could be a bullish engulfing candle, a strong rejection wick, or a simple momentum candle breaking back above 4,185.
Targets:
Immediate Target (T1): The recent high at 4,194.5. A break above this confirms continuation.
Next Target (T2): The swing high towards 4,225 - 4,250.
Expanded Target: The larger resistance zone near 4,295 - 4,325.
Invalidation: The bullish thesis is invalidated if price sustains a break below the entire Alligator support cluster, particularly the Jaw at 4,164.4, and more decisively below the 4,126.1 level. This would signal a failure of the breakout and a potential trap for buyers.

Ethereum's decision timeMy stance of course is I am embarrassed, but we have two scenarios here to play out in my opinion and it's quite clear what I have drawn here. I believe lower this week but only time will tell

ETHUSDETH is forming a bullish flag pattern on top of a resistance level. We still have everything in place for a big upward movement. November tends to be a period of accumulation, leading to an upward movement in December. In other words, BTC tends to rise. BTC is currently accumulating in the range of 106,500k to 122,500k.

technical analysis for your ETH/USD chart:Pair: Ethereum / U.S. Dollar (ETH/USD)
Current Price: around $3,931
Structure: Rising channel pattern
Key Zones:
Support Level: $3,850 – $3,880
Target Level: $4,120.70
📊 Technical Analysis
Trend Structure:
ETH/USD is currently trading within an ascending channel, reflecting a short-term bullish structure.
Price is consolidating just above the midline of the channel, suggesting a potential retracement before the next bullish leg.
Support Area Reaction:
The support level near $3,850 – $3,880 aligns with the lower channel boundary.
A possible pullback into this zone could act as a liquidity grab before a bullish continuation.
Bullish Scenario (Primary Expectation):
If price retests and holds above the support level, expect a rebound toward $4,120.
Confirmation: Bullish candlestick pattern or breakout above the local resistance around $3,970.
Bearish Scenario (Alternative):
A confirmed break below $3,850 could invalidate the bullish setup.
In that case, ETH could extend lower toward $3,780 – $3,750 support area.
⚙️ Trading Plan (Summary)
Direction Entry Zone Stop-Loss Target
🔺 Long (Buy) 3,850 – 3,880 Below 3,820 4,120
🔻 Short (Sell – only if breakdown) Below 3,850 Above 3,900 3,750
🧩 Technical Indicators (Implied)
Trend: Bullish structure intact within ascending channel.
Momentum: Neutral–bullish (possible short-term retracement).
Market Sentiment: Buyers maintaining control unless $3,850 breaks. NASDAQ:TSLA NASDAQ:NVDA NASDAQ:AMD NASDAQ:PLTR NASDAQ:META NASDAQ:MSFT NASDAQ:NFLX NASDAQ:INTC NASDAQ:BYND NASDAQ:MSTR

ETH Structure & Key LevelsChatGPT 说:
Structure & Key Levels
Mid-term structure: A fast rally followed by sideways consolidation; pullback from the right-hand high, then grinding up → retrace → range. Trend not confirmed—range trading remains the base case.
Key candles: Two extreme volume bars (one near the vertical marker, one near the right-hand close) both occurred near the lows, typical of capitulation/passive rotation. Price quickly snapped back afterward, indicating solid demand/absorption at the lows.
Support zones
$3,900–3,915: Range midpoint; multiple successful retests.
$3,860–3,880: Long-wick, high-volume “protection” area; a break turns the structure bearish.
Resistance zones
$3,965–3,985: Recent range highs/high-volume node.
$4,015–4,030: Prior selloff origin; first touch likely meets supply.
Price–Volume Read
During the advance, volume did not expand, suggesting short covering + seller exhaustion rather than fresh long participation.
Two high-volume down bars/long lower wicks were quickly reclaimed—buyers more active at lows.
As price entered $3,965–3,985, volume faded, implying weak chase; likely needs another shakeout or a volume push to break through.
Two Trading Playbooks
A) Range Reversion (primary for now)
Short trigger: Tap $3,965–3,985 and print an M5 false breakout + reversal BOS with sell-side expansion.
Targets: $3,935 → $3,915
Invalidation: A 15m close above $3,985 followed by a successful retest/hold—abort shorts.
Long trigger: Pull back to $3,900–3,915 with declining volume → bullish expansion, and reclaim McGinley/TWAP.
Targets: $3,955 → $3,980
Invalidation: A 15m close below $3,900.
B) Breakout Continuation (backup plan)
Upside: A decisive break and 15m close above $3,985 (ideally on rising volume). Buy the retest of $3,965–3,980 if it holds.
Targets: $4,015 → $4,030 (prior supply; scale out).
Downside: A clean break below $3,900 with a failed retest (rejection).
Targets: $3,880 → $3,860; if heavy volume persists, watch $3,825–3,835 as prior support.
$ETH (DAILY): DOWNTREND, yet still BULLISH, losing $4k SUPPORTThe most important chart for CRYPTOCAP:ETH is obviously the DAILY, and it looks like a correction (abc) is was completed on 10/10 when we witnessed a flash-crash to as low as $3450, perfectly in the middle of the SUPPORT ZONE ($3300 - $3600).
After this correction, we should see another surge in price, this would be WAVE 5, the last rally in this cycle, for sure. TARGETS start from $5861 (1.618 fib), and I consider this ELLIOT'S WAVE count to be a clean one, which means, more likely to materialize.
For now, it's been a struggle to stay above the key support/resistance level of $4k, still a DOWNTREND with a recent LOWER LOW followed by a sideways narrow chop.
200 MA at $3260 and upcurved, still a BULL MARKET coin. I'm on the sidelines until it either closes above $4100 or retraces back down by 10 or even 15%.
ETH v CRYPTOCAP:BTC on the WEEKLY, a rebound from the range bottom last APRIL, topped out in AUGUST at 0.0434, currently retracing to an important 0.0344 level, which MUST be hold to keep this year's momentum. Short-term BULLISH long-term BEARISH in relation to the KING.
💙👽

ETHShort term target for CRYPTOCAP:ETH is clearly $5200, as long as it can break out of the current resistance zone. The structure looks ready for the next leg up, with strong momentum building and buyers stepping in to push it higher.

ETHUSD: Swing LOWWave 1 completed ✅
RSI & EMA cross ✅
New S&R zone w. ATR✅
Just waiting for Trend Direction and Im Live!
Stay Tuned Prosperous Traders
and God Bless

ETHUSD: Last Wave of Impulse or Start of a Big Correction?Weekly Scenarios
Bullish scenario:
ETH holds above ~$3,800 and breaks resistance at ~$4,500 → wave factor (5) intensifies → possible rise to ~$5,000.
Consolidation:
The price remains between ~$3,800 and ~$4,500, forming a sideways range, accumulating energy for the next move.
Bearish scenario:
Breakdown of support at ~$3,800 with volume confirmation → corrective wave A-B-C begins → test of ~$3,400–3,600.
✅ Conclusion
ETH/USD is at a key point for the coming week: either the bullish upward momentum ends, or a significant correction begins.
Watch for support at ~$3,800 to hold—a breakout could very well change the direction of the movement.
If the resistance at ~$4,500 is broken, the upward momentum will activate.
Primary targets: ~$5,000 if up, ~$3,400–$3,600 if corrected.

#ETH/USDT : Another Attempt To Resume Upward Movement#ETH
The price is moving within a descending channel on the 1-hour frame, adhering well to it, and is heading for a strong breakout and retest.
We have a bearish trend on the RSI indicator that is about to be broken and retested, which supports the upward breakout.
There is a major support area in green at 3826, which represents a strong support point.
We are heading for consolidation above the 100 moving average.
Entry price: 3874.
First target: 3920.
Second target: 3969.
Third target: 4200.
Don't forget a simple matter: capital management.
When you reach the first target, save some money and then change your stop-loss order to an entry order.
For inquiries, please leave a comment.
Thank you.

Like clockwork....Holding the line above 3830.
Watch the volume and pump into Jan/Feb then we have cycle top, close down for 12 months.
ETH 1h Triple Bottom – Eyes on 4200 BreakoutThe Ethereum 1-hour chart displays a textbook triple bottom formation, with clear support established around the 3700–3750 level (see attached chart). This pattern emerged after multiple retests, indicated by green lines marking three distinct lows. The triple bottom suggests sellers may be exhausted and buyers are defending this zone.
Bullish divergence is also visible in both RSI and MACD indicators. Both momentum oscillators show higher lows, adding strength to the reversal signal. Price action remains inside a descending channel, but the repeated rejection from the green support zone and visible volume buildup increases the probability of a breakout.
If momentum continues, a successful rally could challenge overhead resistance at 4200, which coincides with previous range highs and a significant volume profile cluster. The red resistance zone is defined as the primary target area for longs. Should this level be breached, further upside will depend on market conditions and macro sentiment.
Trade Plan
Entry: Around 3760–3800 upon confirmed bullish reversal or close above channel resistance.
Take Profit: Primary target at 4200; partials recommended between 4100–4200.
Stop Loss: Below 3700, upon invalidation of the triple bottom.
Notes
Watch for confirmation and volume spike before entering. A failure to hold the green support invalidates the setup.
NFA.

ETHUSD – 1H Long Setup (SMC | ICT | Bill Williams Confluence)
Bias remains **bullish** after a clean sweep of **sell-side liquidity** and strong rejection from the demand zone. Price has confirmed a **break of structure** and is now reacting off a **breaker block** aligned with an **inverted fair value gap (IFVG)** — solid confluence for continuation.
### 🧭 Technical Breakdown
1. **Liquidity Sweep:** Price cleared out **sell-side liquidity** under the 3,800 zone — engineered liquidity before reversal.
2. **Breaker Block (BB):** FOR our entry
3. **IFVG:** Price filled the IFVG inside the BB and respected it perfectly, showing balanced re-pricing.
4. **Bill Williams Confluence:**
* Alligator lines tightening, signaling end of corrective phase.
* Price starting to trade above the green (lips) and red (teeth) lines — early signs of bullish acceleration.
5. **Structure Context:** Market structure shifted bullish on the 1H following the sell-side sweep and last week low being run.
### 📈 Plan
* **Entry:** From breaker block / IFVG confluence (3,800–3,830 zone).
* **Stop:** Below 3,713 (beneath liquidity low).
* **Targets:**
* 🥇 3,900 → intraday liquidity pool
* 🥈 4,020 → FVG fill above
* 🥉 4,090+ → 4H supply / OB
### ⚡ Bias
As long as ETH holds above the breaker block and 3,820 zone, I maintain **long bias** expecting expansion toward 4K+.
Classic **SMC + ICT synergy**: *Sell-side sweep → Structure shift → Breaker block + IFVG → Expansion*.
