ETH/USD — Downtrend Persists as Global Tensions MountETH/USD continues to trade under pressure, extending its medium-term downtrend. After a brief weekend rebound to 4062.50 (Murray , 23.6% Fib), the pair failed to hold above that level and resumed its decline on Monday.
Investors remain cautious as the U.S.–China trade conflict escalates. With President Donald Trump threatening 100% tariffs on Chinese imports ahead of his October 31 APEC meeting with Xi Jinping, risk assets — including crypto — remain vulnerable.
Adding to bearish sentiment, White House economic advisor Kevin Hassett said that U.S. government operations could resume soon, strengthening the dollar and weighing on alternative assets. The Fear & Greed Index stands at 34, reflecting weak confidence. Outflows from Ethereum ETFs reached $434.8M over the past three sessions, highlighting continued investor caution.
Overall, the fundamental backdrop favors further downside in the medium term.
⸻
Technical Analysis
ETH/USD remains in a downward channel, correcting against the long-term bullish trend.
• A break below 3750.00 (Murray ) could extend losses toward 3437.50 (Murray ), 3125.00 (Murray , 50% Fib), and 2720.00 (61.8% Fib).
• On the upside, a breakout above 4375.00 (Murray , mid-Bollinger Band) would invalidate the bearish setup and open the path toward 5000.00 (Murray ) and 5312.50 (Murray ).
Indicators:
• Bollinger Bands: turning downward — confirming continued bearish momentum.
• MACD: expanding in negative territory — sellers maintain control.
• Stochastic: pointing upward — short-term corrective bounce possible but limited.
⸻
Trading Plan
📉 Sell Setup
• Entry: 3750.00
• Targets: 3437.50 → 3125.00 → 2720.00
• Stop: 3975.00
📈 Buy Setup (Reversal)
• Entry: 4375.00
• Targets: 5000.00 → 5312.50
• Stop: 3960.00
⸻
Key Levels
Support: 3750.00 · 3437.50 · 3125.00 · 2720.00
Resistance: 4375.00 · 5000.00 · 5312.50
⸻
💬 ETH continues to trade within a bearish structure. A daily close below 3750 would confirm a deeper correction, while only a breakout above 4375 could revive bullish momentum toward 5000.
⸻
#ETH #Ethereum #ETHUSD #Crypto #TechnicalAnalysis #TradingView #FORECKINFO
Trade ideas

ETHUSD pivotal resistance at 3,960The ETHUSD remains in a neutral trend, with recent price action indicating a corrective pullback within the broader trading range.
Support Zone: 3,600 – a key level from previous consolidation. Price is currently testing or approaching this level.
A bullish rebound from 3,600 would confirm ongoing upside momentum, with potential targets at:
3,960 – initial resistance
4,077 – psychological and structural level
4,190 – extended resistance on the longer-term chart
Bearish Scenario:
A confirmed break and daily close below 3,600 would weaken the bullish outlook and suggest deeper downside risk toward:
3,520 – minor support
3,440 – stronger support and potential demand zone
Outlook:
Bullish bias remains intact while the ETHUSD holds above 3,831 A sustained break below this level could shift momentum to the downside in the short term.
This communication is for informational purposes only and should not be viewed as any form of recommendation as to a particular course of action or as investment advice. It is not intended as an offer or solicitation for the purchase or sale of any financial instrument or as an official confirmation of any transaction. Opinions, estimates and assumptions expressed herein are made as of the date of this communication and are subject to change without notice. This communication has been prepared based upon information, including market prices, data and other information, believed to be reliable; however, Trade Nation does not warrant its completeness or accuracy. All market prices and market data contained in or attached to this communication are indicative and subject to change without notice.

ETH USD HEAD AND SHOULDER PATTERNBear pattern on ETH
Look to retrace lower look for continuation before medium term outlook

ETHUSD Forming Bull Flag, Targeting $4,981 on BreakoutETH is forming a bull flag i.e. the uptrend is likely to resume
Execution
Wait for the breakout, enter if price decisively breaks above the upper flag trendline around $4,150. Avoid buying inside the flag
Take Profit
The pattern projects a target near $4,981
This is calculated by measuring the ~$800 "flagpole" rally and adding it to the breakout
Risk Mitigation
Place a stop loss just below $4,100 If price falls into the flag, the trade is invalidated

Could we see a bullish reversal?Ethereum (ETH/USD) has bounced off the pivot and could rise to the 1st resistance.
Pivot: 3,938.14
1st Support: 3,694.19
1sst Resistance: 4,279.64
Disclaimer:
The above opinions given constitute general market commentary, and do not constitute the opinion or advice of IC Markets or any form of personal or investment advice.
Any opinions, news, research, analyses, prices, other information, or links to third-party sites contained on this website are provided on an "as-is" basis, are intended only to be informative, is not an advice nor a recommendation, nor research, or a record of our trading prices, or an offer of, or solicitation for a transaction in any financial instrument and thus should not be treated as such. The information provided does not involve any specific investment objectives, financial situation and needs of any specific person who may receive it. Please be aware, that past performance is not a reliable indicator of future performance and/or results. Past Performance or Forward-looking scenarios based upon the reasonable beliefs of the third-party provider are not a guarantee of future performance. Actual results may differ materially from those anticipated in forward-looking or past performance statements. IC Markets makes no representation or warranty and assumes no liability as to the accuracy or completeness of the information provided, nor any loss arising from any investment based on a recommendation, forecast or any information supplied by any third-party.

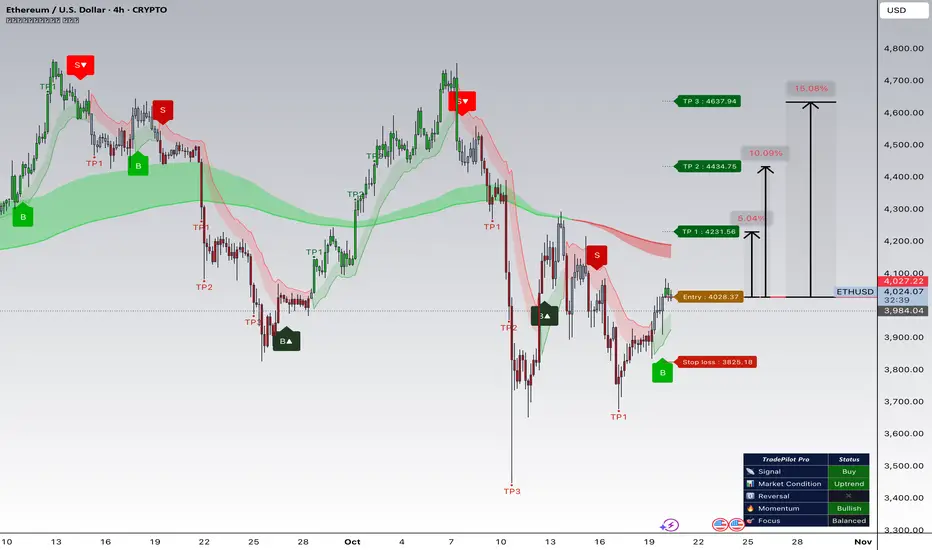
15min set Eth long if u missed ealier entry , ETH heavily retraced , forming 4hr smt , taking out liquidity
now our setup
Entry : 3982-3996
stop: 3922
tp: 4088
good RR
bais Bullish on higher timeframe

ETHUSD - September 11, 2025Bullish Breakout: A move above $4,541.6 could target $4,639.2.
Bearish Breakdown: A drop below both the trendline and $4,285.1 could lead to $3,870.5.
Sideways Action: The current consolidation range is between $4,285.1 and $4,541.6.

ETHUSD - Long - 4hr - Testing Ne AlgoTesting out a new Algo on ETH USD for the 4hr. points show to go long, will check in on this with in 2 weeks to see the progress
ETH Key LevelsCRYPTO:ETHUSD
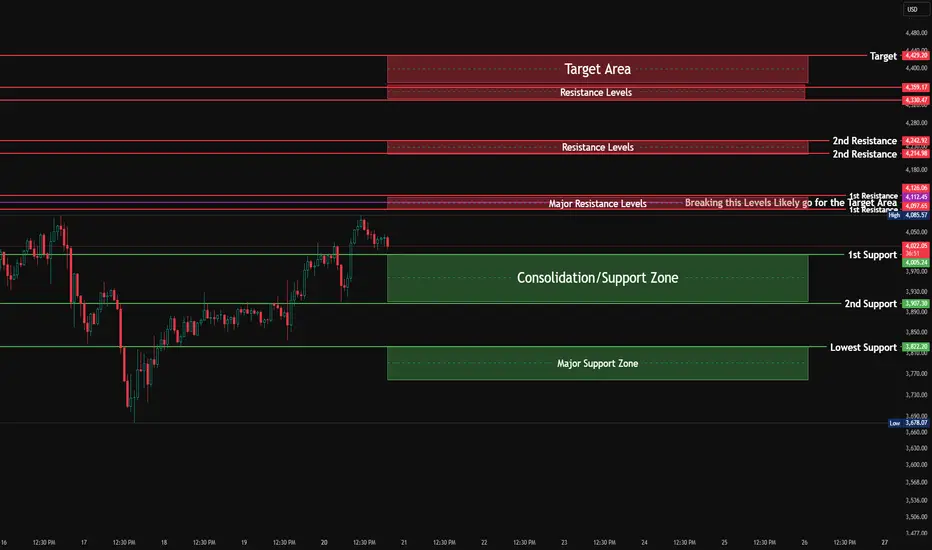
Market Analysis: ETH
Currently, ETH is trading just below a Major Resistance cluster around $4,077 – $4,126, after maintaining a strong short-term recovery from the recent lows. The market is consolidating within a defined structure, as shown by the Consolidation/Support Zone between $4,016 – $4,005, which now acts as the immediate base for buyers to defend.
This zone represents the equilibrium point for the current leg — holding above it keeps the short-term bias positive, while a breakdown could shift momentum back toward the 2nd Support region at $3,960 – $3,905.
The next key area to watch is the Major Resistance band between $4,077 – $4,126. This level has historically acted as both a strong reaction point and a liquidity pocket. A clear breakout above $4,126 with sustained volume and follow-through candles would likely open up the path toward the 2nd Resistance zone at $4,214 – $4,242, followed by the upper Target Area between $4,330 – $4,429.
The label “Breaking this Levels Likely go for the Target Area” perfectly highlights the market’s structural inflection point — crossing above this band signifies momentum continuation and confirms the strength of the ongoing recovery.
On the downside, the Major Support Zone between $3,823 – $3,822 remains the structural safeguard for ETH’s broader recovery setup. This area aligns with the 4H HTF Ray, indicating strong confluence between intraday and higher timeframe supports. A breakdown below $3,822 would invalidate the current bullish structure and expose ETH to deeper retracement levels.
As of now, ETH remains in a short-term consolidation phase under resistance, with price structure still constructive. Bulls are defending the lower supports effectively, and a breakout above $4,126 would confirm a shift from consolidation to expansion — targeting the $4,330 – $4,429 range as the next liquidity objective.
🧭 Summary:
Target Area: $4,429 – $4,330
2nd Resistance Zone: $4,242 – $4,214
Major Resistance Levels: $4,126 – $4,077 (Break and sustain above this zone likely triggers move toward the target area)
1st Support / Consolidation Zone: $4,016 – $4,005
2nd Support: $3,960 – $3,905
Major Support Zone: $3,823 – $3,822
Market Tone: Neutral-to-bullish; range-bound but holding above key support.
Bias: Bullish above $4,005; momentum confirmation above $4,126 may drive toward $4,330–$4,429.
Key Focus: Watch how ETH reacts around the $4,126 resistance — breakout strength here will determine if momentum carries to the target zone or fades back into the support band.

ETHUSD rebounding - Pivotal level at 3,960The ETHUSD remains in a neutral trend, with recent price action indicating a corrective pullback within the broader trading range.
Support Zone: 3,600 – a key level from previous consolidation. Price is currently testing or approaching this level.
A bullish rebound from 3,600 would confirm ongoing upside momentum, with potential targets at:
3,960 – initial resistance
4,077 – psychological and structural level
4,190 – extended resistance on the longer-term chart
Bearish Scenario:
A confirmed break and daily close below 3,600 would weaken the bullish outlook and suggest deeper downside risk toward:
3,520 – minor support
3,440 – stronger support and potential demand zone
Outlook:
Bullish bias remains intact while the ETHUSD holds above 3,831 A sustained break below this level could shift momentum to the downside in the short term.
This communication is for informational purposes only and should not be viewed as any form of recommendation as to a particular course of action or as investment advice. It is not intended as an offer or solicitation for the purchase or sale of any financial instrument or as an official confirmation of any transaction. Opinions, estimates and assumptions expressed herein are made as of the date of this communication and are subject to change without notice. This communication has been prepared based upon information, including market prices, data and other information, believed to be reliable; however, Trade Nation does not warrant its completeness or accuracy. All market prices and market data contained in or attached to this communication are indicative and subject to change without notice.

$ETH Macro unchangedNothing has changed for me on the CRYPTOCAP:ETH macro. The pullback was shallow for a wave 2 not even hitting the weekly pivot or 0.382 Fibonacci retracement. We expect wave 2 to be a sharper drop to at least the 0.382.
This has me skeptical about higher straight away without further downside.
If the bottom is in then wave 3 should kick in and be a powerful move into price discovery with initial target of the R5 weekly pivot $8500
Further downside should be expected as we are below major High Volume Node resistance, weekly RSI is bearish with rom to fall. The first target is the weekly pivot at $3200, followed by the rising weekly 200EMA, High Volume Node support and 0.5 Fibonacci retracement at $2600
Safe trading

SHORT ETH 4140. TGT 3800 STOP 4300. Playing this fib retracement bounce in Eth by shorting at 4140 with a target of 3800 and a stop at 4300. Thanks!

Eth updated308 stops updated….
She really struggled there on the 4k handle for closures… not too good…..
If she keeps this downside pressure, you will have to watch thyme entry point @ $3900s . If we close out respectively we could very well be on our way into $2800.
Let’s see!!! 🪐

ETHEREUM ON THE VERGE OF 5TH WAVE (of macro 3)As BTC will rise to between $120K to $125K to form a B wave, ETH will complete its 5th wave of the MACRO 3rd wave to ~$7000 to $8000.
The Ethereum price narrative of $10K to $12K, combined with the narrative of $185K BTC will create a euphoric nature in the market with a lot of long positions. This will create the perfect liquidity environment for Smart Money to sell - resulting in a 6 month bear market.

LONG ETHI think we've tested enough levels below for the next leg up. I've been long eth since 2500 or so, just added more on this dip (mostly in ETH and BMNR). I want to see a violent move to 4700+, just letting this thing run. I like the setup into early next year.

ETHUSD: Target Is Up! Long!
My dear friends,
Today we will analyse ETHUSD together☺️
The market is at an inflection zone and price has now reached an area around 3,988.4 where previous reversals or breakouts have occurred.And a price reaction that we are seeing on multiple timeframes here could signal the next move up so we can enter on confirmation, and target the next key level of 4,036.3.Stop-loss is recommended beyond the inflection zone.
❤️Sending you lots of Love and Hugs❤️

ARE NOT BULLISH ENOUGH ABOUT $ETH.ARE NOT BULLISH ENOUGH ABOUT $ETH.
In the 1st and 2nd cycles, Ethereum tested the major demand zone before going parabolic.
Today, the same scene is being re-enacted.
The difference is that most people still leave the theater before the curtain rises.

ETH Probable price movementAs it is clear on chart that price is respecting resistance channel
1. if price breaks and sustains above the channel price may push to upper levels
2. if price sustains further below the channel it may reach lower levels.

Eth long John’s As mentioned $4k+ in sight!!!!
NY active. And needs to secure daily closure in that range.
Will be its hurdle right now and needs attention!!!!
Stops are rolled!!! Goodnight and hopefully we wake up around $4245 on play. 🫡
Thanks for playing 🫡

ETH Long Position Earlier in the year Ethereum broke through its long term resistance, since then it has been consolidating. After 2 tags of the bull market support band it would be expected to move higher soon. 6900 fibonacci some profits could be taken and depending on how the price reacts hold the trade to 9-10k range. Good luck!

ETHEREUM HIGH PROBABILITY SETUP SOON!!! 🚨 ETHER HIGH PROBABILITY BUY SETUP 🚨
* Here We Can See Clearly The Next Potential Moves For ETHUSD Coming Hours/Days.
* Keep Your Eyes Close On Your Trading Positions.
* Happy PIP Hunting Traders.
FXKILLA.

Eth update.London active, Full positions tapped in….
Allow $3760 but also track the interactions we having for $3890z, this needs the closures above and we should be on road for $4245 📍
LFG!!!!!
