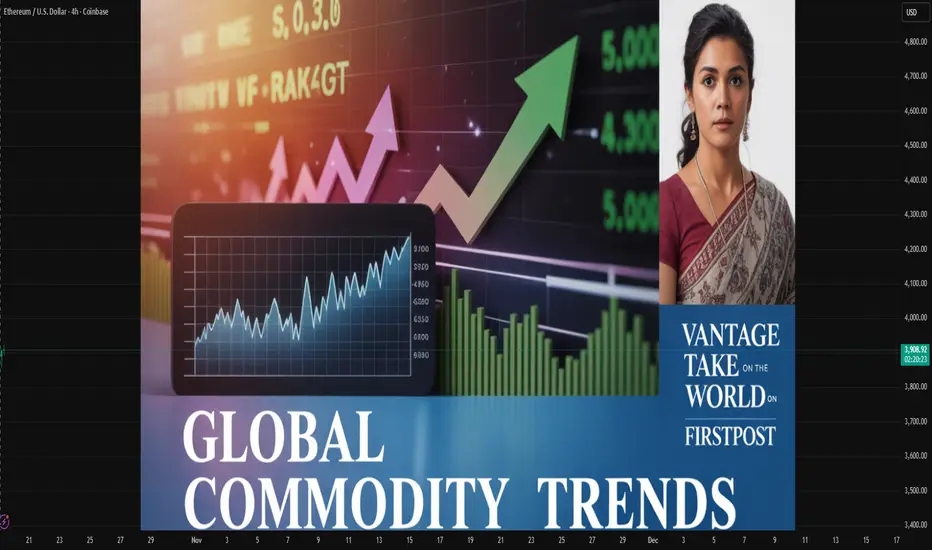
Global Commodity Trends: An In-Depth Analysis1. Overview of Commodity Categories
Commodities can broadly be categorized into three segments:
Energy Commodities – including crude oil, natural gas, coal, and renewable energy components.
Metal Commodities – comprising precious metals (gold, silver, platinum) and industrial metals (copper, aluminum, nickel, lithium).
Agricultural Commodities – such as grains, oilseeds, coffee, cotton, and sugar.
Each sector operates under different economic drivers but shares common threads: cyclical demand, global trade dependency, and vulnerability to geopolitical and climatic disruptions.
2. Energy Commodities: Shifting Power Dynamics
Oil Market Evolution
Crude oil remains the most influential commodity, dictating the rhythm of the global economy. After years of volatility, oil prices in 2025 have stabilized between $75–$90 per barrel, balancing between OPEC+ production controls and demand recovery in post-pandemic industrial economies. Key trends influencing the oil market include:
Geopolitical Tensions: Conflicts in the Middle East, Russia-Ukraine tensions, and sanctions have repeatedly disrupted supply routes and reshaped trade alliances.
Energy Transition: Many nations are reducing fossil fuel dependence, creating dual effects—investment withdrawal from oil projects and short-term supply tightness.
US Shale Resurgence: Technological improvements have revived U.S. shale production, moderating price spikes and diversifying global supply sources.
Natural Gas and LNG Boom
The liquefied natural gas (LNG) market has become a critical player in global energy security. Europe’s pivot away from Russian pipeline gas has spurred demand for LNG imports from the U.S., Qatar, and Australia. Asian markets—particularly India, Japan, and South Korea—are also expanding their LNG infrastructure. Prices remain elevated due to limited shipping capacity and long-term contract negotiations.
Renewable Commodities
The renewable sector is emerging as a commodity class of its own. Materials essential for wind turbines, solar panels, and batteries—like lithium, cobalt, and rare earth elements—are now strategically significant. Nations rich in these resources, such as Chile (lithium), the Democratic Republic of Congo (cobalt), and China (rare earths), have gained economic leverage in the green transition era.
3. Metal Commodities: Industrial and Technological Backbone
Copper: The ‘New Oil’ of Electrification
Copper is a vital indicator of global industrial health and the clean energy revolution. With rising demand from electric vehicles (EVs), grid expansion, and renewable infrastructure, copper prices have remained strong, hovering near $9,000–$10,000 per metric ton in 2025. However, supply shortages from major producers like Chile and Peru continue to pressure the market. Technological exploration and recycling have become key to meeting demand sustainably.
Aluminum and Steel: Industrial Expansion
Global infrastructure projects—particularly in India, Southeast Asia, and Africa—have driven demand for aluminum and steel. China’s gradual construction slowdown has been offset by growth in emerging markets. Decarbonization efforts have also led to “green steel” innovations, with major producers investing in hydrogen-based smelting technologies.
Precious Metals: Inflation Hedges
Gold remains a preferred hedge against inflation, currency devaluation, and financial instability. In 2025, gold prices are resilient around $2,100 per ounce, supported by central bank purchases and investor uncertainty about global debt sustainability. Silver, platinum, and palladium also benefit from industrial use in electronics, solar energy, and automotive catalysis.
Critical Minerals and Rare Earths
The rise of electric mobility and digital technologies has made critical minerals central to geopolitical competition. Nations are now securing mineral supply chains to reduce dependence on single-country producers. The U.S. and EU have launched strategic mineral alliances to diversify sourcing and encourage domestic mining.
4. Agricultural Commodities: Weather, Demand, and Technology
Food Security Challenges
Global food prices have experienced volatility due to extreme weather, conflict disruptions, and changing consumption patterns. Droughts in key grain-producing regions (such as North America and Australia) have tightened wheat and corn supplies, while El Niño weather patterns have affected rice production in Asia.
Grains and Oilseeds
Wheat and Corn: Prices remain firm as global demand for animal feed and biofuels continues to grow.
Soybeans: Driven by rising protein consumption in developing economies and biofuel production in the U.S. and Brazil, soybean demand remains robust.
Rice: Export restrictions by major producers like India in 2024–25 have kept rice prices elevated, intensifying food inflation pressures in Africa and Asia.
Soft Commodities: Coffee, Cocoa, and Cotton
Coffee and cocoa markets face supply disruptions due to unpredictable weather and labor shortages. Meanwhile, cotton prices have stabilized as global textile demand recovers post-pandemic. However, sustainability standards and organic production are reshaping trade patterns, with premium pricing for ethically sourced materials.
Technological Innovation in Agriculture
Precision farming, AI-driven weather forecasting, and genetically resilient crops are transforming agricultural productivity. These innovations aim to balance yield improvements with sustainability and environmental preservation, reducing the carbon footprint of global agriculture.
5. Geopolitical and Economic Influences
Global commodity trends are closely tied to geopolitics and macroeconomics. Several key developments have reshaped the landscape:
Trade Wars and Sanctions: The U.S.–China trade rivalry and sanctions on Russia and Iran have disrupted traditional commodity flows, leading to new alliances among BRICS nations.
Currency Movements: A strong U.S. dollar often suppresses commodity prices by making them costlier for non-dollar economies. However, increasing talk of “de-dollarization” could redefine commodity pricing in the long term.
Global Inflation and Interest Rates: Higher interest rates have tempered speculative investments in commodities, yet inflationary pressures from supply chain disruptions continue to sustain price floors.
Environmental Regulations: Climate policies and carbon taxes are influencing production costs and trade competitiveness, particularly in energy and metals sectors.
6. Technological and Structural Shifts
Digitalization and Smart Commodities
Blockchain and AI technologies are revolutionizing commodity trading systems. Digital platforms now enable transparent pricing, efficient logistics, and reduced transaction costs. Smart contracts in blockchain-based trade reduce fraud and enhance traceability from mines to markets.
Green Commodities and ESG Investments
Investors increasingly favor environmentally and socially responsible commodities. ESG (Environmental, Social, and Governance) frameworks are pushing companies to disclose emissions data, human rights practices, and sustainability metrics. This shift is influencing how commodity-backed financial instruments are structured and traded.
Automation in Mining and Logistics
Robotics, automation, and remote monitoring have transformed mining and shipping operations, reducing costs and improving safety. Autonomous drilling and AI-based maintenance systems enhance operational efficiency across industries dependent on raw materials.
7. Regional Insights
Asia-Pacific
Asia remains the largest consumer of commodities, with China and India leading demand for energy, metals, and food. India’s industrial expansion and renewable energy programs are reshaping regional trade flows. Southeast Asian nations are emerging as key exporters of palm oil, rubber, and rare earths.
North America
The U.S. and Canada benefit from abundant energy and agricultural resources. The shale industry revival and strategic mineral exploration position North America as a stable supplier amidst global uncertainty.
Europe
Europe’s energy diversification post-Ukraine war has accelerated investment in renewables, hydrogen, and circular economy practices. High carbon pricing has also made European industries more sustainable but less cost-competitive globally.
Africa and Latin America
These regions are rich in untapped resources, from lithium in Chile and Argentina to cobalt in the DRC and oil in Nigeria. However, political instability and infrastructure challenges hinder full potential. Strategic partnerships with China and Western investors aim to modernize extraction and processing industries.
8. Challenges Ahead
Despite progress, several structural challenges persist in global commodity markets:
Supply Chain Fragmentation: Geopolitical rivalries threaten trade connectivity.
Climate Risks: Extreme weather events continue to impact yields, mining operations, and energy supply.
Resource Nationalism: Governments are asserting greater control over natural resources, imposing export restrictions or windfall taxes.
Market Volatility: Speculative trading and financial derivatives amplify short-term price fluctuations, complicating investment planning.
Sustainability Pressure: Transitioning to low-carbon operations requires significant capital and policy alignment across nations.
9. The Future of Commodity Markets
Looking ahead to 2030 and beyond, the global commodity landscape is expected to be shaped by four major forces:
Energy Transition Acceleration: The world will see greater integration of renewables, hydrogen, and energy storage, reducing fossil fuel dependency but increasing demand for critical minerals.
Technological Integration: AI, blockchain, and predictive analytics will dominate commodity trading, making markets more transparent and efficient.
Sustainable Agriculture: Climate-resilient crops and smart irrigation will redefine global food systems.
Geopolitical Realignment: Multipolar trade networks among BRICS+ nations will challenge traditional commodity pricing systems dominated by Western economies.
Conclusion
Global commodity trends in 2025 reveal a dynamic interplay of energy transformation, technological evolution, and geopolitical recalibration. While oil and gas remain vital to short-term stability, the long-term trajectory points toward green minerals, digital commodities, and sustainable agriculture. The world is navigating a complex transition where supply chains, trade policies, and investment strategies must adapt to environmental and political realities. In essence, commodities have evolved from mere tradable goods into strategic instruments of power, policy, and progress. Managing this transformation with foresight, equity, and sustainability will define the resilience of the global economy in the years ahead.
Trade ideas
$ETH UPDATE: #Ethereum’s weekly candle is about to close below CRYPTOCAP:ETH UPDATE:
#Ethereum’s weekly candle is about to close below the $4,000 support, confirming the bearish outlook. As mentioned before, my stance remains bearish and you can see the same sentiment in my recent Bitcoin analysis as well.
The key support zone for ETH now sits between $3,500 and $3,300, around the 1W 50 EMA. If price fails to hold this area, the next downside targets will be $3,000 and $2,800. I’ll also be updating the Bitcoin weekly chart later today (Sunday) to track how both charts align in this bearish setup.

$ETH/USD Weekly backtesting breakout point$ETH/USD looks like it backtested the break out line. There were 4 waves from this year's low and we're in Wave 4. This 4th wave has retraced 50% of Wave 3.

ETH Daily RSI and Downward ChannelEth daily chart analysis
Back in March–April 2025, ETH’s RSI hit 30 (oversold) and then dipped lower to 25 about ~38 days later.
That move marked the bottom of the previous downtrend from the $4,000 all-time high.
Currently, ETH is again in a descending channel after reaching a new high around $4,900.
The RSI just touched 30 once more, similar to the pattern from earlier this year.
If the same RSI rhythm repeats (~38 days between dips):
A second RSI dip below 30 could appear within the next ~14 days.
Price may reach the $3,500–$3,300 zone if the channel holds.
If price breaks below channel support, potential extended downside targets sit around $2,800–$2,100 (the boxed zone).
If ETH breaks upward from the channel
A break above ~$4,000 with volume and it holds there could signal a potential trend reversal. Also watching a bullish divergence forming
This could confirm a breakout from the descending structure, shifting momentum back to the bulls.
In that case, ETH may look to retest the $4,900 all-time high and possibly extend to new highs if momentum sustains.
Final Thoughts:
ETH is at a technical crossroads — a confirmed channel breakdown could bring one last flush lower, but a breakout above $4K may mark the start of a new bullish leg. I'm watching RSI behavior and channel boundaries will be key in timing my next major move.
Good luck.

ETH longsQuick one here for Eth. Currently positioning in and looking for full targets @ $4580.
Super crucial where it stands right now and I’m looking to take up full positions at $3830.
If she can come in entry point and flip out the handle we are currently on with sustained closures, we should have zero problems here making a stand on $4240+…..
Definitely can’t afford to hold below $3890-900 for the first half of this day., and recent lows need to remain intact, therefore I will only allow 1 3hr closure if the stop level has interactions.
LFG People!!!! 🪐

Broken out of the descending channelThe only way is up from here, but that goes slower than expected.


ETHUSD 1D Analysis: Back to the 0.618 fib after ATH rejection?ETH seems to have been rejected at ATHs, with a consequent break of trend diagonal, it's retest and rejection.
The chart reflects a bearish divergence between price and momentum indicators, suggesting a possible trend reversal for ETHUSD in the coming months. The RSI shows a lower high while price made a higher high, indicating weakening buying pressure. Similarly, the MACD’s lower high echoes a loss of momentum, confirming the divergence signal.
The main daily chart displays a breakdown of the multi-month uptrend, as the price violated its rising support line around the end of September 2025. This technical break is reinforced by the outlined Fibonacci retracement levels, providing reference points for potential support and resistance zones. The red projection line anticipates further downside, aligning with the negative momentum seen in RSI and MACD.
Price targets for the projected short setup are highlighted by the green box between the $2,150 and $2,600 zone, where historical volume and Fibonacci confluence may offer stabilization. A broader target extends as low as $1,650 if bearish momentum intensifies, while resistance on any bounce exists near $3,200 and $3,850.
Trade Idea Summary:
Bias: Bearish, following uptrend break and momentum divergence.
Entry range: On confirmed retest and rejection of the broken trend line or key resistance ($3,200–$3,850).
Profit targets: $2,600, $2,150, $1,650, based on volume profile and Fibonacci levels.
Stop loss: Daily close above $4,000 or reclaim of trendline.
Risk management: Adjust stop as price approaches $2,600 zone.
This setup emphasizes momentum decay, technical breakdown, and structured targets, ensuring clarity for both experienced and newer traders.
NFA

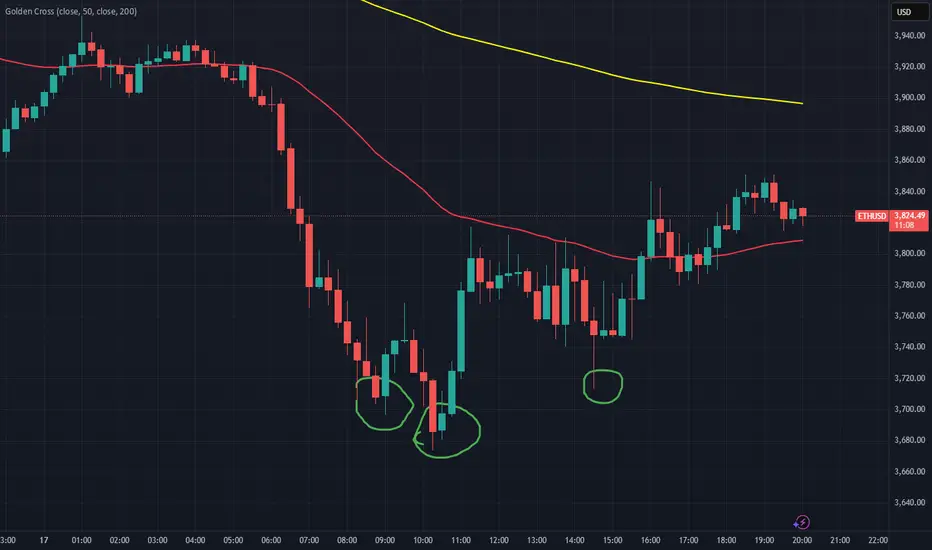
ETH: Pulled back under pressure📝ETH has recently broken through an important downward trend line, but then experienced a pullback.
📈Currently, the price is facing greater pressure near 3950. If the closing price can be above 3950, the weekend recovery may continue, and it may even challenge the 3970 - 4000 area. If it can break through this area, it may further rise; if it fails to close above 3950, there will still be a need for a pullback.The key support level below is near 3650.
💡If this position cannot provide effective support, the price may further decline to around 3550, or even near 3370.
💡The resistance level above is in the 3970 - 4000 area. This area is an important pressure level. If the price can effectively break through it, it may indicate that the structure has stopped falling and a rising opportunity will come.
♦Market sentiment remains cautious, with long and short sides locked in a stalemate. From a technical pattern perspective, there is a trend of lower highs and lower lows in prices. If the current structure cannot be broken, market risks will persist.
💎
Buy 3835 - 3840 TP 3850 - 3860 - 3870 SL 3825
Sell 3920 - 3910 TP 3900 - 3890 - 3880 SL 3930
Daily-updated accurate signals are at your disposal. If you run into any problems while trading, these signals serve as a reliable reference—don’t hesitate to use them! I truly hope they bring you significant assistance

ETH Long into Q4📈 Ethereum / USD (1W) – Macro Outlook
Ethereum is consolidating after a strong rally, currently finding support near the 0.382–0.618 Fibonacci retracement zone — a historically key area for continuation setups.
If this structure holds, ETH could be gearing up for its next macro leg, with potential upside targets aligning around:
⚪ Very Likely: ~$6,400
🔵 Likely: ~$7,800
Key Support Levels to watch:
$3,850 → short-term support
$3,220 → major retracement support
As long as ETH maintains higher lows above the 0.618 region, the macro bullish structure remains intact — indicating that Ethereum may just be cooling off before its next impulse.
🚀 Macro trend still favors continuation, but short-term volatility remains high.
#Ethereum #ETH #Crypto #TechnicalAnalysis #ETHUSD #Altcoins #CryptoTrading

ETHUSDT - BULLISH SETUP After a clean sellside liquidity sweep and confirmation of SMT divergence, ETH showed a market structure shift (MSS) followed by a break of structure (BOS) to the upside. Price is now respecting the consolidation sellside imbalance discount (CSID) zone while maintaining structure above the key discount area.
Bias: Bullish
SMT divergence confirming liquidity grab ✅
MSS + BOS show shift in order flow ✅
Price reclaiming FVG and holding above OB ✅
Targeting inefficiency and buyside liquidity near 4240
Expecting continuation if price maintains above 3850, with displacement toward the premium range and rebalancing the prior imbalance.


CRypto Update - ETHI didn't realize it until; after market close, but every crypto made what looks like a pennant this week. It's most obvious on ETH so I plotted that instead of BTC.
As much as cryptos are tied into the financial system, this could wind up being a big deal if cryptos collapse.

ETHEREUM Free Signal! Sell!
Hello,Traders!
ETHEREUM Price has reacted sharply from the horizontal supply area, confirming the presence of institutional selling pressure. A clean rejection signals continuation toward the lower liquidity pool near $3,740 as Smart Money hunts sell-side targets.
-------------------
Stop Loss: $3,888
Take Profit: $3,741
Entry: $3,829
Time Frame: 3H
Setup Risk: High
-------------------
Sell!
Comment and subscribe to help us grow!
Check out other forecasts below too!
Disclosure: I am part of Trade Nation's Influencer program and receive a monthly fee for using their TradingView charts in my analysis.

Bullish reversal pattern observed (is the bottom in?)Wondering if this is the bottom , the actual dip that can be bought for ETHUSD..
$ETH (WEEKLY): still BULLISH, lost the main SUPPORT ($4k)CRYPTOCAP:ETH the WEEKLY chart is crucial for the #altcoins in Q4, so we better have a solid grasp here.
This one is very problematic, as in, it doesn't give us many clues. No proper chart pattern, at all, for years on this WEEKLY. That is rare, and I don't like it, tough to analyse.
No clear ELLIOT'S WAVE pattern, the last WAVE 5 completed in December 2024, followed by a huge correction and even greater rebound ending in the current ATH zone.
I will just stick to tested horizontal SUPPORT/RESISTANCE ZONES, these are always high %.
So, the main RESISTANCE to beat before any BULLISH bias: $3988 - $4092. Close below and things are getting really serious immediately.
As far as the SUPPORT zone, between $3306 and $3571. The support zone is where I would be looking for those sweet wicks down in case of an earthquake.
Market STRUCTURE is still BULLISH and in an UPTREND. I will publish the DAILY, this one is fundamental to process first👽💙

ETHUSD WILL FLY HIGH According to H1 analysis ETHUSD market continuously running in wide wave and now market almost at SUPPORT LEVEL if you are interested then go long from here is best for you dont be greedy use money management
TRADE AT YOUR OWN RISK
REGARD ALBERT

MeghaHorn or BowTie Pattern !!!Key Observations:
Pattern Formation:
A broadening wedge or megaphone pattern (also likened to a bow tie) is forming.
Price is oscillating between expanding trend lines.
Labeled waves: 1, 2, 3, 4, 5 within the pattern.
Critical Zones:
Buy Above: $2,815.98 (upper boundary of the wedge).
Sell Below: $2,258.03 (lower boundary of the wedge).
No Trading Zone: Between $2,258 – $2,815 (uncertainty/consolidation area).
Price Target:
If price breaks below, Target 1 is indicated around $1,800 or below (implied from structure).
Current Price:
Trading at $2,748.56, up +5.05%, within the “No Trading Zone”.
Summary:
The chart suggests waiting for a breakout or breakdown from the wedge pattern to determine the next move. A breakout above $2,815 could signal a buy opportunity, while a breakdown below $2,258 could trigger a sell with a potential target near $1,800.
Ask ChatGPT

Short Term Trade on Ethereum Ethereum followed the time cycle perfectly today — it turned down right at 9:30 AM IST as projected. The next cycle is on Friday at 5:00 AM IST. Stay alert to my time cycles and don’t miss the upcoming trade.

Ethereum Following Neo WaveEthereum master plan decoded with Targets just follow my Green lines :-)
Ethereum is following neo waves, and these targets are now Arrived basis on the neo wave theory

Eth New Targets - Triangle Breadown📉 Technical Patterns & Indicators
1. Head and Shoulders Pattern
Left Shoulder, Head, and Right Shoulder are clearly marked.
Breakdown from the neckline suggests a bearish reversal, with a drop of ~6.49% (-295.99) post-breakdown.
2. Triangle Formation
A symmetrical triangle labeled with a, b, c, d, e waves.
The recent price movement has broken below this triangle, indicating a bearish breakout.
3. Elliott Wave Labels
Waves labeled A, B, C, D, E, F, G.
The chart is currently in the E-wave to F-wave transition.
Projection points:
F Wave target: ~$4,218
E Wave target: ~$4,084.51
G Wave target: ~$3,897.08
4. Trendlines
Blue and black descending trendlines suggest downward pressure.
Ethereum remains below these resistance lines, reinforcing a bearish outlook.

Ethereum Daily Chart (Sell on Rise)Wave Count (Green Labels 1–5):
A 5-wave impulsive move appears to have completed, marking a bullish cycle peak.
Complex Correction (W-X-Y-X-Z pattern):
The correction after the 5th wave is labeled as a Complex Correction, composed of:
Wave W – Zigzag
Wave X
Wave Y – Flat (3-3-5)
Wave X – Smaller bounce
Wave Z – Currently unfolding with a Diametric Pattern (7-wave structure)
📉 Current Market Structure
Ethereum is in a corrective phase, currently moving through the Z wave of the complex correction.
The correction appears to be forming another Diametric Pattern, potentially indicating one final drop before resuming upward.
🛒 Key Buying Zones Highlighted
Upper Buying Zone (~$4,400 to $4,600)
If ETH breaks bullish earlier than expected.
Lower Buying Zone (~$3,600 to $3,800)
More likely based on the projection shown.
Where the final leg (Z) is expected to complete.
📈 Projected Path
Price is expected to dip into the lower buying zone as the Diametric pattern completes.
Following that, a strong bullish reversal is anticipated, likely leading to a new impulsive wave up.
📝 Patterns Used
Zigzag
Flat (3-3-5)
Diametric Pattern – A 7-legged corrective structure, less common, indicating prolonged correction.

Eth Ready for All time High :-)🔍 Analysis Summary:
Current Price: ~$3,824
Pattern: Complex Elliott Wave correction (W-X-Y-X-Z) has likely completed.
Key Observation: A potential bear trap just occurred (false breakdown), signaling a reversal.
Wave Count: The chart suggests that Wave 2 has completed, and Wave 3 up is starting.
✅ Trading Plan:
Buy Above: $3,925
Stop Loss: $3,378
Target 1: $5,230
Target 2: $6,306
🧠 Insights:
Buying Zone was identified in the earlier phase near April.
Bear Traps are used to suggest failed breakdowns, which trap sellers and fuel upside moves.
Expected Move: Strong impulsive rally if price breaks above the resistance zone.
