Short time🚨 Ethereum Warning! 🚨
Looks like the bears are waking up 🐻 —
Ethereum is losing its key supports one by one, and signs are pointing toward a bearish phase ahead! 📉
If you’re still holding long positions, manage your risk wisely…
The sound of an upcoming dump is getting louder 👀
Trade ideas

$ETHUSD: Riding the Lightning - The Short Trade is ActiveThe Trade is Active
Greetings, fellow navigators. The market has spoken, and our patience has been met with a trigger. The short setup we've been observing on BITSTAMP:ETHUSD is now live, with price having tagged our entry zone around the $4590 - $4600 level. If stopped out at 4800, we would be okay to re-enter, keeping the stop loss above the most recent swing high.
The thesis remains as discussed: after a powerful "inhale," the market appears to be taking a corrective "exhale." Price has broken the lower boundary of its immediate ascending channel, signaling a potential shift in short-term momentum. The plan is in motion.
Style: Short / Mean Reversion
Entry: ~$4590 (Active)
Stop Loss: ~$4814
Take Profit: ~$3000
Risk/Reward: Approximately 1 : 6.9
The Philosophy - A Word on Trading Crypto
To trade crypto is to engage with the market in its wildest form. It is the extreme sport of the financial world. The volatility here is a double-edged sword; it can carve out immense opportunity, but it demands the utmost respect and skill to handle without getting cut. Trying to catch a reversal in this space can feel like trying to catch a falling blade that has no handle.
This is why we don't "catch"; we plan. We define our risk before we ever enter. The "doctor's orders" for navigating this beautiful chaos are simple, but not easy:
A healthy dose of strategically placed stop losses.
A commitment to non-degenerate risk management.
A big smile, because the lessons learned here will forge you into a disciplined trader.
A Note on Your Well-Being
I speak of getting "cut" not to be grim, but to be real. This path can be intensely lonely, especially when the market delivers a harsh lesson. I've been there. If you are struggling, or ever lose more than you were prepared to, I want you to know that you do not have to carry that weight alone. Please reach out to someone.
Everything money can buy is cheap. You are priceless.
If you are struggling, you don't have to do it alone.
988 Suicide and Crisis Lifeline
Hours: Available 24 hours
Just shine.
Disclaimer: This is not financial advice. It is for educational and informational purposes only. Please conduct your own research and manage your risk accordingly.

$ETH – Bear Flag Developing as $BTC Cracks Key SupportEthereum ( CRYPTOCAP:ETH ) is forming a bear flag pattern just as Bitcoin ( CRYPTOCAP:BTC ) starts to crack under major support — this could get ugly fast if we lose the key levels in both charts.
🔹 The Setup:
CRYPTOCAP:ETH is hovering around $3,000, a huge psychological and structural level on the chart.
The current flag structure looks weak — lower highs, declining volume, and repeated rejections at the 9 EMA.
A flush below $3,000 opens the door to a deeper move, potentially into the mid-$2,000s or even lower.
🔹 Macro & Market Context:
The entire risk complex looks shaky — if NASDAQ:NVDA disappoints on earnings, it could accelerate selling across crypto and equities.
CRYPTOCAP:BTC ’s failure to hold support is a red flag — crypto tends to move together on momentum shifts.
Watch for risk-off confirmation in NASDAQ:QQQ , AMEX:IWM , and high-beta names.
🔹 My Trade Plan:
1️⃣ Position: Short CRYPTOCAP:ETH here with a stop over the 9 EMA on the daily.
2️⃣ Target: First zone in the mid-$2,000s, potential extension if panic sets in.
3️⃣ Trigger: Breakdown confirmation under $3,000 with volume.
Why I Like This Short:
Clean bear flag structure with well-defined risk.
CRYPTOCAP:BTC and risk assets breaking key levels together = confluence.
CRYPTOCAP:ETH has plenty of air pockets below $3,000 — the technicals support continuation.

This Is NOT a Bear Market - Its a Setup!Everyone is saying the 50 EMA is broken, we are officially in bearish territory, and I will be quite honest, that excites me. I think we are almost at the point where we will BLOW.
We never get the bear market when everyone expects it — just like we never get the bull market when everyone waits for it.
This move down is designed to scare you… and once enough people believe it’s over? That’s when the real move begins.
I cover:
-Why the move down is engineered to convince traders it’s “over”
-The psychology behind fear-driven dumps
-BTC downside risk before the real move up
-TOTAL market structure and key levels
-ETH analysis and what I’m expecting next
-Why this entire move fits perfectly into my bullish narrative
⚠️ Disclaimer:
I am not a financial advisor. The content shared on this channel is for educational and informational purposes only and should not be considered financial advice.
Trading and investing in cryptocurrency involve high risk — you could lose some, or all, of your money. Always do your own research and make sure you understand the risks before making any financial decisions.

ETH PERPETUAL TRADE SELL SETUP Short from $3201ETH PERPETUAL TRADE
SELL SETUP
Short from $3201
Currently $3201
Targeting $3153 or Down
(Trading plan IF ETH
go up to $3252 will add more shorts)
Follow the notes for updates
In the event of an early exit,
this analysis will be updated.
Its not a Financial advic

ETHUSD-LIKELY TO DUMP BELOW 2.6K[Short it]WEEKLY-Bearish order flow
Daily-bearish order flow with bearish context
ENTRIES-H1/5mns entry time frames swingers and intra -day traders respectively
Target weekly ORDERBLOCK

ETH - everyone is wrongWatching this scenario playing. I predicted 1.3k$. Now I'm predicting a slow climb towards19k in early 2027.

ETHUSD – Bullish Continuation Setup1H Reversal → Now Looking for Expansion**
ETH just confirmed a clean shift from reversal into continuation, exactly the structure we expect after clearing liquidity and tapping a fresh demand zone.
1️⃣ Liquidity Grab Completed
Price swept sell-side liquidity beneath the recent range (classic ICT sell-to-buy behavior).
Smart money filled long positions → bullish narrative begins.
2️⃣ Breaker + FVG Retest
ETH returned to a micro Breaker Block + a small 1H FVG.
These zones overlap—confluence for continuation.
Price is now sitting right inside that region.
3️⃣ Alligator Compression (Bill Williams)
Alligator (blue-red-green) lines are compressing.
This is the “sleeping Alligator” phase → volatility contraction.
What comes next?
Expansion.
Direction of expansion = aligned with the higher-timeframe liquidity draw above.
4️⃣ Clear Draw on Liquidity Above
Closest upside magnets:
3,300 – 3,330 → inefficiency fill
3,641.7 → major liquidity + previous 1H distribution high
The model favors a move up to rebalance those imbalances.
My Trade Setup (1H Long)
Entry Zone:
🔵 3,160 – 3,200 (Breaker + FVG confluence)
Stop Loss:
🔻 3,020
(below last displacement low — invalidation)
Targets:
🎯 TP1: 3,300
🎯 TP2: 3,420 – mid-range imbalance
🎯 TP3: 3,641.7 (main liquidity draw)
Risk-to-Reward:
Solid continuation R:R from current structure
(as shown on the chart).

Ethereum Next Buying Move Read the Description The chart shows Bullish Trend
Support Zone: Around $3,200–$3,300 (clearly marked).
Target Level: Around $3,680–$3,700.
Price has bounced up from the support zone and is now moving toward that target region.
The chart’s drawn projection shows a bullish retracement into the upper zone before a potential pullback.
Short Setup Idea (Counter to the Bullish Move)
If you’re waiting for a short (sell) opportunity, the best area would be near the target resistance zone shown in your chart.
Short Entry Zone:
$3,650–$3,750
(This is the “Target Level” box
Confirmation to Look For
Wait for bearish confirmation before entering:
A rejection candle
Lower time-frame break of structure
Declining volume or momentum divergence on RSI/MACD

ETH/USD – Low-Volume Accumulation Breakout SetupETH/USD – Low-Volume Accumulation With Potential Early-Session Breakout Ahead
ETH/USD has been trading inside a tight, low-volume consolidation zone over the past few sessions. The daily volume profile shows a consistent drop in participation, indicating that larger players have stepped aside temporarily. Whenever price moves sideways on contracting volume, it often suggests accumulation or absorption, not weakness.
Historically on this chart, each period of suppressed volume has been followed by an impulsive breakout, as shown by the repeated patterns on the left side. The current structure is forming a similar setup.
Price continues to respect the Daily Value Area and is holding above a key support shelf, showing that sellers are failing to push the market lower—even with low volume. This is a sign of strength from passive buyers.
If today’s session also closes with muted volume, it sets the stage for a potential early-session expansion tomorrow, likely targeting the imbalance and low-volume area highlighted above.
The projected target zone aligns with the next liquidity cluster on the volume profile, where the market may attempt to print a new short-term high before deciding its next macro move.

ETH/USD – Bullish From Demand Zone Ethereum has tapped a strong demand area, and buyers are already reacting. This zone has held several times before, and we’re now seeing the early signs of a potential reversal.
If momentum continues, ETH could push toward $3,400 → $3,642 → $3,920, and possibly even $4,250. The structure is starting to form clean higher highs and higher lows, which often signals the beginning of a larger bullish move.
If this demand holds, the upside potential is very promising.

ETHUSDNow, if the price can reach the lower time levels or levels and provide confirmation, you can consider buying.

ETH Trend: 3000→2820→3400ETH has staged a minor rebound but is set for another sharp pullback.
Focus on the support at 3000 – a break below this level will lead to a further decline to around 2820, where strong support is anticipated.
It will then rebound and break above 3400 to resume the uptrend.
Accurate signals updated daily. They serve as a reliable guide for trading issues – feel free to refer to them. Hope they help!

MY MEDIUM TO LONG TERM VIEW ON ETHERIUM Dear Traders,
I have stayed long in this market to know the bigger picture and price action is KING. Whilst a lot of crypto traders believe that crypto is largely driven by fundamentals, I have seen different cycles to know that your ability to identify key levels and read price action correctly, whilst bringing in your understanding of MARKET STRUCTURE & PRICE ACTION with great knowledge of chart patterns for entry as well as how timeframe correlatives will help your winning rate significantly.
Whilst I believe that ETH may be overall bullish, I see some key support levels between $1,396 and $2,723 that tells me to be a bit more patient with early buy options. If price leaves me and makes a new high before getting to those level, I would let it go as that may mean that I am wrong. For now, I still feel there is a need for patience and waiting for confirmation to buy or sell.
Patience is a virtue in trading.

Did you Know ?!!!The price can form a head and shoulders pattern. If that is happen, expect a significant price increase.
Did you really think that profiting from the current bull run (a comprehensive upward market) would be easy? Don't be naive. Do you think they will let you buy, hold, and sell at low levels without any struggle? If it were that simple, everyone would be rich. But the truth is: 90% of you will lose. Why? Because the crypto market is not designed for everyone to win. They will shake you. They will make you doubt everything. They will panic you and sell at the worst possible moment. Do you know what happens next? The best players in this game buy when there is fear, not sell; because your panic gives them cheap assets. This is how the game goes: strong hands feed off weak hands. They exaggerate every dip, every correction, every sale. They make it look like the end of the world so that you abandon everything, and when the market starts up again, you'll sit there saying, "What the heck just happened?" This is not an accident. It's a system. The market rewards patience and punishes weak emotions. The big players already know your thoughts. They know exactly when and how to stir fear to make you give up. Because when you panic, they profit. They don't play the market. They play you. That's why most people never succeed. Because they fall into the same traps over and over again. People don't realize that dips, FUD (fear, uncertainty, doubt), and panic are all part of the plan. But the winners? They digest the noise. They know that fear is temporary, but smart decisions last forever. We've seen this hundreds of times. They pump the market after you sell. They take your assets, hold them, and sell them to you at the top, leaving you with nothing, wondering how it happened. Don't play their game. Play your own.

ETHUSD | Bullish H4 Countertrend IdeaHey Traders,
I'm not Eric Trump, but I think it's not a bad idea to buy ETH now... but you have to take profit quickly.
Because it's only a H4 countertrend , targeting the daily breakdown zone at (3,286.21-3,313.46) and the H4 breakdown and the daily pivot zone (3,374.89-3,400.46).
Invalidation: H4 Close < 3,166.30 (H4 pivot)
Better opportunities come when (and if) this bullish countertrend turns back, and the the bears may target the 3,000 level and the next target zone.
Stay disciplined!
Peter

ETH Support Bounce With Target at 3250Ethereum is trading above a key support level after a strong downward move. Price is showing early signs of a potential bullish correction, with projections pointing toward a possible recovery target around $3250. A break above minor resistance could confirm upward momentum.

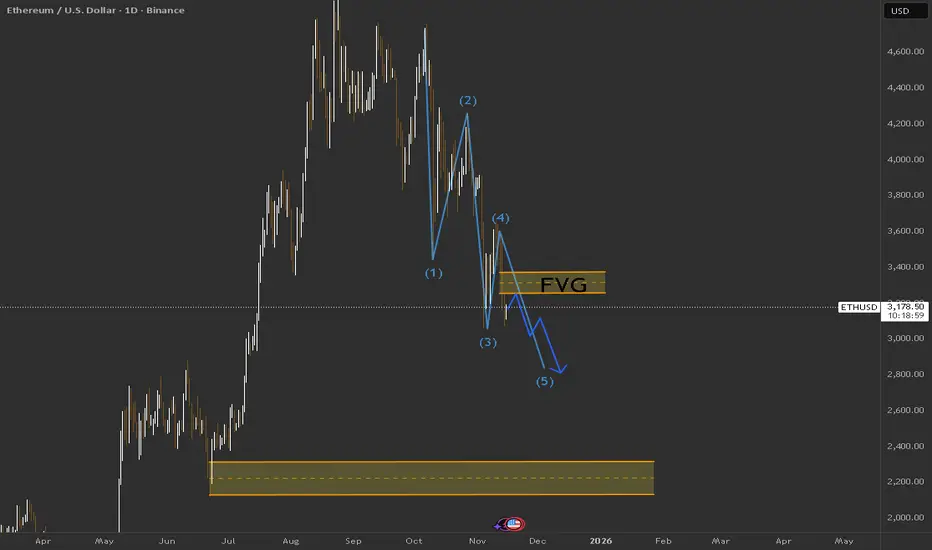
$ETHUSD: In Wave II correctionBINANCE:ETHUSD : After 2021 top, Ethereum went through a length multi-year complex correction that is W-X-Y. Since then, a new uptrend was born. We have completed Wave I of this new uptrend. The 5 subwaves of Wave I can be seen clearly. We're now in Wave II.
Wave II usually retrace 50% or more. It can retrace very deep, even 90%. Let's hope ETH will found a bottom between 50% ($3169) and 61.8% ($2748) retracements.

ETH UpdateHey everyone,
so please see the green bull penant drawn on the closes, as you may notice, it has failed and is being broke back into.
Now, this is where I'd like to share a wild prediction. It will close above the green top rail for November, therefore keeping the pattern as valid.
This is why I say time frames matter, as false moves on patterns can be tricky on depending on the time frame the pattern is meant to hold on.
On weekly it looks disastrous, has cleanly closed below, but is that the correct time frame?
This is a game of chess, between yourselves and the market makers, the gods of this world. Therefore there is a layer of psychology. You need to know what is going to happen, to play this correctly.
If this fails to close above, I will put my hands up, but if it doesn't, understand this world has Gods, and there job is to take as much money from you as possible, and that's a dynamic you need to be able to play against, correctly.
Not financial advice.

Maximum Fear = Maximum Opportunity. Wave 5 is Next
So where are we going? The chart has the target mapped out. The final Wave (5) is programmed to hit the 1.618 Fibonacci extension, which lines up perfectly with a retest of the upper trendline.
That puts us at ~$6,700.

ETHUSDMaybe another bull trap.
Based on market sentiment, catastrophe is not yet...
Before a ledge, the market must be complacent...
As far as I can tell, right now, it's fear.

What Is Crypto Market's Downside Risk?The move to the downside this week has been pretty damn aggressive to say the least.
This has brought in a lot of fear within the market, creating confusion and doubt.
However, if you have been watching my videos, we have been expecting this move. And in this video, I explain, the further downside risk we may have. I am still very bullish, and if we do get the move to the downside, it will confirm my confidence to the upside even more.
The game here is to stay patient, and avoid the noise we are hearing on social media.
I explain all the downside risks on BTC and ETH. I also show you exactly where my invalidation point is on BTC, to confirm that the cycle is officially over and we are fully bearish.
TO CONFIRM: This is the worst case scenario, and I don't really want to see this happening, as I also have had enough of the choppiness.
Lets go Alchemist Traders!
⚠️ Disclaimer:
I am not a financial advisor. The content shared on this channel is for educational and informational purposes only and should not be considered financial advice.
Trading and investing in cryptocurrency involve high risk — you could lose some, or all, of your money. Always do your own research and make sure you understand the risks before making any financial decisions.

ETH has to go up, but some things might need to happen first...While I'm bullish on ETH, it might have to go to these lows to get enough liquidity to fly to new ATH