ETHUSD - ATH An idea showing a curved resistance trend line that I think could be hit as a high for price
this would put price at nearly 10K which is crazy
I suspect the white line is support due to previous breakthrough and it no longer being resistance as before.
Aim for the dotted line up.
Daily chart
ETHUSD.PI trade ideas

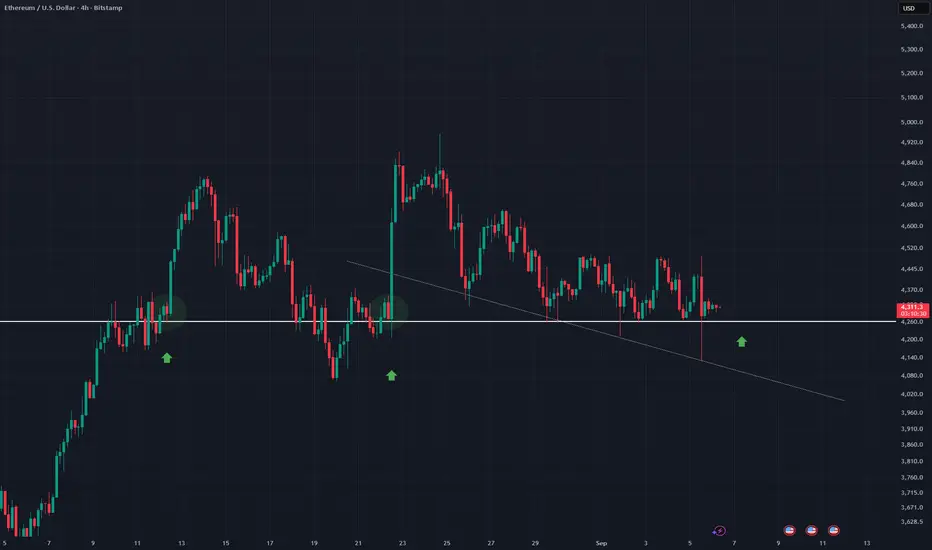
ETHUSD 4Hr - Strong Horizontal SupportETH has been hodling this horizontal support line quite well with one recent dip then sudden recovery below it
This drop below can be shown with a trend line with dotted line
I think price will hodl the horizontal and break out as predicted by the two prior breakouts along this line.
Okay, here is a brief analysis of Ethereum (ETH), approximately Okay, here is a brief analysis of Ethereum (ETH), approximately 330 words.
**Fundamental Analysis:**
Ethereum, as the world's leading smart contract platform, derives its core value from its vast ecosystem of decentralized applications (dApps), encompassing DeFi, NFTs, GameFi, and numerous other sectors. Its transition to Proof-of-Stake (PoS) via The Merge significantly reduced energy consumption and introduced a deflationary mechanism (through EIP-1559 fee burning), which is theoretically bullish long-term. Key bullish drivers include its narrative as a "digital bond" (generating yield through staking), ongoing ecological innovation (such as Layer 2 scaling solutions), and the potential approval of spot ETFs. However, its primary risks include high Gas fees during network congestion, challenges from other competitive Layer 1 blockchains (like Solana), and regulatory uncertainty.
**Technical Analysis:**
ETH's price is highly correlated with Bitcoin's but typically exhibits greater volatility. Its price action is heavily influenced by overall crypto market sentiment, Bitcoin's movements, and its own network activity (such as NFT minting booms). Key technical levels to watch involve its ability to break through or defend crucial psychological price points (e.g., $2,000, $3,000) and hold long-term trendline support. Trading volume and on-chain activity metrics (like Total Value Locked - TVL, active addresses) are vital indicators for gauging its momentum strength.
**Summary and Outlook:**
Ethereum is more than just a currency; it is fundamental infrastructure for the digital economy. Its long-term value hinges on the growth of its ecosystem, the successful implementation of network upgrades (e.g., future sharding), and its ability to maintain its moat as the premier platform for dApps. Short-term prices are significantly affected by market beta (correlation) and news flow. Investors must weigh its technological leadership against intense competition and be aware of its high-risk nature.
***
*Disclaimer: The above content is market analysis and does not constitute any investment advice. Cryptocurrency investments are extremely high risk; please make decisions cautiously.*

ETHUSD – Weekend Short Setup Towards 4,050Ethereum is struggling to reclaim 4,400 and continues to get rejected at the moving averages. Structure remains heavy with lower highs forming, and the recent bounce looks corrective rather than impulsive.
The short bias holds as long as price stays below 4,398–4,400. Clean entry confirmation at current levels (≈4,303) with risk capped just above the recent rejection.
Entry: 4,303
Stop Loss: 4,399
Take Profit 1: 4,156
Take Profit 2: 4,050
I’m splitting into 3×0.33 ETH positions:
• First scale out near 4,156,
• Letting the rest ride to 4,050 if momentum continues.
Risk/reward is favorable, and invalidation is clear. A reclaim and close above 4,400 would flip this setup invalid.

Eth's next leg up, following Bitcoin's 2020 exampleThis is an attempt to zoom out over very big time-frames and consider how Eth could enter a new super-cycle and ATH.
The assumption is that Ethereum will follow a similar path Bitcoin did in 2020, where the price similarly broke out of a multi-year descending resistance line formed from that supercycle's ATH, carving out a logarithmic bull channel to the next supercycle's ATH.
Several key differences exist. For instance, Eth's current multi-year descending resistance is longer than Bitcoin's was at the time. Furthermore, Bitcoin's initial breakout of that resistance did not coincide with the formation of a new ATH, as we have already done with Ethereum.
In this chart, we assume that the April Bull channel represents this leg up to the next supercycle ATH. We would expect 2021 resistance to get tapped, possibly at the same time as the log bull channel's bottom support line is tapped.


ETHUSD ShortEthereum recently made a Change of Character (CHoCH) at $4,489, shifting the intraday structure from bullish to bearish. After that shift, price broke lower and confirmed weakness with a Break of Structure (BOS) at $4,215, which suggests sellers have taken control. This BOS indicates that short-term continuation to the downside is likely unless buyers reclaim key resistance levels.
Supply & Demand Zones
The supply zone between $4,445–$4,480 is strong—price reacted here with sharp rejection and a strong selloff, showing that sellers are defending this area aggressively. Another smaller supply zone sits around $4,390–$4,410, where a quick pause before continuation down took place, making it weaker but still valid for short-term reactions. On the demand side, the area around $4,170–$4,230 has historical buying interest, and with price previously bouncing from it, this remains the key downside target. Buyers stepped in there with strength before, but repeated testing could weaken it.
Price Action in the Marked Region
Currently, price is trading near $4,310 after a sharp drop from the $4,445 supply zone. The marked projection suggests a pullback into the $4,357–$4,370 midrange (0.5 retracement) before another leg lower. If sellers hold this retracement and push back down, the next move should target the $4,215 BOS level and extend toward the deeper demand zone near $4,180–$4,200.
Trade Bias & Outlook
The current trade bias is bearish. The expected direction is a short-term rally into supply, followed by continuation down.
Invalidation level: A sustained break and 15m close above $4,410 would negate the bearish view and re-open the path to retest $4,445–$4,480.
Momentum & Candle Behavior
Momentum currently favors sellers—downward moves are impulsive with large-bodied candles, while upward retracements are corrective and smaller. Recent candles show rejection at supply, confirming bearish intent. Unless strong bullish candles appear through resistance, momentum remains with sellers.

ETH/USD: Could $5,000 Be Just Around the Corner?Ethereum (ETH) is currently trading at $4,285, experiencing a slight decline from the previous close. Intraday, it reached a high of $4,474 and a low of $4,261. The $4,300–$4,400 range has been acting as a key support zone, and a breach below this could see ETH testing the $4,000 level, with the 50-day EMA providing additional support. Immediate resistance is observed around $4,530, and a successful breakout above this level could pave the way for a move towards $5,000.
Market sentiment shows the Relative Strength Index (RSI) approaching overbought territory, indicating potential for a short-term pullback. Significant institutional accumulation continues, with firms like BlackRock increasing their ETH holdings. The approval of Ethereum ETFs in the U.S. and Australia has led to increased investor participation, contributing to upward price pressure.
Short-term volatility is expected as ETH tests these key support and resistance levels. A breakout above $4,530 could signal a bullish continuation towards $5,000, while a drop below $4,000 may lead to further downside. Long-term prospects remain positive, supported by growing institutional interest and favorable market conditions.

ETHUSD BUY 4350ETHUSD Long Setup – Eyeing Momentum Above 4350
📌 Entry: 4350
🛡️ Stop Loss: (Set based on your risk tolerance, e.g., below recent support)
🎯 Target: (Optional – define based on resistance zones or fib levels)
Ethereum is showing signs of strength after consolidating near a key support level. A clean break above 4350 signals bullish intent, supported by improving volume and short-term trend alignment. This setup favors momentum traders looking to capitalize on a potential leg up toward the next resistance zone.
Watch for confirmation on lower timeframes and monitor BTC correlation for added confluence. Ideal for intraday or swing entries depending on volatility.
#ETHUSD #CryptoTrading #Ethereum #BreakoutSetup #BullishBias #MomentumTrade #TradingViewIdeas
Want me to tailor this for meme-style engagement or algo-friendly tagging? I can remix it in seconds.

ETH/USDBullish Bias. Anticipating Sweep of Engineered Liquidity (EGL) and Proper mitigation on POI to move higher

ETHUSD Re-entrySweep of liquidity mitigating Support level.
Continuous Bullish Bias. Manage risk efficiently

$ETH 1H candle showing pure range-bound action. CRYPTOCAP:ETH 1H candle showing pure range-bound action.
CRYPTOCAP:ETH 1H candle is showing pure range-bound action, with price steadily bouncing between support and resistance levels. This type of consolidation signals that buyers and sellers are in balance, and the next breakout could set the direction for the upcoming move. 🚀📉

ETHUSD BUY NOW 4280🟢 ETHUSD – Bullish Setup at 4280 Long Opportunity
Ethereum is showing strong bullish momentum, bouncing off key demand near 4280, with buyers stepping in aggressively. Price action confirms support holding, and technical indicators suggest continuation toward higher resistance zones.
🔹 Trade Idea: BUY ETHUSD @ 4280
- Entry: 4280
- Stop Loss: 4215 (below recent demand zone)
- Take Profit: 4450 / 4600
- Risk/Reward: ~2:1
📊 Technical Confluence:
- Bullish structure intact above 4267 support
- MACD crossover and RSI trending upward
- Price respecting ascending trendline
- Volume spike confirming buyer interest
💬 Narrative:
ETH continues to consolidate within a rising channel, with institutional interest and positive sentiment driving upside. A clean break above 4450 could open the path to 4600 and beyond.

ETH 1D – Trendline Support Holding, Stoch RSI Oversold ReversalEthereum is retesting trendline support after a strong multi-month uptrend. The confluence of rising structure and oversold Stoch RSI suggests conditions are forming for a potential bounce.
If bulls defend the trendline, the next upside target is the measured move toward 5,200. A breakdown below structure would shift focus to lower supports, but momentum is showing early signs of recovery.
This is a key decision point: continuation of the trend or a break in structure.

Breakout or Reject at 4480?We are retesting resistance once again. Breakout of red top channel line should be a good signal as to whether we continue up.

Don't sleep on Ethereum!Ethereum is following the pattern seen before the 2021 bull run of Bitcoin, and we are now in the final stages before the parabolic run for Ethereum.
CRYPTOCAP:BTC 2017\2021 vs. CRYPTOCAP:ETH 2021\2025

ETH/USD – Testing Resistance🔴 SHORT below $4,379 – target $4,268
Ethereum trades at $4,406, just above the 200 SMA ($4,379). Resistance at $4,440, support at $4,268. RSI near 70 shows ETH is entering overbought territory. If ETH fails to hold above $4,379, retracement to $4,268 looks likely.
📊 Keywords: #ETHUSD #Ethereum #CryptoShort #AltcoinSetup #Overbought

ETHUSD bullish sideways consolidationThe ETHUSD remains in a bullish trend, with recent price action showing signs of a corrective pullback within the broader uptrend.
Support Zone: 4,100 – a key level from previous consolidation. Price is currently testing or approaching this level.
A bullish rebound from 4,100 would confirm ongoing upside momentum, with potential targets at:
4,450 – initial resistance
4,730 – psychological and structural level
5,070 – extended resistance on the longer-term chart
Bearish Scenario:
A confirmed break and daily close below 4,100 would weaken the bullish outlook and suggest deeper downside risk toward:
3,990 – minor support
3,830 – stronger support and potential demand zone
Outlook:
Bullish bias remains intact while the ETHUSD holds above 4,100. A sustained break below this level could shift momentum to the downside in the short term.
This communication is for informational purposes only and should not be viewed as any form of recommendation as to a particular course of action or as investment advice. It is not intended as an offer or solicitation for the purchase or sale of any financial instrument or as an official confirmation of any transaction. Opinions, estimates and assumptions expressed herein are made as of the date of this communication and are subject to change without notice. This communication has been prepared based upon information, including market prices, data and other information, believed to be reliable; however, Trade Nation does not warrant its completeness or accuracy. All market prices and market data contained in or attached to this communication are indicative and subject to change without notice.

ETHUSD - 250905 - LONG - Binance - Algo Target - 1WTake Profit: $5,800 - $6,000
Likely Market Cycle Top

ETH/USD – 30m | Descending Trendline Rejection & Critical RetestBITSTAMP:ETHUSD
Structure | Trend | Key Reaction Zones
ETH is facing heavy rejection from the descending trendline and showing lower highs (LH). Critical support zones are holding buyers for now, but momentum is tilted bearish.
Market Overview
After a sharp liquidity grab near 4490–4500, ETH rejected strongly from major resistance. Price is now retesting critical support zones, and sentiment suggests sellers remain active. Bears are in control unless support breaks or bulls reclaim higher levels.
Key Scenarios
✅ Bullish Case 🚀 → Break above 4362–4380 may extend recovery towards 🎯 4435 and 🎯 4490.
❌ Bearish Case 📉 → Failure at 4300 support may extend downside towards 🎯 4260 and 🎯 4215.
Current Levels to Watch
Resistance 🔴: 4362 / 4437 / 4490
Support 🟢: 4300 / 4260 / 4215
⚠️ Disclaimer: For educational purposes only. Not financial advice.

ETHUSD AUTO FIB 1000 DEPTH MACRO🔎 Key Fibonacci Levels (depth 1000 chart) / Set at 1000 to closely track 4 year cycle
0.618 → $3,839 (recently reclaimed, now support)
0.786 → $4,636 (current resistance zone)
1.000 → $5,659 (macro breakout confirmation)
1.272 → $6,959
1.618 → $8,612
2.618 → $13,392
3.618 → $18,171
4.236 → $21,124
📊 Probabilistic Outlook (based on history + structure)
0.786 ($4,636): Very close overhead. Odds of testing = 80–90% in this cycle.
1.000 ($5,659): Historically tagged in every ETH cycle. Odds = ~85% if bullish structure holds.
1.272 ($6,959): Tagged in all past ETH bull cycles. Odds = ~75%.
1.618 ($8,612): Historically hit in every run. Odds = ~65%.
2.618 ($13,392): Hit in both 2017 and 2021. Odds = ~45% (usually requires euphoric late-cycle blowoff).
3.618 ($18,171): Hit in 2/3 historical cycles. Odds = ~25–30%.
4.236 ($21,124): Extreme extension, only tagged in strongest cycles. Odds = ~15–20% (basically “mania top” territory).
⚖️ Summary
High confidence: ETH tests $5.6k–7k (1.0 → 1.272 Fib) this cycle.
Likely but needs momentum: ETH pushes to $8.6k (1.618 Fib).
Possible in full mania: $13k (2.618 Fib).
Euphoric blow-off only: $18k–21k (3.618–4.236).

