ETHUSD - Inverted H&S An inverted H&S pattern forming with only the right shoulder yet to complete.
I expect following the right shoulder upward movement to come, not sure how much but it will be there.
Chart pattern analysis on this daily timeframe.
Alt season?
Trade ideas

ETH | MonthlyCRYPTOCAP:ETH — Quantum Model Projection
Primary Wave ⓵ Near Completion | Q-Target: $26,366
Based on the Monthly chart structure, Ethereum’s long-term ascent since August 2015 appears to be forming a Leading Diagonal in Primary Wave ⓵. This wave remains in its late stage, with a final surge within Intermediate Wave (5)(not labelled on this chart) likely developing into early April.
The Quantum Target aligns with a projected advance toward $26,366🎯.
The emergence of a Leading Diagonal at the Primary degree is a notably bullish early-cycle signature, often signaling the transition from a broad accumulation phase into a developing trend extension. Within my framework, such diagonal motives — once followed by a corrective Primary Wave ⓶ retracement — typically precede powerful impulsive expansions in Primary Wave ⓷.
This structure supports a broader bullish narrative at the Cycle degree, suggesting that BBG:ETHEREUM is preparing for a major, multi-year uptrend as the larger wave sequence unfolds.
🔖 In my Quantum Models methodology, the equivalence lines function as structural elements, anchoring the model’s internal geometry and framing the progression of alternate paths.
#QuantumModel #TrendAnalysis #WaveAnalysis #MarketStructure #CryptoAnalysis #CryptoMarket #CryptoCycle #Blockchain #ETHHolders #ETHBull #EthereumEcosystem #EthereumNetwork #DigitalAssets #TechnicalAnalysis #ElliottWave #ChartAnalysis #ElliottWaveTheory #CryptoCharts #ETH #Ethereum #LongTermOutlook CRYPTOCAP:ETH

ETH Chart doesn't look prettyI see Ethereum’s chart not looking pretty for long nor hold positions at these prices.
Price Action
ETH continues to make lower highs and lower lows inside a descending wedge.
Price is moving toward two major demand zones, and the momentum is really weak. Just minor price hiccups.
I'm expecting some choppy or even consolidation movements before a possible test of the lower demand blocks.
OBV is such an underrated indicator!
Look at OBV, this is where the things gets interesting..
OBV is breaking its trendline downward, even while price hasn’t fully broken structure yet.
This is a classic sign of volume distribution. Smart money is exiting positions quietly.
When OBV breaks direction before price, it often predicts the next major move.
At the moment, ETHUSD is looking heavily bearish. Given the fact that BTC is also giving early signs of a bearish trend, I don't think buying ETH is a good idea here. I'll wait for a deeper correction.
Good Luck!

Why my ETH Holding has grownIn my last ETH update when the price was at $1700 and it looked as if the world was crashing, I mentioned I thought ETH was going to set a new ATH and so far it did but not at the price area I was expecting. I also did mention that I expected a return to around $3000 which is close to where it currently is.
All that said, I have had more time to look at the ETH chart and I think I may have been less bullish than I should have and as a result I grew my ETH holding since then. A few things I would like to point out.
One of which I mentioned in my last update. Looking at the ETH chart, it looks too similar to the gold chart with the ABC shakeout that gold went into before the massive rally.
Imagine holding GLD from Aug 2023 and selling in Oct 2023 because you could no longer handle the pain at this point below?
Now imagine those that held during this time, the fear and uncertainty they would have gone through. Personally, I think that is what the bookmakers are doing to ETH holders. If you believe the narrative that every asset will be tokenized and it ETH is the most trusted, then it makes sense to shake as many people out as possible before the GLD like rally.
Secondly, (although its a toss up) the action ETH is displaying now is similar to that of 2018 to 2020 and that we are in Sep-Oct of 2020 as you can see from the main chart and below as well.
Finally, the one bearish scenario is that we are doing the gold option but that we fail like this stock (PSNL) once we go and set a new ATM from here.
I had noticed the-same gold pattern and traded it but luckily I sold just before the failed breakout (so far) and you can clearly see the ABC pattern exactly like GLD before the breakout.
This is not a financial advice and I am not asking you to buy ETH. Just my opinion.
Please like, share and leave a comment.

ETH/USD 1H Chart Pattern.📌 ETH/USD 1H Analysis
I have drawn two target levels on my chart, and based on the trendline break + Ichimoku signals, my targets look correct.
---
1️⃣ Trendline Break
ETH has broken the downward trendline, which shows the beginning of bullish momentum.
---
2️⃣ Ichimoku Cloud
Price is trying to move above the cloud.
If a candle closes above the cloud on 1H, the bullish continuation becomes stronger.
---
🎯 Target Levels (Based on my Chart)
✔ Target 1 (Short-Term)
$3,040 – $3,060
This is the first resistance zone and the first realistic target after the breakout.
✔ Target 2 (Extended Target)
$3,220 – $3,250
If ETH breaks Target 1 with strong volume, it can move toward this higher target.
---
Suggested Trading Plan
Stop-Loss: $2,775 – $2,785
Take Profit 1: $3,040
Take Profit 2: $3,230

ETH hit my downside target now what?Wave 1 appears to have completed a leading diagonal with a poke above all-time high- what we expect from wave 1. Wave 2 is underway, testing the weekly 200EMA so far, and an expected reversal point- also the 0.382 Fibonacci retracement.
The retracement has been shallow, but ETH was beaten down and undervalued, making a shallow pullback expected. The 0.5 Fibonacci retracement is the next downside target at the S1 pivot.
🎯 Terminal target for the business cycle could see prices as high as $9000
📈 Weekly RSI was oversold with bearish divergence and has now reset below the channel EQ.
👉 Analysis is invalidated only if we get below the wave (4) bottom $1365
Safe trading

ETH Wave Analysis According to Wave Analysis principal, ETH is completing Correction Wave to start next bullish phase for target 7K and 11K.


ETH Reversal??? Is it Finally Here???So, ETH has been pushing up quite a bit now these last couple of days, but is this a real pump back up, or is it a TRAP? I'll let you decide. Here's what I see....
As posted previously, we have seen an H1 BOS out of the HUGE Weekly Demand Zone. In fact, it came out of the Daily Source of that Weekly Zone, so this push back up is definitely expected. We have fallen so much and fell down to near the bottom of the Weekly Demand Zone.
So, this H1 BOS will nearly always lead to a pullback to the H1 Source of that break, or to the H4 Supply Zone. This is playing out perfectly. We have just pulled back to this H4 supply Zone.
So....This is the area to look for any confirmation that the overall sell will continue. This H4 Supply Zone is full of sellers waiting to dump ETH, and it needs to be tested.
What to look for here:
Inside of this H4 Supply Zone, we need to see a 15 Min BOS down to signal that this whole move was a huge fakeout to trap buyers. IF we see that, look for another fake-out return to the source of that break for the Fall of Falls.
What if it doesn't Stop:
We are ALWAYS Reading the market, not predicting it. So, if this move up is to continue, we must see a clear break of that H4 Supply Zone. An H4 Candle needs to close above that zone and give us a retest, with a bullish rejection. IF that happens, ETH can keep pushing up to the next target - the H1 Supply Source (3170 - 3200).
This is just clear, technical trading, folks, and if you've been following, the market has done almost exactly what it has TOLD us it would do.

eth taps athgm,
i'll keep this post short and sweet, straight to the point.
eth came down in 3 waves from the recent highs,
we swept the all time highs to catch all the short stops
and we shook out all the bulls after.
we've been consolidating beneath last cycles high for many years now,
and i believe we are getting ready to break out finally.
my upside target is pretty fluid, not attached to any particular number,
more interested in the wave structure itself.
somewhere around 8-10k is fair value,
maybe as high as 20k if we ignite some true momentum.
---
ps. if this post gets 5 likes, i will share my macro bull case on eth.

ETH USD
HI GUYS
UPDATE ON THE ON GOING TREND
I expect buys sat,sun double bottom for long entries.
if u guys are still holding the 1st entries we made at the beginning,well congratulation

ETHUSD H4 | Bearish Reaction Off Key ResistanceMomentum: Bearish
Price is currently within the bearish ichimoku cloud.
Sell entry: 3,200.36
- Overlap resistance
- 50% Fib retracement
- 100% Fib projection
Stop Loss: 3,396.32
- Pullback resistance
Take Profit: 2,974.66
- Overlap support
High Risk Investment Warning
Stratos Markets Limited (tradu.com/uk ), Stratos Europe Ltd (tradu.com/eu ):
CFDs are complex instruments and come with a high risk of losing money rapidly due to leverage. 70% of retail investor accounts lose money when trading CFDs with this provider. You should consider whether you understand how CFDs work and whether you can afford to take the high risk of losing your money.
Stratos Global LLC (tradu.com/en ): Losses can exceed deposits.
Please be advised that the information presented on TradingView is provided to Tradu (‘Company’, ‘we’) by a third-party provider (‘TFA Global Pte Ltd’). Please be reminded that you are solely responsible for the trading decisions on your account. Any information and/or content is intended entirely for research, educational and informational purposes only and does not constitute investment or consultation advice or investment strategy. The information is not tailored to the investment needs of any specific person and therefore does not involve a consideration of any of the investment objectives, financial situation or needs of any viewer that may receive it. Past performance is not a reliable indicator of future results. Actual results may differ materially from those anticipated in forward-looking or past performance statements. We assume no liability as to the accuracy or completeness of any of the information and/or content provided herein and the Company cannot be held responsible for any omission, mistake nor for any loss or damage including without limitation to any loss of profit which may arise from reliance on any information supplied by TFA Global Pte Ltd.

Ethereum ( $ETH) Whales Load Up as Price Holds Key SupportEthereum trades near $2,939 after a volatile month that flushed out weak hands and pulled price into long-term support. The market now watches whale behavior closely, because large wallets often position early before major trend shifts. A well-known Hyperliquid whale — famous for earning nearly $200M shorting the October crash — has now opened a $44.5M ETH long, gaining over $300K within the first hour. His timing historically matters, and many traders view this as a signal that smart money expects a reversal.
On-chain data strengthens this view. Wallets holding 10,000–100,000 ETH added 440,000 ETH in one week, aligning their cost basis with current prices. Meanwhile, mid-tier wallets continue to sell into strength. This creates a classic compression scenario: institutional-grade buyers accumulate while smaller players distribute. One group will break soon — and whales rarely fold first.
Institutional flows also support the bullish narrative. US spot-ETH ETFs recorded $96.67M in inflows, ending an eight-day outflow streak. The Coinbase Premium Index climbed from -0.12 to -0.02, showing improving US demand. With rate-cut expectations above 80%, the macro backdrop now leans favorable for risk assets like ETH.
Regulatory developments add another catalyst. US regulators approved banks to custody Ethereum, unlocking access for pension funds, insurers, and large financial institutions. Combined with the upcoming Fusaka Hard Fork on December 3, 2025, which boosts scalability and blob capacity, Ethereum enters a new phase of adoption.
Technically, ETH hovers at its long-term support zone. If $3,000 holds, targets sit at $3,450 and $3,800. A close below $2,900 opens a path toward $2,150–$2,200. For now, whale accumulation, ETF flows, and improving sentiment signal accumulation rather than fear.

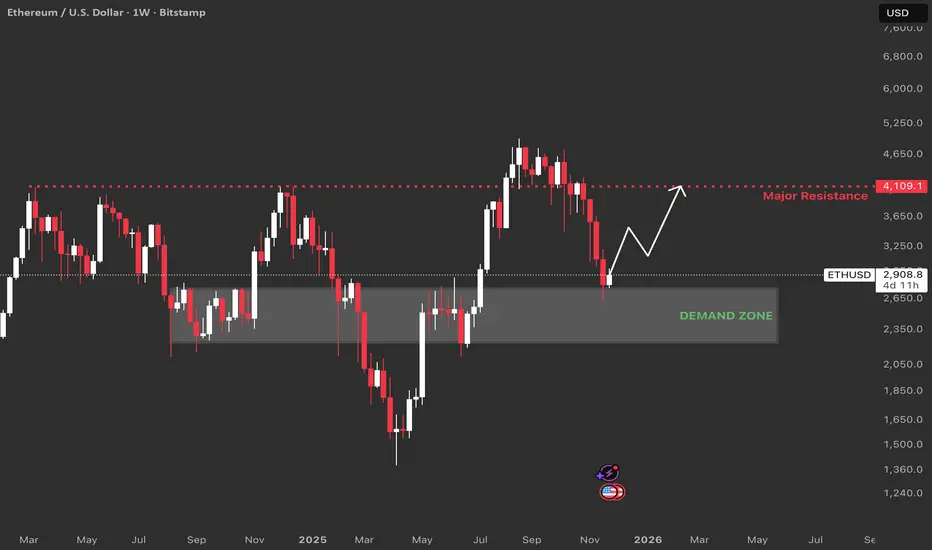
Ethereum Trade Setup: Weekly ChartDemand Zone : This area marks where ETH found buyers over multiple months, rejecting further declines. Historically, when price revisits this zone after a sell-off, it tends to bounce. The recent reaction confirms buyers are active and defending this level.
Major Resistance (4,109 USD) : It shows a prior weekly high and an expected supply or resistance area. This level also aligns with a golden pocket Fibb level, making it a confluence point where sellers could re-enter or bulls take profits.
Invalidation point: Weekly close below demand zone or multiple rejections with lower highs near demand.
Buy and sell at 3400We are in the good buy position and go parabolic; love the buy at 3050 zone and 3040.. sell at 3400 should be a good short sell correction before going higher

ETHUSD H4 | Bullish ReversalMomentum: Bearish
The price is falling towards the buy entry, which aligns with the 38.2% Fibonacci retracement.
Buy entry: 2,872.04
Pullback support
38.2% Fibonacci retracement
Stop loss: 2,635.89
Pullback support
Take profit: 3,201.19
Overlap resistance
Slightly above the 50% Fibonacci retracement
High Risk Investment Warning
Stratos Markets Limited (tradu.com ), Stratos Europe Ltd (tradu.com ):
CFDs are complex instruments and come with a high risk of losing money rapidly due to leverage. 70% of retail investor accounts lose money when trading CFDs with this provider. You should consider whether you understand how CFDs work and whether you can afford to take the high risk of losing your money.
Stratos Global LLC (tradu.com ): Losses can exceed deposits.
Please be advised that the information presented on TradingView is provided to Tradu (‘Company’, ‘we’) by a third-party provider (‘TFA Global Pte Ltd’). Please be reminded that you are solely responsible for the trading decisions on your account. Any information and/or content is intended entirely for research, educational and informational purposes only and does not constitute investment or consultation advice or investment strategy. The information is not tailored to the investment needs of any specific person and therefore does not involve a consideration of any of the investment objectives, financial situation or needs of any viewer that may receive it. Past performance is not a reliable indicator of future results. Actual results may differ materially from those anticipated in forward-looking or past performance statements. We assume no liability as to the accuracy or completeness of any of the information and/or content provided herein and the Company cannot be held responsible for any omission, mistake nor for any loss or damage including without limitation to any loss of profit which may arise from reliance on any information supplied by TFA Global Pte Ltd.

ETHUSD Outlook!**Swing Analysis →Daily chart**
Price is in a bullish trend. We recently saw a correction towards discounted prices on daily timeframe. I am expecting longs around the marked OB{2335.8-2102.89} which lines up with the weekly key level around {2122.50}. From this point we could potentially see buyers stepping in, as this level has proven to be a key area for institutions to start buying Ethereum. Swing structure is Bullish.
**Internal structure → 4H chart**
Following internal structure, price is in a bearish trend and we recently broke below the last LL and reacted from the weekly key level {2816.00{ and we saw buyers stepping in correctively to push price higher towards the previous weekly {3056.75} level/LL which lines up perfectly with daily OB {3245.99-3102.00} and 50% Fibonacci level which has been common retracement point for ETHUSD since the bearish trend has started. I am expecting shorts to push price lower towards daily OB or key level mentioned above. Initially target is 2620.68 and a break below will open doors towards the weekly key level. Internal structure is bearish.

Key growth drivers for ETHNext week and early December come with several crypto-relevant events worth watching.
On December 9–10, the Federal Reserve (FOMC) meeting will take place. The market currently prices in roughly an 80% probability of a –0.25% rate cut, which could boost overall liquidity and risk appetite, indirectly supporting the crypto market.
On December 3, Ethereum will ship its “Fusaka” upgrade to mainnet. This update introduces PeerDAS and significantly improves network throughput, marking one of ETH’s major scalability milestones.
BlackRock recently filed for the iShares Staked Ethereum Trust (November 19), signaling institutional interest in a future staked-ETH ETF and in ETH staking yield in general.
Chainlink is expected to expand its Staking v0.3 program in December, increasing staking capacity and strengthening the network’s security and economic model — an event the market views as broadly bullish.
Overall, December opens with macro shifts, a major Ethereum upgrade, and structural developments around ETH and LINK that could influence sentiment and capital flows across the crypto market.

A Bearish Chart PatternThis chart pattern is a clear bearish one and already started a down trend. So according to rules of this pattern the market may drop to 1903

ETHUSD oversold bounce back capped at 3,246The ETHUSD pair continues to display a bearish outlook, in line with the prevailing downward trend. Recent price action suggests a corrective pullback, potentially setting up for another move lower if resistance holds.
Key Level: 3,246
This zone, previously a consolidation area, now acts as a significant resistance level.
A failed test and rejection at 3,246 would likely resume the bearish momentum.
Downside targets include:
2,860 – Initial support
2,777 – Intermediate support
2,670 – Longer-term support level
Bullish Scenario (breakout above 3,246):
A confirmed breakout and daily close above 3,246 would invalidate the bearish setup.
In that case, potential upside resistance levels are:
3,350 – First resistance
3,460 – Further upside target
Conclusion
ETHUSD remains under bearish pressure, with the 3,246 level acting as a key inflection point. As long as price remains below this level, the bias favours further downside. Traders should watch for price confirmation around that level to assess the next move.
This communication is for informational purposes only and should not be viewed as any form of recommendation as to a particular course of action or as investment advice. It is not intended as an offer or solicitation for the purchase or sale of any financial instrument or as an official confirmation of any transaction. Opinions, estimates and assumptions expressed herein are made as of the date of this communication and are subject to change without notice. This communication has been prepared based upon information, including market prices, data and other information, believed to be reliable; however, Trade Nation does not warrant its completeness or accuracy. All market prices and market data contained in or attached to this communication are indicative and subject to change without notice.

ETH market snapshot ETH — Mid-term view
I don’t rule out a deeper move toward the $1800 zone, but on the daily and 3D/4D timeframes ETH is already showing clear signs of a pause: local oversold conditions, MACD convergence, and a test of the global trendline. I’m positioning long here with the idea that ETH is strong enough for buyers to step in before tagging the lower zone.
Technically, ETH is still the only attractive setup for me right now: large-scale consolidation with compression toward the $4200–4500 resistance area, where a breakout could open the way into “open sky.”
Local structure:
The first major resistance zone is $3500 — confluence of MAs + the level where the market would need to request a trend reversal confirmation.

ETH BREAKOUT: DON’T MISS THE NEXT BIG MOVE!📌 ETH/USD MARKET ANALYSIS – 30M (Professional Trader Style)
1. Overall Market Structure
- Price has been consolidating inside a descending channel.
- Forming consistent lower highs – lower lows, but selling pressure is weakening near the demand zone.
- Finally, price created a rectangle compression and then broke out aggressively above the descending trendline.
2. Key Zones
✔ Demand Zone (Strong Support): 2980 – 3010
Multiple rejections + strong bullish reactions → buyers clearly defend this area.
✔ Supply Zone (Key Resistance): 3065 – 3090
Price is approaching this zone again, but momentum suggests a high probability of BREAKING THROUGH.
3. Breakout Confirmation
The breakout candle shows:
- Strong bullish body
- Increased volume
- Clear break of previous lower high → CHOCH (Change of Character)
This signals that ETH is transitioning from a correction phase into a renewed bullish trend.
4. Trading Plan (Price Action Style)
📌 Primary Scenario – BUY the Retest
Wait for price to pull back into the broken supply zone (now a demand flip) at 3065–3075.
Enter BUY when you see:
- Rejection wicks
- Bullish engulfing
- FVG reaction
- Or any PA confirmation
🎯 TP1: 3120
🎯 TP2: 3160
🎯 TP3: 3200+
⛔ SL: Below 3045 (below breakout structure)
5. Why This BUY Setup Is High Probability
✔ Clean breakout of the descending channel
✔ Strong momentum push (not a weak fake-out)
✔ Beautiful defense at demand zone
✔ Trendline tested 3 times → valid breakout
✔ Market structure shift from bearish → bullish
6. Pro Tips
Don’t FOMO buy the breakout candle
Wait for a clean retest for better R:R
Focus on zone reaction + CHOCH + bullish momentum
Stay patient. The market always rewards disciplined traders.

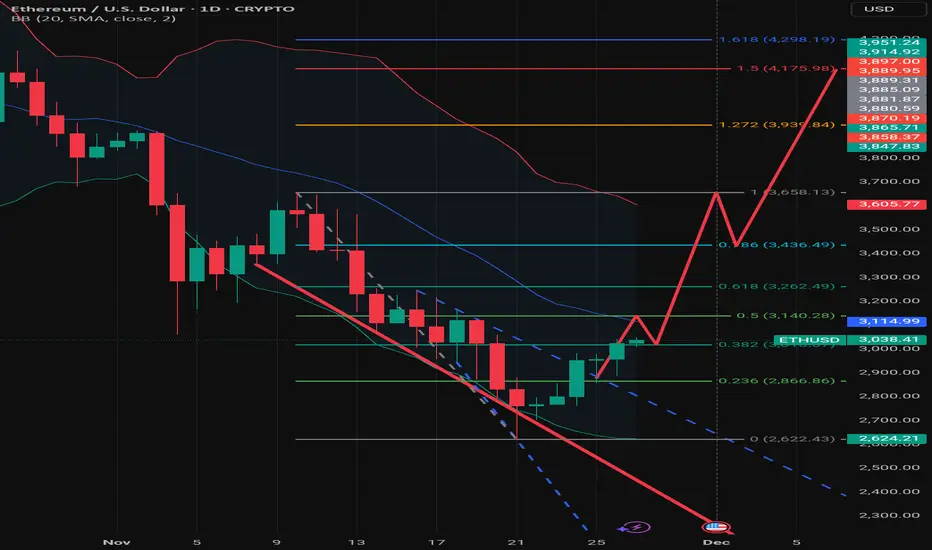
Recovering from a significant swing low.The asset has been in a downtrend (evidenced by the steep drop from the $3,658 high), but it is currently staging a sharp reversal/relief rally.
Fibonacci Retracement Analysis
The chart uses a Fibonacci retracement drawn from the high of ~$3,658 to the low of ~$2,622.
Current Battle (0.382 Level): The price is currently testing the 0.382 Fib level at roughly $3,017. This is a critical zone. Breaking and closing above this level indicates that the recovery is gaining legitimate strength rather than just being a "dead cat bounce."
Immediate Resistance (0.5 Level): If the price sustains above $3,031, the next magnet is the 0.5 Fib level at $3,140.
The Golden Pocket (0.618 Level): The most significant resistance lies at $3,262. Bearish trends often reverse back down from here. A clean break above $3,262 validates a full trend reversal to the upside.
Bollinger Bands (BB)
Mean Reversion: The price had been hugging the Lower Bollinger Band (oversold territory) but has now snapped back up.
The Middle Band (Basis): The red center line (20 SMA) is sitting around $3,114. This aligns closely with the 0.5 Fibonacci level.
Technical Insight: In a downtrend, the Middle Band often acts as dynamic resistance. The price needs to reclaim this line to flip the momentum from bearish to bullish.
Momentum Indicator (Bottom Panel)
Sharp Spike: The Momentum (Mom) indicator shows a very sharp vertical spike to 2.52. This indicates a sudden, aggressive influx of buying volume or volatility. While bullish, such sharp spikes can sometimes precede a short-term cool-off or consolidation as the market digests the move.
Summary of Critical Levels
Level Type Price Significance
Resistance 1 $3,114 - $3,140 Confluence of Middle Bollinger Band and 0.5 Fib.
Resistance 2 $3,262 The 0.618 "Golden Pocket" (Major Pivot).
Resistance 3 $3,658 Previous Swing High.
Support 1 $2,866 The 0.236 Fib level.
Support 2 $2,622 The recent Swing Low (Must hold for bullish case).
Verdict
The chart shows a strong counter-trend rally. The "Red Line" scenario is an optimistic bullish reversal setup (likely an Inverse Head and Shoulders or Elliott Wave 1-2-3).
Caution: Until ETH closes a daily candle above the Middle Bollinger Band ($3,114) and the 0.618 Fib ($3,262), the macro trend technically remains bearish/neutral.