ETH/USD Faces Resistance—Reversal or Breakout Ahead?ETH/USD is currently testing a key resistance zone after a steady bullish run supported by a rising trendline. Price has entered an area of previous supply and could face selling pressure near 4,686.4 unless bulls manage a decisive break above. If ETH fails to push higher, the pair may retrace toward major support and liquidity levels around 4,491 and 4,307. Watch for reactions near resistance—confirmation of rejection could signal the start of a corrective move.
This analysis is for educational purposes only and does not constitute financial advice. Trading involves risk—conduct your own research or consult a financial advisor before making any trading decisions.
ETHUSD.PI trade ideas

**ETH/USD – 15M Outlook** Big moment is on the way!!!
**ETH/USD – 15M Outlook**
Market is consolidating after a series of **Break of Structure (BOS)** and liquidity grabs.
Currently sitting near **4,597**, ETH shows two possible scenarios:
📌 **Bullish Case**
* If price breaks above **Swing High & P1D High**, it may target **Equal Highs** around 4,640+.
* A clean bullish push could accelerate into higher liquidity zones.
📌 **Bearish Case**
* Failure to hold above current highs could trigger a move toward the **Swing Low** and then test the **Strong Low (4,540)**.
* A deeper sweep may aim for **Equal Lows & OB zone (4,424–4,410)** for liquidity collection before reversal.
⚡ **Key Levels:**
* Resistance: 4,620 / 4,640
* Support: 4,540 / 4,424
👉 Waiting for liquidity sweep + structure confirmation before execution.

Which of these alt coins do you think is the strongest?I constantly monitor how each altcoin is doing compared to Btc (and compared to other alts). It's easy to get "married" to an altcoin and ride or die that coin until the end. I have no favorite coin. My favorite horse in any race is the fastest one.

ETH/USD 4h chart pattern.Looking at my chart
Key Observations
1. Trendline – Price is following a strong ascending trendline, showing bullish momentum.
2. Support Zone – Around 4,500 – 4,600 USD (highlighted yellow/blue box). Price is bouncing above this zone.
3. Breakout Point – A breakout occurred above the consolidation (around 4,800 USD).
4. Target Zones –
First Target: ~4,950 – 5,000 USD (first green box labeled "TARGET POINT").
Second Target: ~5,200 USD (upper green box labeled "TARGET POINT").
Target Projection
Immediate Target: ~4,950 – 5,000 USD
Extended Target: ~5,200 USD if momentum continues and price holds above support.
⚠ Important: If price breaks below the 4,500 USD support and trendline, bullish targets may be invalidated.

Elliot SHORT idea ETHTaking into account current price I see a posbility of retracement.
I took into account fibonacci levels to make the SL and TP

$5,000 Ethereum Price Narrative ResurfacesBINANCE:ETHUSD price has shown resilience, bouncing from $4,300 to above $4,600 and holding weekly gains of over 11%, while Bitcoin slipped. Traders now eye whether BINANCE:ETHUSD can test the $5,000 zone.
The technical chart highlights strong resistance at $4,623. A clean breakout here could open the way to $4,749 and the psychological $5,000 mark. Above that, $5,213 is the next technical target. On the downside, $4,066 remains the invalidation level.
On-chain data supports the chart setup. Exchange outflows spiked to nearly 287,000 ETH on August 26, the second-highest since July. Historically, such large withdrawals have preceded rallies, as coins moved off exchanges are less likely to be sold.
Momentum indicators also point higher. The taker buy-sell ratio briefly crossed 1, showing aggressive buyers willing to lift offers rather than wait. This pattern has often preceded strong ETH upswings.
With institutional flows adding weight, BINANCE:ETHUSD ’s price action now hinges on whether buyers can finally clear resistance and carry momentum toward $5,000.

ETHEREUM highest monthly CANDLEEthereum aims to close its highest monthly candle above $4,635, strongly bullish.

ETH/USD – 15m | Equal Highs vs Rejection Block
Price is holding around 4,415 after sideways action. Market is coiling between swing high and equal lows with both bullish and bearish paths open.
Bullish Scenario:
* Hold above 4,400–4,410 zone
* Break 4,440 swing high → extend to 4,680 equal highs
* Continuation could push toward 4,780 order block / P1D high
Bearish Scenario:
* Reject from 4,440 swing high
* Drop through 4,380 equal lows → 4,360 P1D low
* Deeper selloff could reach 4,220–4,200 rejection block
Key Levels:
* 4,780 (OB / P1D High)
* 4,680 (Equal Highs)
* 4,440 (Swing High)
* 4,380 (Equal Lows)
* 4,360 (P1D Low)
* 4,220–4,200 (Rejection Block)
💬 Will ETH break equal highs or slide into the rejection block first?

Bullish Ethereum will happen; New top happens upon 4900$After a clear pullback to 4399$ Ethereum is heading toward its ATH in order to break it. Candle shape near the bullish trendline and on the support level illustrates a bullish move to 4900$. A break at 4900$ means a new ATH at 5k and higher.

ETH/USD Bearish Chart Pattern ... ETH/USD Bearish Channel Setup 📉
Ethereum is moving inside a downward-sloping channel, confirming continuous selling pressure. Each bounce toward the upper boundary is being rejected, showing strong control from sellers.
🔻 Entry Zone: Near channel resistance (upper line)
📉 Trend: Bearish until price breaks above channel convincingly
🎯 Target Point: Marked at the lower boundary zone – sellers aiming for continuation into the target box area
⚠️ Bearish Bias:
As long as ETH trades below channel resistance, every retest offers fresh selling opportunities. Downside momentum favors continuation toward the Target Point, completing the bearish leg.
---
✨ Clear trend structure, disciplined entry, and well-defined targets give high-confidence signals for consistent profits.

Ethereum Stock Chart Fibonacci Analysis 082625Trading Idea
1) Find a FIBO slingshot
2) Check FIBO 61.80% level
3) Entry Point > 4604/61.80%
Chart time frame:C
A) 15 min(1W-3M)
B) 1 hr(3M-6M)
C) 4 hr(6M-1year)
D) 1 day(1-3years)
Stock progress:B
A) Keep rising over 61.80% resistance
B) 61.80% resistance
C) 61.80% support
D) Hit the bottom
E) Hit the top
Stocks rise as they rise from support and fall from resistance. Our goal is to find a low support point and enter. It can be referred to as buying at the pullback point. The pullback point can be found with a Fibonacci extension of 61.80%. This is a step to find entry level. 1) Find a triangle (Fibonacci Speed Fan Line) that connects the high (resistance) and low (support) points of the stock in progress, where it is continuously expressed as a Slingshot, 2) and create a Fibonacci extension level for the first rising wave from the start point of slingshot pattern.
When the current price goes over 61.80% level , that can be a good entry point, especially if the SMA 100 and 200 curves are gathered together at 61.80%, it is a very good entry point.
As a great help, tradingview provides these Fibonacci speed fan lines and extension levels with ease. So if you use the Fibonacci fan line, the extension level, and the SMA 100/200 curve well, you can find an entry point for the stock market. At least you have to enter at this low point to avoid trading failure, and if you are skilled at entering this low point, with fibonacci6180 technique, your reading skill to chart will be greatly improved.
If you want to do day trading, please set the time frame to 5 minutes or 15 minutes, and you will see many of the low point of rising stocks.
If you want to prefer long term range trading, you can set the time frame to 1 hr or 1 day

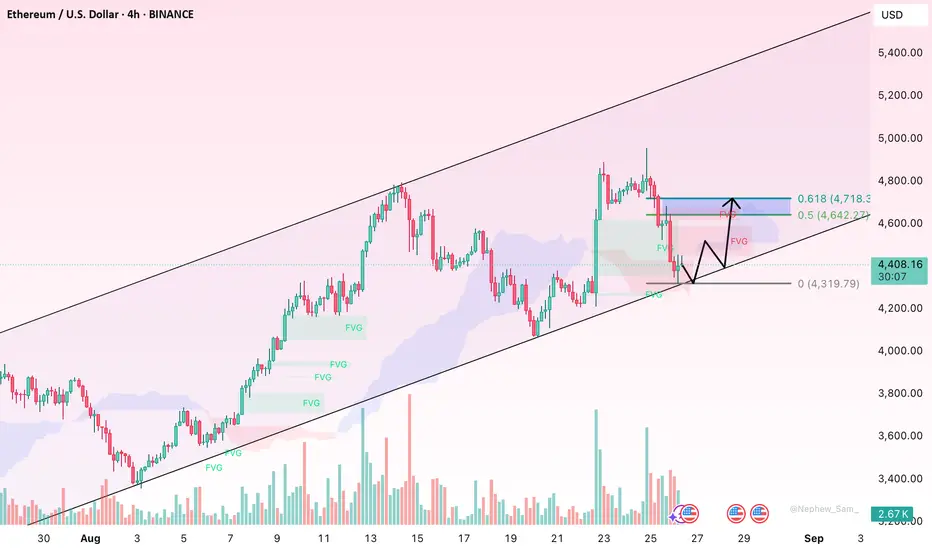
Recovery from FVG, news flow supports push toward 4.55–4.65Hello everyone, looking at the H4 chart we can see that the recent sharp drop in ETH stopped exactly at the FVG support zone of 4.30–4.36, leaving a long lower wick. From this base, price quickly rebounded to the lower edge of the Kumo and has now re-entered the cloud — a signal that selling pressure has been absorbed. The rebound also came with higher volume compared to previous pullback candles, reinforcing the possibility of recovery. On the upside, the two stacked supply FVGs at 4.55–4.65 and 4.65–4.75 are the “natural targets” for a move to retest supply.
News angle: Tailwinds for ETH
Fed rate cut expectations: After Jackson Hole, markets significantly raised the probability of a 25bps Fed cut as soon as September, with major banks (like Morgan Stanley) also shifting their forecasts. Lower rates mean broader liquidity, which benefits risk assets such as ETH.
ETF/ETP inflows: According to CoinShares, this month Ether is leading inflows into digital investment products, reversing the trend against Bitcoin. This is a sign that market sentiment is leaning towards ETH.
Improved ETF liquidity: The SEC has approved the in-kind creation/redemption mechanism for crypto ETFs, allowing more efficient issuance and redemption of shares, improving tracking — a positive factor for institutional demand.
Pectra upgrade: The mainnet has been live since May 2025, enhancing performance and wallet experience, continuing to strengthen Ethereum’s long-term narrative.
Short-term noise remains: Last week still saw some outflows from ETPs and profit-taking sales from whales, so rebounds may be choppy rather than smooth.
Connecting to technicals
With the Kumo reclaimed, the 4.30–4.36 FVG still serves as a strong support base, and the news backdrop leans positive. I favor a single scenario for the next 1–3 sessions: ETH continues moving higher, first approaching 4.50 and then filling the 4.55–4.65 FVG. This outlook only weakens if an H4 candle closes below 4.30 (breaking the cloud and slicing through support).
What’s your view on the chances of EUR/USD “breaking out of the cloud” in the coming sessions?
Ethereum at Risk? Leverage Hits Record High as AI Finance BoomEthereum (ETH), the second-largest cryptocurrency by market capitalization, is navigating a complex and dynamic environment. On one hand, Ethereum continues to emerge as the backbone of AI-powered finance, solidifying its role as the infrastructure layer for the next wave of intelligent decentralized applications. On the other hand, market participants are growing wary, as the Binance leverage ratio for ETH has surged to historic highs, a signal often correlated with heightened volatility and potential downside risk.
Adding to the intrigue, Ether recently broke out against Bitcoin, rallying by nearly 5% on Monday. While this has brought short-term optimism into the market, analysts caution that a true trend reversal will only be confirmed if ETH can flip the critical $4,700 level into long-term support.
This article explores these pivotal developments, the risks and opportunities they present, and why Ethereum remains at the center of both financial innovation and speculative fervor.
________________________________________
1. Binance Leverage Ratio Soars to Record Levels: What It Means for Ethereum
Understanding the Binance Leverage Ratio
The Binance Estimated Leverage Ratio (ELR) is a key metric that tracks the amount of open interest in derivatives relative to the reserves of the underlying asset—in this case, ETH—on the Binance exchange. A rising ELR indicates that traders are increasingly using borrowed funds (leverage) to speculate on price movements.
As of late August 2025, the ELR for Ethereum has skyrocketed to its highest level ever recorded, surpassing previous peaks from 2021 and 2022. This means that a higher percentage of Ethereum trading on Binance is being conducted with leverage, raising the stakes for both bulls and bears.
Risks of Elevated Leverage
High leverage can act as a double-edged sword:
• Volatility Amplification: Leveraged positions can exaggerate price swings. A modest move in ETH price can trigger liquidations, leading to cascading effects.
• Greater Liquidation Risk: With more traders overexposed, sudden price drops can result in mass liquidations, accelerating downward momentum.
• Market Fragility: The market becomes more vulnerable to external shocks—regulatory changes, macroeconomic data, or unexpected news events can have outsized impacts.
Historical Precedents
When the ELR reached similarly elevated levels in May 2021 and November 2022, Ethereum experienced sharp corrections shortly thereafter. These historical patterns suggest that the current surge in leverage could be a warning sign for a potential pullback—especially if ETH fails to hold critical technical levels in the coming days.
________________________________________
2. Ether Breaks Out Against Bitcoin: A Key Technical Signal
While leverage-related risk looms large, Ethereum has shown notable strength against Bitcoin in recent trading sessions. On Monday, Ether rallied nearly 5%, breaking out of a multi-month consolidation pattern against BTC. This has sparked renewed interest in whether ETH is poised to outperform Bitcoin in the near term.
ETH/BTC Breakout: A Bullish Reversal?
The ETH/BTC ratio is often used by traders to assess relative strength. A breakout in this pair suggests that Ethereum is gaining ground in terms of market dominance and investor interest.
Technical analysts point out that the ETH/BTC pair recently broke above a descending trendline that had been in place since early 2024. This move is being interpreted by many as a bullish reversal — a signal that Ethereum might be ready to lead the next leg of the crypto bull market.
The $4,700 Level: A Make-or-Break Resistance
Despite the excitement, the rally’s sustainability hinges on one key resistance level: $4,700. Ethereum previously tested this level in early 2024 but failed to break through decisively. Flipping this level into support is crucial for validating the current uptrend.
• Short-Term Bull Case: If ETH consolidates above $4,700, it could open the door to a retest of the all-time high around $4,870 and potentially push toward the psychologically significant $5,000 mark.
• Bearish Scenario: If ETH fails to hold $4,700 and falls back below, it could trigger another round of liquidations, especially given the high leverage environment.
•
With the Ethereum market teetering on a technical knife-edge, all eyes are now on price action around this critical level.
________________________________________
3. Despite Volatility, Ethereum Is Cementing Its Role as the Backbone of AI-Powered Finance
While short-term risks dominate headlines, Ethereum is quietly laying the foundation for the next generation of decentralized, AI-powered financial systems. The convergence of blockchain and artificial intelligence (AI) is rapidly evolving, and Ethereum is emerging as the preferred platform for this fusion.
Why Ethereum?
Ethereum’s core strengths make it uniquely suited to become the infrastructure layer for AI-integrated finance:
• Smart Contract Flexibility: Ethereum’s programmable contracts allow developers to build complex autonomous systems that interact with external data.
• Network Effects: With the largest developer community in Web3, Ethereum benefits from continual innovation and support.
• Layer-2 Scaling: Rollups and other Layer-2 solutions (e.g., Arbitrum, Optimism) enable Ethereum to handle greater transaction throughput, crucial for AI applications that require real-time data processing.
•
Key Use Cases for AI on Ethereum
1. Autonomous Financial Agents
Smart contracts can be paired with AI agents to create self-governing financial bots that execute trades, manage portfolios, or optimize yield strategies in DeFi protocols. These agents can adapt to market conditions faster than human traders, offering a competitive edge.
2. Decentralized AI Marketplaces
Ethereum-based platforms like Ocean Protocol and SingularityNET allow users to buy, sell, or license AI models and data sets. These marketplaces are democratizing access to AI, enabling developers and researchers to monetize their work without intermediaries.
3. On-Chain AI Inference
Projects are now exploring how to run AI inference—the process of making predictions from trained models—directly on-chain or via decentralized compute networks. This allows for truly censorship-resistant and transparent AI decision-making in areas like lending risk assessment and insurance underwriting.
4. AI-Powered Oracles
Oracles such as Chainlink are integrating AI to enhance the reliability and relevance of off-chain data delivered to smart contracts. This enables more accurate, real-time inputs into DeFi protocols, insurance contracts, and prediction markets.
________________________________________
4. Institutional Interest & Regulatory Clarity Fuel Ethereum’s Growth
Beyond technological innovation, Ethereum is also benefiting from increased institutional interest and a clearer regulatory environment in key markets.
Spot ETH ETFs Drive Demand
The approval of spot Ethereum ETFs in several jurisdictions — including the U.S., Europe, and Asia — has contributed to a surge in institutional demand. These financial products allow traditional investors to gain exposure to ETH without dealing with wallets or private keys.
In the months following ETF approvals, Ethereum saw:
• A sharp increase in institutional inflows.
• Greater liquidity and reduced volatility.
• Renewed bullish sentiment among long-term holders.
Regulatory Clarity Emerges
Regulatory bodies have begun to differentiate Ethereum from other crypto assets, often classifying it as a commodity rather than a security. This distinction has major implications for how ETH is treated under financial regulations, and further cements its status as a legitimate and investable asset.
________________________________________
5. What Comes Next: Scenarios to Watch
Bullish Scenario
If Ethereum can maintain momentum and flip $4,700 into support in the coming days, the path to new all-time highs becomes much clearer.
• Key Price Levels: After $4,700, the next resistance is at the 2021 all-time high of $4,870. Beyond that, price discovery could push ETH toward $5,200–$5,500.
• Narrative Boost: A growing narrative around AI + DeFi convergence could bring a fresh wave of speculative interest and developer activity to the Ethereum ecosystem.
Bearish Scenario
However, if ETH fails to hold $4,700 and the high leverage ratio on Binance triggers a liquidation cascade, a retracement to $4,300 or even $4,000 is possible in the short term.
• Market Sentiment: Leverage unwinding could lead to panic selling, particularly among retail traders.
• Macro Risk: Any unfavorable macro developments (e.g., interest rate hikes, geopolitical tensions) could exacerbate the downtrend.
________________________________________
Conclusion: Ethereum at a Crossroads
Ethereum stands at a crossroads — balancing short-term price volatility against immense long-term potential. The record-high leverage ratio on Binance is a flashing warning sign for traders, suggesting the possibility of a pullback in the face of overheated speculative behavior.
Yet beneath the surface, Ethereum is evolving into the foundational layer of AI-powered, decentralized finance. As smart contracts become smarter and more autonomous, Ethereum’s role as the infrastructure for intelligent financial systems is becoming increasingly clear.
The recent 5% rally and breakout against Bitcoin signal optimism, but all eyes are now on $4,700. If this critical level becomes support, Ethereum could be poised for a breakout that finally fulfills its promise — not just as a digital asset, but as the backbone of an entirely new financial era.
Bearish reversal off 50% Fibonacci resistance?Ethereum (ETH/USD) is reacting off the pivot which is a pullback resistance that aligns with the 50% Fibonacci retracement and could drop to the swing low support.
Pivot: 4,644.35
1st Support: 4,106.00
1st Resistance: 4,948.64
Risk Warning:
Trading Forex and CFDs carries a high level of risk to your capital and you should only trade with money you can afford to lose. Trading Forex and CFDs may not be suitable for all investors, so please ensure that you fully understand the risks involved and seek independent advice if necessary.
Disclaimer:
The above opinions given constitute general market commentary, and do not constitute the opinion or advice of IC Markets or any form of personal or investment advice.
Any opinions, news, research, analyses, prices, other information, or links to third-party sites contained on this website are provided on an "as-is" basis, are intended only to be informative, is not an advice nor a recommendation, nor research, or a record of our trading prices, or an offer of, or solicitation for a transaction in any financial instrument and thus should not be treated as such. The information provided does not involve any specific investment objectives, financial situation and needs of any specific person who may receive it. Please be aware, that past performance is not a reliable indicator of future performance and/or results. Past Performance or Forward-looking scenarios based upon the reasonable beliefs of the third-party provider are not a guarantee of future performance. Actual results may differ materially from those anticipated in forward-looking or past performance statements. IC Markets makes no representation or warranty and assumes no liability as to the accuracy or completeness of the information provided, nor any loss arising from any investment based on a recommendation, forecast or any information supplied by any third-party.

EthereumUSD ETHUSD Bullish,till canceledI am bullish in ETHUSD on D tf.
Exüecting first ETH to come down to 4378. there I will accumulate more longs, only if the level holds.
If breaking down, I will exit and wait for bearish signal, that begins at 4053. A break down below the red level I will get engaged bearish.
If so, ETH bears will target the gaps (yellow squares).
Bullish targets are 4962,50515 and 5773
Stop will be trailed only on risk tolearnce and account risk.

Zoom out Ethereum $ETHEthereum seems to be repeating the process that started the 2016-2017 mega run.

$Eth needs a bit of a revampIn the 4-hour timeframe, I expect Ethereum to test the ceiling once again and then see a drop to 3840. A strong support that can lead to a price rejection. In case of further decline, 3400 is the best and most attractive price to buy. Be careful not to buy yet. War conditions in the Middle East are likely to arise, which will have a major impact on financial markets. BINANCE:ETHUSD

ETHUSD (30M) – Key Breakout Zone at 4,538Structure | Trend | Key Reaction Zones
ETH recovering after a swing low liquidity grab 🟡 at 4,206–4,250 demand zone.
Market now facing short-term resistance around 4,538 (key breakout point) ⚡.
Above that lies a major supply zone 🔴 between 4,677–4,950.
Market Overview
Recent bounce from the strong demand base shows bullish pressure building.
Price is consolidating in a flip zone (support/resistance) before testing 4,538.
Breakout confirmation will decide if ETH rallies toward higher supply levels.
Key Scenarios
Bullish Path 🚀
If ETH breaks and holds above 4,538 →
🎯 Target 1 → 4,677
🎯 Target 2 → 4,800–4,950 supply zone
Bearish Path 🔻
Failure to break 4,538 may trigger a pullback →
🎯 Support 1 → 4,450
🎯 Support 2 → 4,321 (critical)
🎯 Strong demand → 4,206–4,250
Levels to Watch
Resistance: 4,538 / 4,677 / 4,950
Support: 4,450 / 4,321 / 4,206
⚠️ Disclaimer: This analysis is for educational purposes only, not financial advice.

ETH Long Setup 4000$ was a resistance and its now support so he come 1 time back we hit ATH and now we come back for the final Move much conflunce Trendline FiB engulf lets go

#ETH/USDT#ETH
The price is moving within a descending channel on the 1-hour frame and is expected to break and continue upward.
We have a trend to stabilize above the 100 moving average once again.
We have a downtrend on the RSI indicator that supports the upward move with a breakout.
We have a support area at the lower boundary of the channel at 4300, acting as strong support from which the price can rebound.
We have a major support area in green that pushed the price upward at 4330.
Entry price: 4544.
First target: 4646.
Second target: 4830.
Third target: 4995.
To manage risk, don't forget stop loss and capital management.
When you reach the first target, save some profits and then change your stop order to an entry order.
For inquiries, please comment.
Thank you.

ETH - possible correction?Bearish div. on the daily TF
Observing an uptrend which has been in play since June. If this is broken a correction could be the next move for Ethereum.
We've also recently tested the ATH. History has taught us that once price tests the ATH and move down is usually the next move to occur (e.g. SOL, XRP, BNB etc).
A correction to 3K could make sense 📉 (0.618 fib)
Else price break back above the ATH which would trigger a parabolic move to the upside.
Keep your eye on the trendline 👀

ETH/USD Weekly Outlook: Ethereum ETF Inflows Hit $1.07B, Price HPair: ETH/USD
Current Price: 4375.00
Trend: Uptrend correction near Murray
⸻
🔵 Bullish Scenario
• Entry: BUY STOP 4570.00
• Targets: 5000.00, 5625.00
• Stop-Loss: 4320.00
🟢 Alternative Bullish Scenario
• Entry: BUY LIMIT 3750.00
• Targets: 5000.00, 5625.00
• Stop-Loss: 3400.00
⸻
📊 Key Levels
• Resistance: 5000.00, 5625.00
• Support: 4375.00, 3750.00
⸻
📈 Technical Picture
• Bollinger Bands: directed upward, middle band supports 4375.00
• MACD: still positive, though momentum is slowing
• Stochastic: turned down, signaling limited correction before potential rebound
⸻
📌 As long as ETH stays above 4375.00, the bullish outlook remains intact. A breakout above 5000.00 would reopen the path toward 5625.00.

short-term ETH (Ethereum) analysis1. Current Price Structure
ETH is consolidating after a strong upward move.
A descending triangle pattern is visible, showing lower highs compressing toward flat support.
Price is sitting near $4,750–$4,800 zone, with weakening momentum.
2. Bearish Short-Term Path
Chart projection suggests ETH may first break down from the triangle.
If this occurs, ETH could fall toward the $4,100–$4,200 zone (green line marked).
This aligns with the previous strong breakout level, which now acts as major support.
3. Bullish Recovery Path
After testing support near $4,100, a sharp reversal bounce is possible.
If that happens, ETH could rally back quickly toward $4,800–$5,000 first, and then attempt a move toward $5,400–$5,500.
This scenario matches the V-shaped recovery projection drawn in red on the chart.
4. Short-Term Outlook
Bearish bias in the immediate term (due to descending triangle breakdown risk).
Bullish medium-term recovery remains valid as long as ETH holds above $4,000–$4,100 support.
The key level to watch short-term: $4,650. A clean break below opens the door for a deeper correction.
✅ Conclusion (Short-Term View):
ETH looks vulnerable to a near-term dip toward $4,100–$4,200, but this zone is expected to act as a strong demand area. From there, a sharp bullish reversal toward $5,000+ is possible. Traders should be cautious of the short-term breakdown but prepare for a recovery swing from major support.
Disclaimer:
This analysis is for educational and informational purposes only and should not be considered as financial advice. Trading and investing in cryptocurrencies involve significant risk, including the potential loss of capital. Please conduct your own research and consult with a qualified financial advisor before making any trading or investment decisions.
