The Trade You Hesitated OnLet’s be honest: your biggest losing trades over the last month were those you didn’t take when you ought to have done.
Your finger hovered over the button. Heart racing. Logic said yes, fear whispered no. And you froze.
I’ve seen this in every kind of trader, from retail accounts to fund managers running millions.
Hesitation doesn’t discriminate.
It’s rarely about your system. It’s about the self:
The memory of the last loss still echoing.
Second-guessing your judgment.
Fear of being wrong.
The hardest trade isn’t with the market.
It’s with your own mind in the moment of decision.
If this resonates, hit follow for more.
ETHUSD.PI trade ideas

ETHUSDTNote that these analyzes are only for recording personal accounts and journals that will be reviewed in the future.
Please do not enter into any trade just by viewing the analysis, thank you.

ETHUSD🔎 Chart Setup
ETH/USD 1H → Bearish flag = continuation pattern AB=CD
ETH Dominance (D) → Also breaking flag = confirms weakness in ETH vs other alts/majors
📊 Trade Plan
⚠️ Manage risk strictly (crypto volatility is brutal):
Entry: On breakdown retest of the flag support line 🟥
Stop Loss (SL): Just above flag resistance
rofit (TP):
🎯 TP1 (1:1 RR) → Secure partial profits (50% book)
🎯 TP2 (1:2 RR) → Let rest run, trail SL
💡 Risk Management
Max 1%–2% account risk per trade ⚖️
Always use hard stop, don’t widen 🚫
Partial booking keeps you safe + confident 🛡️

ETH/USD (Ethereum – 2h, Coinbase).ETH/USD (Ethereum – 2h, Coinbase). mymarked a bullish setup with a corrective move and trendline support.
Key Levels on my Chart:
Current Price: ~4,423
Support Zone (1st Target): ~4,050 – 4,100
Trendline Support: Rising diagonal trendline shown on chart
Last Target (Resistance): ~4,900 – 5,000
Technical Outlook:
Price recently pulled back from ~4,900 and is now retracing towards the trendline.
The 1st Target zone (~4,050–4,100) aligns with both horizontal support and trendline confluence → this is a likely bounce area.
If ETH respects this support, the bullish scenario suggests continuation upward.
The Last Target is clearly marked on my chart at ~4,900–5,000, which is the next major resistance zone.
👉 Targets:
1st Target (Support for bounce): ~4,050 – 4,100
Last Target (Upside objective): ~4,900 – 5,000

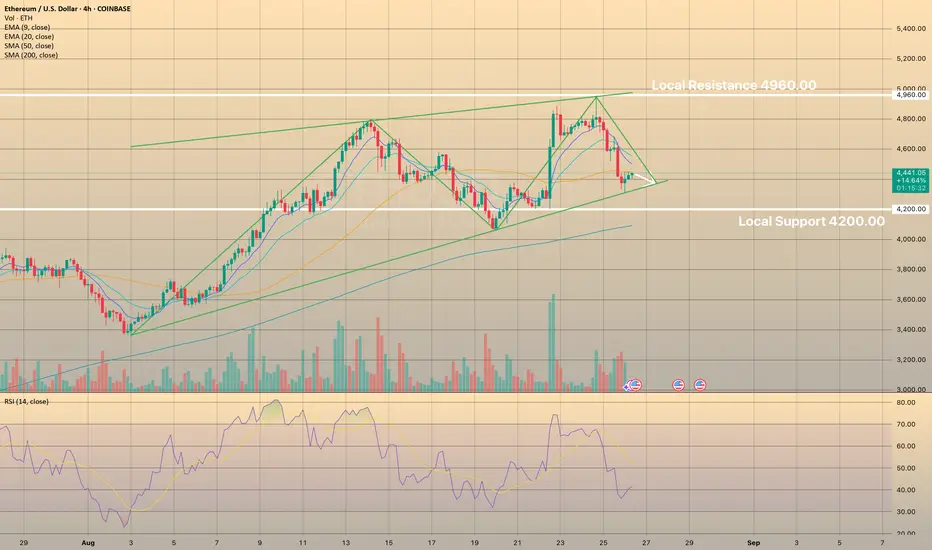
ETHUSD support at 4,220The ETHUSD remains in a bullish trend, with recent price action showing signs of a corrective pullback within the broader uptrend.
Support Zone: 4,220 – a key level from previous consolidation. Price is currently testing or approaching this level.
A bullish rebound from 4,220 would confirm ongoing upside momentum, with potential targets at:
4,870 – initial resistance
5,000 – psychological and structural level
5,100 – extended resistance on the longer-term chart
Bearish Scenario:
A confirmed break and daily close below 4,220 would weaken the bullish outlook and suggest deeper downside risk toward:
4,105 – minor support
3,980 – stronger support and potential demand zone
Outlook:
Bullish bias remains intact while the ETHUSD holds above 4,220. A sustained break below this level could shift momentum to the downside in the short term.
This communication is for informational purposes only and should not be viewed as any form of recommendation as to a particular course of action or as investment advice. It is not intended as an offer or solicitation for the purchase or sale of any financial instrument or as an official confirmation of any transaction. Opinions, estimates and assumptions expressed herein are made as of the date of this communication and are subject to change without notice. This communication has been prepared based upon information, including market prices, data and other information, believed to be reliable; however, Trade Nation does not warrant its completeness or accuracy. All market prices and market data contained in or attached to this communication are indicative and subject to change without notice.

Gold (XAUUSD): Awaiting a breakout from consolidationAnalysis: Gold has been moving within a symmetrical triangular pattern, indicating a period of consolidation. The price has tested both the upper and lower trendlines multiple times, showing strong respect for these levels. This pattern suggests that a significant move is imminent, but the direction is not yet clear.
Prediction: The market is poised for a breakout. If the price successfully breaks above the upper trendline, it could signal a strong bullish move towards the next resistance level. Conversely, a break below the lower trendline could lead to a sharp decline.
Strategy: Wait for a confirmed breakout. For a long position, consider buying on a successful break and retest of the upper trendline near $3,399. The stop loss could be placed below the previous swing low. For a short position, consider selling on a break below the lower trendline, with a stop loss above the recent swing high.

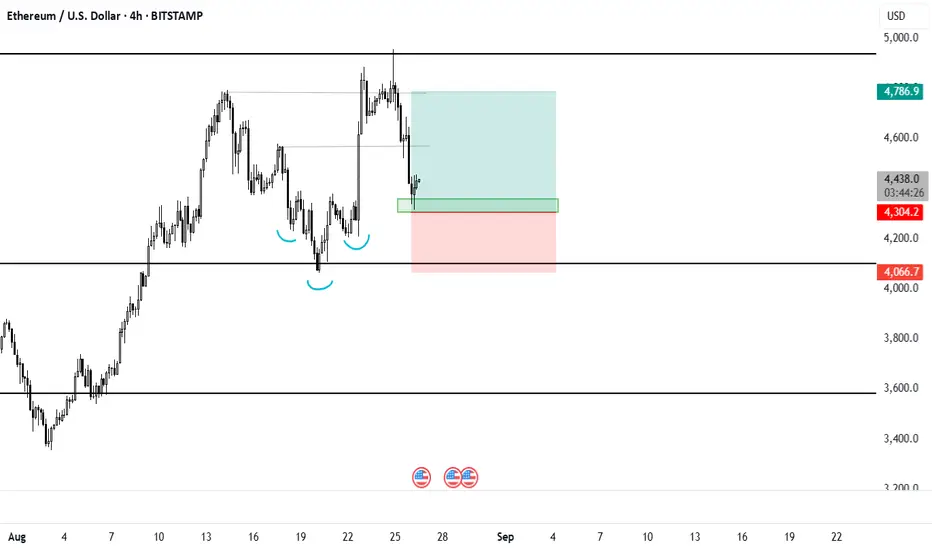
Ethereum (ETH/USD): ¿Corrección o impulso para nuevos máximos?
Analysis: The price of ETH has had a strong rally, surpassing the $4,400 level. However, in recent days it has shown a slight correction, which could indicate a pause before continuing the ascent.
Prediction: This current consolidation could be an opportunity. If the price holds above $4,200, it could be preparing for a new upward impulse with the goal of breaking $4,800 and seeking new all-time highs. On the other hand, if it loses that support, it could fall back towards $4,000.
Strategy: A buying position could be considered if the price shows strength above $4,400. The stop loss (to limit losses) could be placed just below the support level of $4,200. The take profit (to take profits) could be in the area of $4,800.

ETH slides post-ATH, Network fundamentals stay strongETH Slides Post-ATH, Network Fundamentals Stay Strong
Altcoins slid as Bitcoin and Ethereum retreated, with ETH dropping 7% to $4,313 despite recent highs and strong inflows. Market cap fell by $200B.
BitMine Immersion Technologies seized the dip, buying 4,871 ETH for $21.3M, boosting its holdings to 1.72M ETH (~$7.5B), about 40% of all corporate ETH reserves. Its crypto assets rose by $2.2B in a week, with NAV per share hitting $39.84, reinforcing its lead in ETH treasuries.
Ethereum surged 200% since April lows, but network activity tells the bigger story. On-chain metrics show strong fundamentals: 75% of revenue from priority fees and MEV, $156B in stablecoins (+14% since July), and ~$6B daily L1 settlements. L2 adoption is also accelerating, led by Coinbase’s Base.
Despite structural growth, volatility persists: ETH plunged $550 after a new ATH, liquidating $110M in leveraged positions. Currently at $4,445 (-5.5% daily, +5.3% weekly), ETH still outperforms the broader market.
The Ethereum Foundation is pushing its Trillion Dollar Security initiative to enhance wallet and contract safety, aiming for long-term sustainability.
Strategy Idea: “React, Don’t Predict” ETH at Decision ZoneHey Traders, Ethereum recently made a strong move up to around $3,600. Now it’s slowing down, and we’re at a key decision point. Two things can happen from here:
Option 1 – Pullback:
If the price drops, watch the $3,200–$3,300 zone. That area could act as support. If a strong bullish candle forms there (on the daily or 4H chart), it could be a good buying opportunity.
Option 2 – Breakout:
If ETH stays above $3,550 and breaks the recent high with strong momentum, price could move toward $3,800 or even $4,000. Only buy if the breakout is clear and strong.
Basic Plan for New Traders:
Wait for confirmation before entering
Don’t buy the top
Use stop loss to manage risk
Only risk what you can afford to lose
Be patient. No setup = no trade
Reminder:
We don’t predict, we react. Let the chart show the move, then decide. Stay safe and stick to your plan.
Don't forget to follow me, boost this content, and comment if you like this strategy idea or have any questions.
-Neo
ETH is at a turning point — What would you do?Hey traders, how's everything going with you?!
The price has been increasing for days, but now it’s slowing down. From here, ETH can either:
🟢 Go higher and continue the uptrend
🔴 Or drop and start a pullback
This is a key moment. Some traders are preparing to buy the breakout, others are waiting to sell the drop, and some are watching for more clues.
👉 If this were your chart, would you do:
Buy?
Sell?
Wait?
Comment below and let’s learn from each other 👇. I would also appreciate it if you could hit the boost and follow!
Have a great day, everyone!
-Neo
Ethereum Bullish Entry after weekly Fib support touch.Weekly Fib support touched! Longing my Eth from here with stop loss mentioned in chart.
Simple supply and demand / Support and resistance trade. Do not make it complicated.
ETH/USD – 15m | Testing Order BlockPrice is reacting near 4,590 after a BOS (break of structure). Market sits at a key order block with upside and downside setups ready.
Bullish Scenario:
* Hold above 4,560–4,590 zone
* Break through swing high at 4,640
* Target 4,720 (P1D Low retest) → 4,760+ extension
Bearish Scenario:
* Reject from order block near 4,590–4,640
* Sweep swing low at 4,520
* Extend down into FVG zone toward 4,300–4,220 rejection block
Key Levels:
* 4,760 (Upside target)
* 4,640 (Swing High / OB)
* 4,520 (Swing Low)
* 4,300–4,220 (Rejection Block)
💬 Do you expect ETH to respect the OB and break higher, or fail into the rejection block?

The last rally - ETH weekly update Aug 25 - 31thEthereum is in the final stages of Intermediate Wave 5, which also completes Primary Wave 5 and, in turn, Cycle Wave 1. At the Minor degree, the market is currently unfolding Wave 4, while at the Minute degree we are within Wave C, which is set to complete the corrective Flat structure. If the diagonal structure of this five-wave C continues, the earliest likely completion would occur around 1 pm. From a timing perspective, the end of Wave 4 would align well with the opening of the New York trading session. The alternative scenario assumes that this correction is not yet complete and could evolve into a more complex structure.
Looking at liquidity, the order book appears relatively thin below the current level, with a significant cluster of orders around the $5,000 mark. This level also coincides with the first Fibonacci projection for Wave 5, making it a likely sell wall that could eventually trigger a trend reversal. The liquidation heatmap also shows limited liquidity, with small to medium clusters positioned near the 1.618 extension of Wave C.
Derivative data paints a neutral picture. Funding rates are balanced, and open interest is stagnant, both of which provide suitable conditions for one final push higher.
In conclusion, my bias remains long. I plan to enter long positions around the 1.618 extension level of Wave C. To refine execution, I will set an alert at this level to observe price behavior closely and make decisions based on how the market reacts there.
Once this final Wave 5 completes, Ethereum will transition into Cycle Wave 2. In crypto markets, Wave 2 corrections are often very deep, and Elliott Wave theory also expects significant retracements at this stage. Price levels in the $2,000–$3,000 range may therefore reappear. During such a selloff, capital will likely rotate into altcoins, creating fresh opportunities across the broader market.

Day trading with Ethereum using 15min TF (short and long)By examining the live price action movement, I try to analyse and forecast the market maker actions using the 15min TF chart. If the conditions fulfilled, we will see Ethereum challenging 3320 and 3330 again. I use 15min TF for day trading and cross check with 1 hour TF.
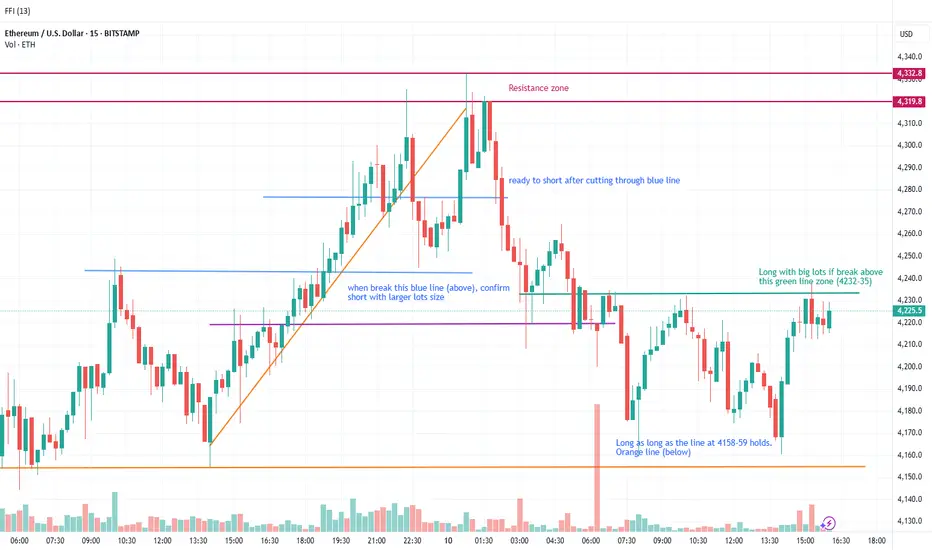
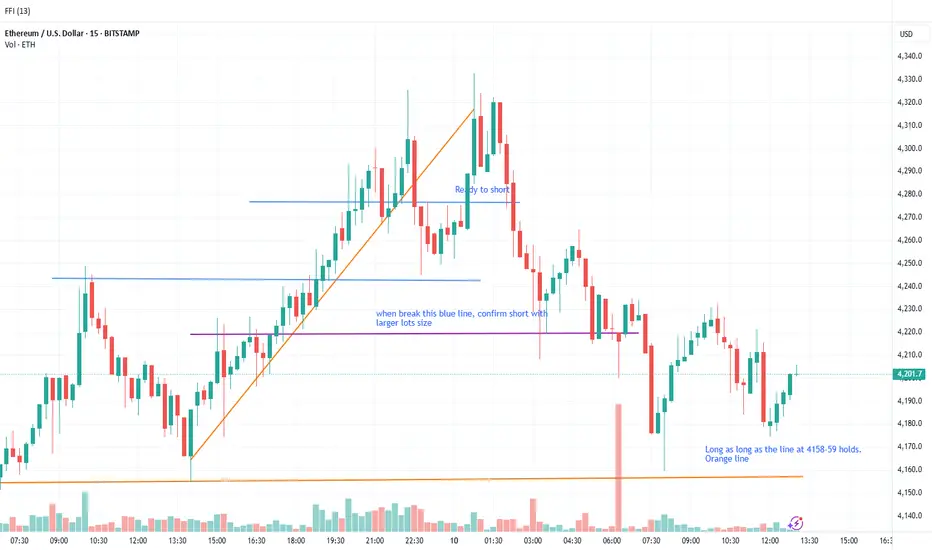
Using 15min TF to forecast the price movement action - LONGClose my shorts at 4180 and now taking a long position as long as the line at 4159 holds. This is my sharing on the Ethereum price action movement, removing all bias and purely focusing on the market maker psychology and trend. A break above the purple line (confluence zone) will confirm the Long position with bigger lots size.
Day trading Ethereum (for both Long and Short)My analysis is based on the price action movement using liquidity pool to identify turnaround or fake manipulation move. Use FVG and iFVG to identify clear confirmation for trend movement. Price action allows me to shed light on the psychology and manipulated movement driven by market maker.
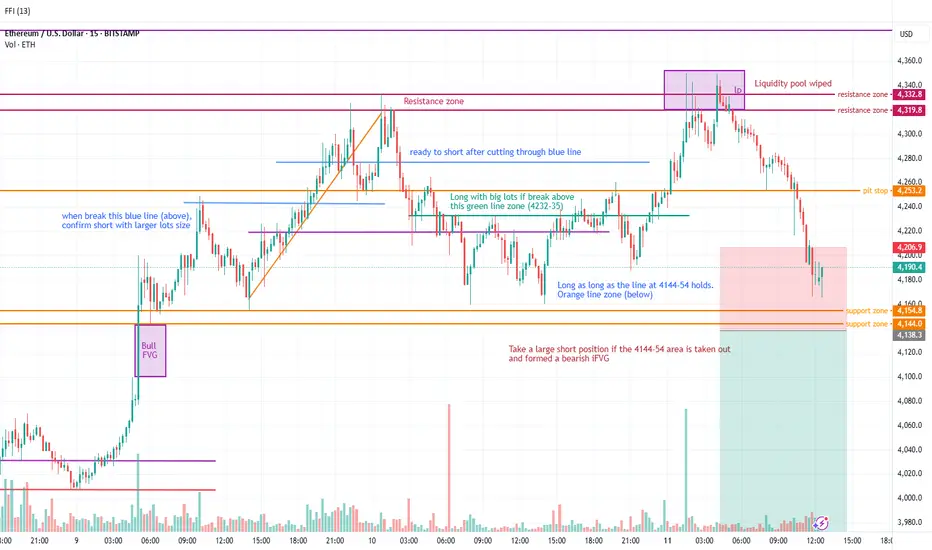
ETH short using 15-min TFI analyse the price action movement to shed light on the manipulation play and using FVG, iFVG, auction zone, support and resistance to reveal the directional bias to achieve the high win rate in leveraged and spot trading.


Rising WedgeThe price has made rising wedge followed by a breakout then a pullback now looks to go short
WE ONLY TRADE PULLBACKS


ETHUSD (1H) – Strong Breakdown After RejectionStructure | Trend | Key Reaction Zones
Price faced rejection at 4,887 (buy-side liquidity) and broke down sharply.
Currently trading near 4,375, testing the purple OB zone (4,560–4,480) as resistance.
Next liquidity sits around 4,220–4,180 demand zone.
Market Overview
The bullish push lost momentum after a sharp rejection at the top liquidity grab.
Sellers gained control after the retest of 4,664–4,657 zone.
Market structure is turning bearish, with possible deeper retracement unless buyers reclaim above 4,560–4,660.
Key Scenarios
Bullish Case 🚀
Only valid if ETH reclaims 4,560–4,660 zone.
🎯 Target 1: 4,720
🎯 Target 2: 4,880 liquidity zone
Bearish Case 🔻
Continuation below 4,375.
🎯 Target 1: 4,220
🎯 Target 2: 4,180–4,160 demand zone
Current Levels to Watch
Resistance: 4,560 → 4,660 → 4,880
Support: 4,375 → 4,220 → 4,180
⚠️ Disclaimer: This analysis is for educational purposes only. Not financial advice.

etereum elliot mogelijke play ethereum op de hoge timefram moet de 0.5 fibonaci level houden om deze telling in stand te houden voor hogere prijzen 5 tot 6 k

BTC and ETH are at all-time highs — but caution is keyWe’re officially here: CRYPTOCAP:BTC is at a new ATH, consolidating confidently above $110K. That’s a +690% move from the bottom, and not a single deep correction so far.
CRYPTOCAP:ETH is approaching $5,000 — and momentum is still strong.
👀 But let me be real for a moment:
This is not the time to FOMO into a position without a plan.
We’re at the stage where market makers are hunting liquidity (and partially closing positions).
📉 A single 15–20% wick down could trap a lot of new buyers.
What I’m doing:
🧠 Not chasing price.
✅ Holding from the lows, taking partial profits.
📊 Closely watching behavior around $115K BTC / $4,800 ETH.
🚫 No impulsive buys without a clear risk plan.
If you’re just now thinking about entering — think twice.
Don’t let the market take what someone else earned.
