ETH/USD: Could $ETH Hit $7,000 by Year-End?As of August 25, 2025, Ethereum (ETH) is trading at approximately $4,795.60, showing a steady upward trajectory since early August. This bullish momentum is supported by several key factors, including institutional interest, ETF inflows, and the ongoing strength of decentralized finance (DeFi) applications.
ETH has recently surpassed the $4,750 resistance level, indicating a potential move towards the $5,000–$5,200 range. The next significant resistance is around $5,000, which, if broken, could pave the way for a retest of the all-time high near $5,200. Conversely, support levels are found at $4,700 and $4,600–$4,400. A drop below $4,600 could signal a short-term pullback.
Ethereum's recent price surge is attributed to increased institutional demand, particularly following the launch of Ethereum ETFs, which have attracted significant capital inflows. Additionally, the Ethereum network's upgrades and the growing adoption of Layer 2 solutions have enhanced scalability and reduced transaction costs, further bolstering investor confidence.
Outlook for Q4 2025
Looking ahead, if ETH maintains its current trajectory and breaks through the $5,200 resistance, it could target the $6,000–$7,000 range by the end of the year. However, market volatility remains a factor, and investors should be prepared for potential fluctuations.
*Ethereum's current bullish trend is supported by strong technical indicators and positive fundamental developments. While the path to new all-time highs appears promising, it's crucial for investors to monitor key support and resistance levels and remain cautious of market volatility.
ETHUSD.PI trade ideas

"High-Probability ETH Trade: Uptrend Continuation Toward FVG"***short and precise analysis**
Ethereum (ETH/USD) 4H Chart Analysis – Perfect Setup
**Trend**: Clear **uptrend** identified with higher highs and higher lows.
**Support Zones**:
**Support 1**: Key minor support near the 4,340 area.
**Support 2**: Stronger demand zone marked much lower, indicating historical support.
**FVG (Fair Value Gap)**: A **huge FVG** zone above current price suggests potential for bullish continuation as price seeks to fill the gap.
**Trade Setup**:
* **Entry**:
Around the current market price (\~4,746).
* **Exit Target**:
~5,864 (based on FVG completion).
* **Stop Loss**:
Just below Support 1 (\~4,340), protecting against downside break.
* **Risk-Reward Ratio**:
Favorable long position with strong R\:R, aligning with market structure and gap theory.

ETHUSDT (15M) – Buying Zone Reaction Structure | Trend | Key Reaction Zones
ETH formed a Head & Shoulders (Bearish Pattern) ⚠️ near the channel top.
Strong drop followed from 4955 → Buying Zone (4740–4780) 💰.
Accumulation phase within the ascending channel is still intact.
Market Overview
Despite the bearish rejection at the channel top, ETH is now testing its buying zone, which could trigger a bounce.
If buyers hold this zone, ETH may attempt another push upward.
Breakdown of the buying zone may lead to deeper correction toward 4664 Add Layer Support 🛡️.
Key Scenarios
Bullish Case 🚀
Holding above 4740–4780 →
🎯 Target 1: 4887
🎯 Target 2: 4950–4960 (Channel Top)
Bearish Case 🔻
If ETH breaks below 4740 →
🎯 Target: 4664 Add Layer Support
Current Levels to Watch
Resistance: 4887 → 4950
Support: 4740 → 4664
⚠️ Disclaimer: This analysis is for educational purposes only. Not financial advice.

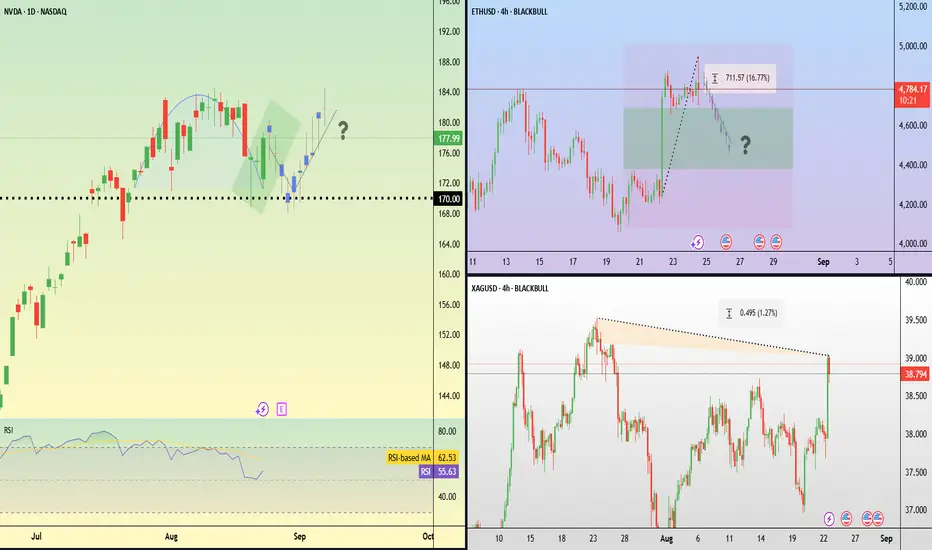
Traders caught off guard --- Now NVDA's Reverse Cup and HandleTraders were caught off guard by Federal Reserve Chairman Jerome Powell’s unexpectedly dovish tone at the Jackson Hole symposium.
In his keynote, Powell highlighted softening inflation risks and growing concerns over the labour market, boosting market expectations of a 25-basis point rate cut in September.
The speech ignited a strong cross-asset rally. Equities surged, with the S&P 500 up 1.5% and the Nasdaq advancing 1.9%. Ethereum led digital assets higher, soaring 15%, climbing as high as $4,950 and surpassing its previous November 2021 high of $4,866. Silver also rallied, touching $39 per ounce and moving closer to its 14-year peak of $39.5 reached at the end of July.
Looking ahead, U.S. markets will turn their focus to Nvidia’s upcoming earnings results. Price action shows a series of higher highs and higher lows, but the stock has recently faced resistance near $190. Price potentially remains supported around $170, which aligns with the breakout zone from early August.
Missed the ETH Rally? Here’s the Smart Way to Join With Low RiskMissed the ETH Rally? Here’s the Smart Way to Join With Low Risk
If you feel like you missed Ethereum’s latest rally, don’t worry, you might be right on time.
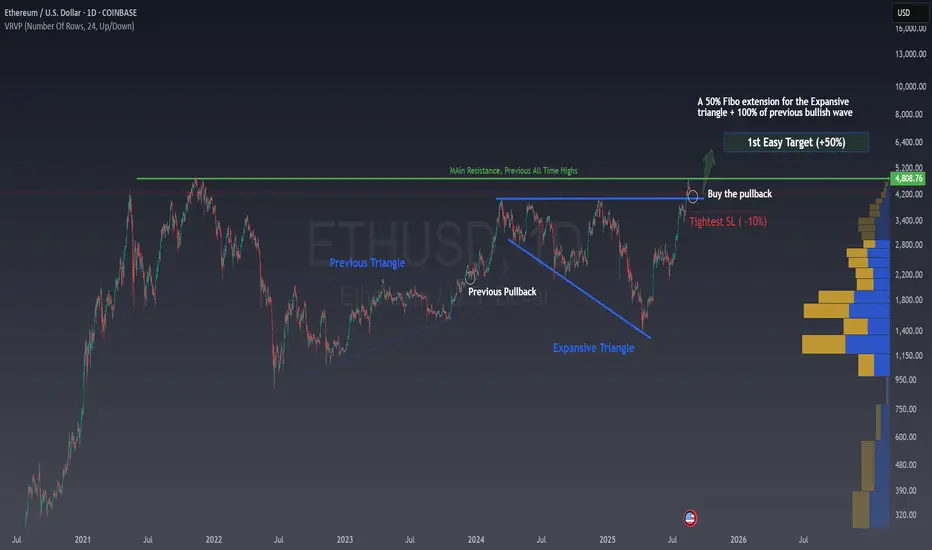
Instead of chasing price at the highs , COINBASE:ETHUSD is offering a classic setup, a pullback after breaking out of a big expansive triangle pattern.
Why This Setup Stands Out
ETH didn’t just break any level, it cleared a very important resistance zone after one year of trying it. That’s huge. Now, price has come back to retest this same area, which is turning into support.
This is where smart money pays attention . Instead of buying the breakout blindly, waiting for the pullback gives you both confirmation and a much tighter trade.
Entry : Buy the pullback into support
Stop Loss (tight) : ~10% below the level to use previous resistance levels as supports.
Target : +50% upside, aligning with the 50% Fibonacci extension of the expansive triangle and the projection of the previous bullish leg (100%). The price could move even higher after an expansive triangle, but I do prefer to lock in profits fast an earn 50% than waiting months or years.
❗ ETH Has Done This Before
This isn’t the first time Ethereum sets up like this. In a previous cycle, ETH also broke above resistance, pulled back to retest it, and then launched into another major rally.
Look, during 2022 and 2023 a triangle formed, and after the breakout the price made a perfect pullback, offering the very same setup. So, we’re probably at the start of something big.
Those who waited for the pullback not only avoided stress , but also captured the move with an outstanding risk/reward profile.
Why Pullbacks Beat Breakouts
Pullbacks are the trader’s secret weapon:
They confirm that the breakout is real, filtering out most false signals
They give you a clear invalidation point (tight stop just below support)
They maximize your reward-to-risk ratio
In this case, you’re looking at risking -10% for the chance of a +50% gain .
That’s the kind of math every trader should love.
🤔 Ok, sounds good... but have we actually benefited from this kind of setup before?
Absolutely. I’ve shared multiple ideas based on pullbacks. Just take a look at LLY, where we recently bought right at an amazing support level with strong bullish potential.
Or the COINBASE:DOGEUSD idea...
Or the one also unfolding now in COINBASE:HBARUSD !
👉 Whether you’re trading ETH or any other market, remember this:
Pullbacks are smarter than chasing green candles. They let you join big moves without the FOMO, and with far better odds.
💬 Does this setup align with your view on COINBASE:ETHUSD ?
🚀 Hit the rocket if this helped you spot the opportunity and follow for more easy, educational trade ideas!
Final TargetIt looks like Ethereum has reached the end of wave 3 of the bullish cycle and is likely heading for a correction into wave 4

Chart Patterns – Key to Market MovementsChart patterns are the roadmap to market psychology. They show where the market is likely to go, based on previous price action.
Understanding these patterns can give you a significant edge in making trading
Description:
📌 **Pattern 1 – Trendline Breakout**
* Price forms higher lows along a trendline.
* Breakout above resistance confirms bullish momentum.
* ✅ Entry only after **retest of the trendline**.
* 🎯 Target → continuation toward higher liquidity zones.
📌 **Pattern 2 – Bull Flag**
* A bullish continuation setup after a strong impulse.
* Breakout above flag = confirmation of trend continuation.
* ✅ Entry comes after **retest of flag resistance**.
* 🎯 Target → measured move equal to previous impulse.
⚡ **Key Lesson:**
Breakouts without retest = retail trap.
Breakouts with retest = professional entry.
📌 **Step 1 – Double Bottom (W Pattern)**
* This pattern indicates a **bullish reversal** from the support zone.
* Entry comes after the **breakout above the neckline**.
📌 **Step 2 – Breakout & Retest**
* After the breakout, wait for the **retest** of the neckline (support turned resistance).
* Once price confirms the retest, it’s a **high probability buy**.
📌 **Step 3 – Target**
* Target = measured move from the bottom of the W pattern to the neckline.
* This gives a strong risk-to-reward ratio for continuation.
💡 **Key Lesson:**
A **retest** confirms the trend continuation — don’t chase breakouts. Wait for confirmation before entering!
ETH 2H – Bullish Retest, Eyes on $5K+?Ethereum is consolidating just above the $4,727 support, holding inside a short-term demand zone while showing signs of continuation. The recent breakout candle suggests strong momentum, and traders are watching for a clean retest before a possible leg higher.
Bullish case: If ETH continues to hold above $4,727, a move toward $5,000–5,200 is likely, supported by bullish momentum on lower timeframes.
Bearish case: Losing $4,727 would weaken short-term structure, with deeper demand sitting around $4,100 where buyers previously stepped in.
The Stoch RSI is curling upward, suggesting a potential shift back to bullish pressure after cooling.
Key levels:
Immediate support: $4,727 (short-term demand zone)
Next resistance: $5,000–5,200
Deeper demand: $4,100
ETH remains positioned for continuation — the key is whether $4,727 holds as the launchpad.


ETH 1H | Eyes Back on ATHETH 1H Update
After yesterday’s incredible run following Powell’s speech, ETH stalled at the ATH and pulled back overnight, ranging inside the green zone.
Right now, price looks ready to close above the BB center and possibly push past the green range and last week’s high for another attempt at ATH levels.
If that happens, PSAR will flip bullish again, confirming short-term upside momentum.
RSI has cooled off, and MACD looks close to turning green.
Always take profits and manage risk.
Interaction is welcome.

ETHUSD: Will Go Down! Short!
My dear friends,
Today we will analyse ETHUSD together☺️
The market is at an inflection zone and price has now reached an area around 4,816.8 where previous reversals or breakouts have occurred.And a price reaction that we are seeing on multiple timeframes here could signal the next move down so we can enter on confirmation, and target the next key level of 4,802.3.Stop-loss is recommended beyond the inflection zone.
❤️Sending you lots of Love and Hugs❤️

$ETH Looks appealing, there is nothing much to discuss its laggard in my opinion i already put the next target, but if someway it failed to create new ATH the SL is in your hand, the movement is very predictable hope you're all happy ! cheers.
tip jar appreciated.

(ETH/USD): Bullish Breakout and Upside Target AnalysisThe Ethereum (ETH/USD) 15-minute chart shows a bullish breakout after the price broke above a descending trendline and a consolidation zone. This suggests upward momentum with a potential target near $4,845. Support levels around $4,755 serve as a stop-loss zone to manage risk. The setup indicates a favorable risk-to-reward trade opportunity for short-term gains.
Disclaimer: Trading cryptocurrencies involves significant risk and is not suitable for all investors. Past performance does not guarantee future results. Always conduct your own research and use risk management strategies before trading.

Ethereum Remains Technically Solid Bullish Background ConfirmedOverall Market Sentiment
Looking at TipRanks data, ETH is receiving Strong Buy signals on the daily, weekly and monthly timeframes, with a strong dominance of "Buy" on the moving averages (12 Buy) and moderately positive dynamics on the oscillators
Price indicators (EMA20, EMA50, EMA100, EMA200) are significantly below the current price, which confirms a stable uptrend.
Key support and resistance levels
Support:
around $4,030-4,100, where an important foundation has been built in case of a reverse movement.
Resistance:
The previous zone of $4,300-4,350, where the price has repeatedly encountered difficulties.
A confident breakout is a possible path to $4,576 (the maximum of the 24-hour range) and further up.
Technical indicators and signals
Daily and weekly timeframes — "Strong Buy".
RSI ~55–56 (Buy), MACD — Buy. Other oscillators give a neutral signal.
Trade Plan from Binance (ETH/USDT):
Current price is around $4,336, below EMA7 ($4,398), but above EMA25 ($4,044) — confirms the medium-term bullish trend.
Possible rebound from support $4,278–4,300, targets — $4,398, $4,576 and then $4,781 upon breakout. Risk — fall to $4,043 upon breakout of EMA25.

SELL ETHYou can see there are a trend line here and the market show respect to the trend line but the buyer are fake so a am going for sell when it show a little respect to the trend line and make move for buying .. what gonna you do?

#ETHUSD Looking bullish and any panic is a buyBINANCE:ETHUSD Etherum after struggling for long time to break its ATH, has currently broked on 22nd Aug and 1:1 ratio suggest its heading towards 5700+ levels. Any panic which can happen can be bought in 3-7-11 swings for the target. Over all we love #ETHUSD

Ethereum Ready to Moon?––Bullish Trade Plan to $5K+
# 🚀 ETHEREUM BULLISH TRADE SETUP 🚀
💎 ETH Long Targeting \$5,090–\$5,800 | Risk-Defined Play 🎯
📊 **TRADE DETAILS**
🎯 Instrument: **ETH**
📈 Direction: **LONG**
💰 Entry Price: **\$4,773.95**
🛑 Stop Loss: **\$4,640.00**
🎯 Take Profit: **\$5,090 → \$5,300 → \$5,800**
📊 Size: **1% Risk**
💪 Confidence: **65%**
⏰ Entry Timing: **Market Open**
⚡ **Rationale:**
✅ Price > Key MAs (20/50/200) → Multi-timeframe bullish structure
✅ RSI/MACD show momentum with room to run
✅ Reward/Risk \~ 2.5:1 toward \$5,090+
⚠️ Risk: Low volume rally + BTC correlation
📌 **Plan:** Scale in near 4,760–4,800 → Target breakout toward \$5,000+
---
\#Ethereum #ETH #Crypto #Altcoins #ETHUSD #CryptoTrading #ETHAnalysis #CryptoSignals #TradingSetup #Breakout

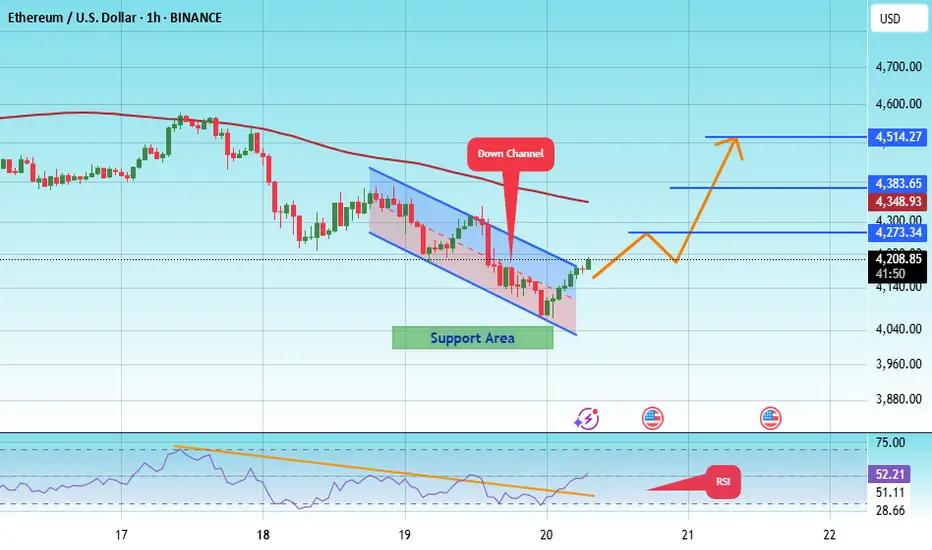
#ETH/USDT Breaks Below Recent Triangle Structure !#ETH
The price is moving within an ascending channel on the 1-hour frame, adhering well to it, and is on track to break it strongly upwards and retest it.
We have support from the lower boundary of the ascending channel, at 4040.
We have a downtrend on the RSI indicator that is about to break and retest, supporting the upside.
There is a major support area in green at 4000, which represents a strong basis for the upside.
Don't forget a simple thing: ease and capital.
When you reach the first target, save some money and then change your stop-loss order to an entry order.
For inquiries, please leave a comment.
We have a trend to hold above the 100 Moving Average.
Entry price: 4203.
First target: 4273.
Second target: 4383.
Third target: 4514.
Don't forget a simple thing: ease and capital.
When you reach the first target, save some money and then change your stop-loss order to an entry order.
For inquiries, please leave a comment.
Thank you.
Retrace HuntingEthUSD currently at the .786 fib level experiencing some resistance. Looking for a bounce done to the .05 Fib then Down ward sells for a retracement completion and eventual continued bull run

ETH Targets If momentum continues and the trend continues for Ethereum, we could see you all times highs for this impulse before a correction in the market. Outlook between the next few days up to a week. Fingers crossed.

demand and supply ETH creating a new ATH
the minor demand zone did not hold, turning it into supply for me, anticipating a pullback to strong demand...
this means that am anticipating price will fall to the the new HL


Medium-term analysis of ETH (Ethereum)1. Key Levels Identified
Strong Resistance Broken (~$4,100–$4,200):
ETH has successfully broken a multi-year resistance level, which historically acted as a ceiling. This breakout is significant, as it shows institutional participation and strong buying interest.
New Support Zone:
The same $4,100–$4,200 zone has now turned into support (classic "resistance becomes support"). Price has already tested it once after breakout.
Medium-Term Target:
The chart highlights a measured move projection toward $6,750 levels, aligning with Fibonacci extensions.
2. Technical Structure
Trend:
ETH is in a strong uptrend with higher highs and higher lows. The breakout confirms continuation after long consolidation.
Retest Behavior:
Current pullback is testing the breakout zone, which is healthy. As long as ETH holds above $4,000, bullish structure remains intact.
Fib Projection:
The chart marks the 0.618–1.0 Fibonacci zone (~$6,000–$6,750) as the expected upside target in this cycle.
3. Risk Considerations
False Breakout Note:
Your annotation mentions “10 out of 8 times it fails!” — highlighting how historically, ETH has had multiple failed breakouts. If ETH closes back below $4,000, it risks a deeper correction toward $3,200–$3,400.
Overextension Risk:
Recent move is vertical. Medium-term investors should expect volatile corrections even if the longer-term trend stays intact.
4. Outlook
Bullish Scenario (High Probability):
ETH holds above $4,000 → moves toward $5,500–$6,000 first, and then toward $6,750 target over the coming months.
Bearish Scenario (Lower Probability but Risk):
ETH breaks below $4,000 support → sharp decline possible toward $3,200–$3,400 before stabilizing.
✅ Conclusion (Medium-Term View):
ETH looks bullish after breaking multi-year resistance, with $6,750 as the expected target. As long as $4,000 holds as support, dips are opportunities for accumulation. Risk management is key since false breakouts are common in crypto.
Disclaimer:
This analysis is for educational and informational purposes only and should not be considered as financial advice. Trading and investing in cryptocurrencies involve significant risk, including the potential loss of capital. Please conduct your own research and consult with a qualified financial advisor before making any trading or investment decisions.
