Bullish bounce off?Ethereum (ETH/USD) has bounced off the pivot, which has been identified as an overlap support, and could rise to the pullback resistance.
Pivot: 2,868.29
1st Support: 2,781.04
1st Resistance: 3,049.57
Disclaimer:
The opinions given above constitute general market commentary and do not constitute the opinion or advice of IC Markets or any form of personal or investment advice.
Any opinions, news, research, analyses, prices, other information, or links to third-party sites contained on this website are provided on an "as-is" basis, are intended to be informative only, and are not advice, a recommendation, research, a record of our trading prices, an offer of, or solicitation for, a transaction in any financial instrument and thus should not be treated as such. The information provided does not involve any specific investment objectives, financial situation, or needs of any specific person who may receive it. Please be aware that past performance is not a reliable indicator of future performance and/or results. Past performance or forward-looking scenarios based upon the reasonable beliefs of the third-party provider are not a guarantee of future performance. Actual results may differ materially from those anticipated in forward-looking or past performance statements. IC Markets makes no representation or warranty and assumes no liability as to the accuracy or completeness of the information provided, nor any loss arising from any investment based on a recommendation, forecast, or any information supplied by any third party.
Trade ideas

ETHUSD – 4H Market Structure UpdateETHUSD – 4H Market Structure Update
Price continues to respect the rising channel, showing a steady trend with clear reaction zones. I’m watching how ETH behaves around the highlighted supply and demand areas — a breakout or rejection from these levels could shape the next move.
I share charts to help traders study clean market structure, key levels, and possible scenarios.
If you find this analysis helpful, feel free to follow for more structured updates and educational breakdowns.
This post is for educational purposes only and does not include any financial advice.

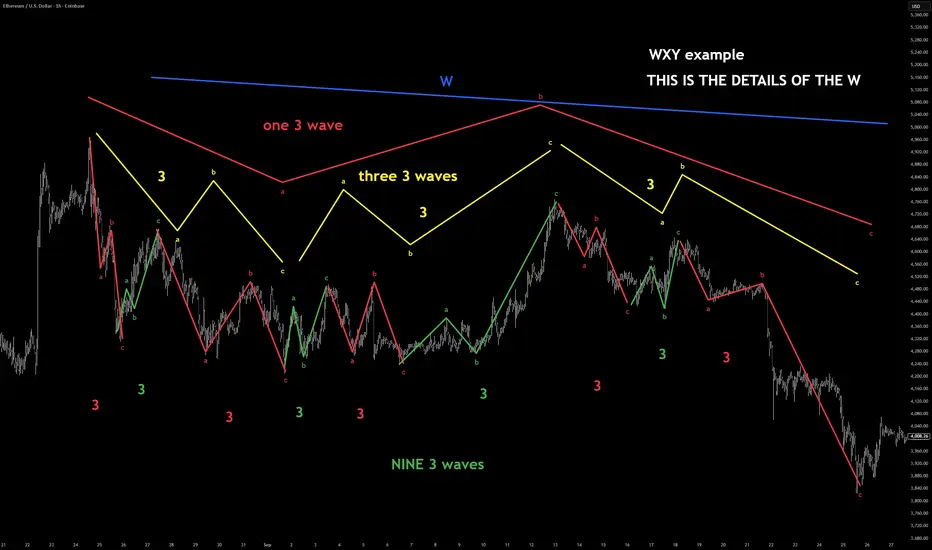
ETH was this correction a WXY- elliot wave tutorial nine 3 waveIts possible this is wave 4 and crypto is going to make a new ATH. theres no way for me to actually know this until after the fact. but it does look like this to me.
wave W is the main chart. to see the other legs see the notes
*** Elliott Wave: Quick Guide to W-X-Y (Double Three) Corrections
A W-X-Y is a complex corrective pattern in Elliott Wave Theory.
If your chart keeps printing choppy overlapping waves that refuse to trend/count cleanly, you’re probably looking at one of these.
- What W-X-Y Actually Is
A W-X-Y is simply:
W = 3 waves
X = 3 waves
Y = 3 waves
So the entire structure is:
*** 3 – 3 – 3 (total of nine internal waves which is 27 on a lower degree)
W and Y are corrective patterns (they can be zigzags or flats), and the X wave is a connecting correction—usually shallow, sideways, and time-wasting.
- What Each Leg Can Be
W:ABC or any corrective 3-wave structure
X: ABC pullback, often sideways
Y: ABC or another corrective structure
None of the legs are impulsive.
If you see a clean 1-2-3-4-5 impulse, it cannot be W, X, or Y.
- How to Recognize a W-X-Y
Corrections subdivide into threes, not fives
Price action is sloppy, overlapping, and often sideways
X wave is typically small relative to W or Y
Y often mirrors W in slope, depth, or duration
The whole thing looks like “two corrections glued together with an X in the middle”
- Where W-X-Y Appears
You’ll see W-X-Y commonly in:
B waves
Wave 4 corrections
The middle section of complex pullbacks
Crypto consolidations (extremely common)
ETHUSD Technical (Bullish Plan) ...ETHUSD Price retraced back into the 2910 zone, which has been acting as a clean reaction point in previous structure. After the pullback, ETH is holding above the range low and showing signs of stabilizing, suggesting that buyers are defending this area. As long as price holds above 2910 on the 4H structure, the upside bias remains intact.
The first major objective sits around 3700, where previous supply and structural resistance align. If momentum continues and ETH clears that level without rejection, the next extension target is 4300, which aligns with the higher-timeframe resistance zone and the next liquidity pocket.
This setup remains valid as long as ETH doesn’t close strongly below the 2910 support, which would invalidate the bullish continuation idea and shift momentum back to the downside

ETHUSD – You have been warnedImagine you are on a high way speeding with a Porche 911 and running kinda low on gas, and you spot a station where you could get gas for free. You would fill 3 tanks right away, right?
That is exactly why market makers love this repeating pattern in a bearish market. Why?! Because its free "gas"...free liquidity.
descending channel → fake breakout → long manipulation → deeper bleed.
---------------------------------------------------
Look at what happened in 2024
Price broke above structure swing high, dragged liquidity, faked strength…
and instantly got rejected back down
That’s not bullish momentum. That’s a liquidity fuel for the market.
Markets do this right before a bigger move down.
---------------------------------------------------
To be honest, ETH chart is full of F U moves all over the place. But, the basic principles kinda remain intact.
In 2024 after the long manipulation, price fully respected the previous swing low.
And that should be the same case now with our swing low.
We are in a bearish trend, don't ego fight the market.
However, if price broke our previous swing low its literally free fall to $800~$1k
---------------------------------------------------
Your chart’s projection is clear:
Sweep the lows, Trap the late shorts, Send ETH flying back to $4k+
But not before the pain.
---------------------------------------------------
Good Luck!

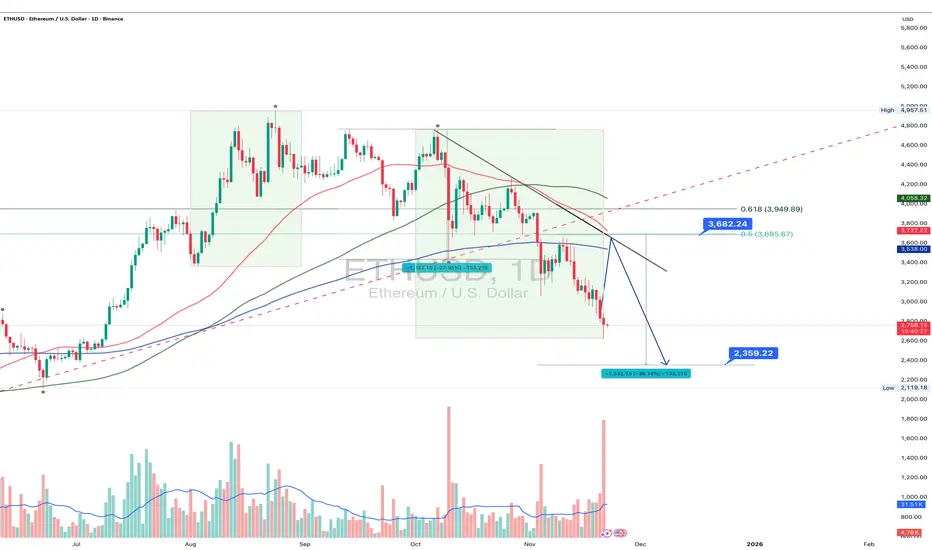
ETH 1D: correction unfolding or just a warm-up?Ethereum continues to trade within a clear bearish structure: after breaking below key daily moving averages, the decline accelerated, pushing the price into the 2720–2800 zone an area that previously acted as a short-term reversal cluster. The trendline from the recent top is broken, and a retest of the 3600–3700 resistance (0.5–0.618 Fib) remains the key scenario before any continuation of the downtrend. Only a confirmed breakout above 3700 would shift the structure back to bullish.
A deeper correction target sits around 2360–2400, where symmetry projections and previous accumulation zones converge.
Fundamental snapshot (Nov 22): network activity is stable, but downward pressure persists due to lower transaction fees and reduced validator revenue. Capital inflows remain weak, and ETH’s dominance continues to erode against L2 networks and alternative L1s. The market is waiting for strong catalysts such as real-world asset tokenization and institutional adoption. In the short term, sentiment leans neutral-to-bearish, supporting the probability of a move toward 2360–2400.
As long as ETH remains below 3600–3700, the bearish scenario holds priority. A breakout above 3700 would flip the structure, but current price action still favors continuation of the correction.
Ethereum is full of surprises - yet price levels tend to be much more disciplined than traders.
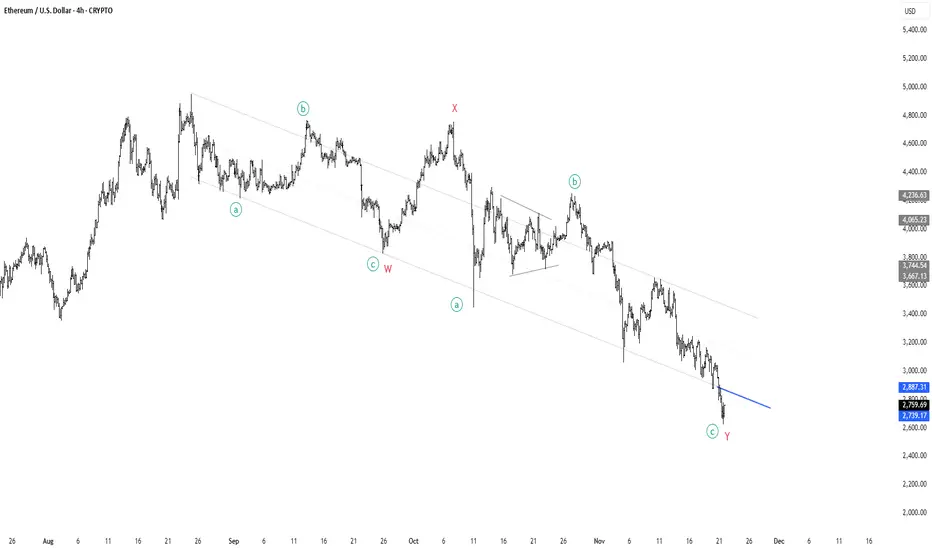
ETH to all time high! Lets go!🚨 ETH Elliott Wave Update 🚨
What we’re looking at here is a clean W-X-Y complex correction unfolding over months — a classic structure when the market wants to correct deeper without breaking the macro trend.
• Wave W completed with an ABC decline
• Wave X gave us the relief rally everyone thought was the bottom ❌
• Wave Y extended lower, subdividing into a-b-c, pulling price into the lower boundary of the corrective channel
Now we’re sitting right at the end of minor wave c of Y, the final leg of this entire structure. The pattern is mature, sellers look exhausted, and the downtrend channel is tightening — perfect conditions for a potential reversal.
🔵 The blue trendline is the key.
If ETH can punch through that level with momentum, it confirms the entire WXY correction is complete and opens the door for a major impulsive leg upward.
💥 Break the blue line → reclaim macro structure →
I believe ETH will begin the march toward new all-time highs.
This is where long-term bottoms historically form:
deep structure, clean proportions, fading downside velocity, and a clear invalidation level.
📈 Eyes on the breakout.
WEEKEND FORECAST - 1ST WEEK OF DECEMBER 2025Interesting overview for this coming. Markets are good.
5 Pairs on TOP WATCH. As well as 2 more Pairs on my WILDCARD.
Do like, follow for more overviews. Have a great month ahead.

BTC ETH SOL Dump Your bags! Collapse Is About To ResumeLast Friday morning I closed all my SHORTs and entered some small LONGs hoping to catch a nice bounce but it wasn't even worth it. There is ZERO strength in this market at the moment.
My small LONG positions are now closed. I am about to go ALL IN AGAIN with SHORT positions.
Buckle up! crypto is about to resume crashing all the way into early December.

ETH - Hourly ChartT.A explained -
BackSide (BS)
FrontSide (FS)
Inverse BS (Inv.BS)
Inverse FS (Inv.FS)
BS & FS levels are expected support when dashed lines, tested when dotted and resistance when solid lines.
The inverse is true for the Inv. BS Inv. FS levels, they are resistance as dashed lines, tested as dotted and support as solid lines.
Monthly timeframe is color pink
weekly grey
daily is red
4hr is orange
1hr is yellow
15min is blue
5min is green if they are shown.
strength favors the higher timeframe.
2x dotted levels are origin levels where trends have or will originate. When trends break, price will target the origin of the trend. its math, when the trend breaks, the vertex breaks too so the higher timeframe level/trend that breaks, the more volatility there could be as strength in the orders flow in to fuel the move.

ETHERIUM is about to break the resistenceetherium as a major crypto ; try to stay behind bitcoin volatility and assume that it's was just a phase of consolidation aiming for new solid price level , follow the trend

Bearish reversal off key resistance?Ethereum (ETH/USD) is rising towards the pivot and could reverse to the 1st support, which has been identified as a pullback support.
Pivot: 3,057.32
1st Support: 2,818.56
1st Resistance: 3,230.74
Disclaimer:
The opinions given above constitute general market commentary and do not constitute the opinion or advice of IC Markets or any form of personal or investment advice.
Any opinions, news, research, analyses, prices, other information, or links to third-party sites contained on this website are provided on an "as-is" basis, are intended to be informative only, and are not advice, a recommendation, research, a record of our trading prices, an offer of, or solicitation for, a transaction in any financial instrument and thus should not be treated as such. The information provided does not involve any specific investment objectives, financial situation, or needs of any specific person who may receive it. Please be aware that past performance is not a reliable indicator of future performance and/or results. Past performance or forward-looking scenarios based upon the reasonable beliefs of the third-party provider are not a guarantee of future performance. Actual results may differ materially from those anticipated in forward-looking or past performance statements. IC Markets makes no representation or warranty and assumes no liability as to the accuracy or completeness of the information provided, nor any loss arising from any investment based on a recommendation, forecast, or any information supplied by any third party.

ETHUSD H4 | Bearish Reversal Off Pullback ResistanceMomentum: Bearish
Price is rising toward the sell entry, which sits slightly above the 50% Fibonacci retracement and remains below the Ichimoku Cloud — maintaining a bearish bias.
Sell Entry: 3,208.29
Pullback resistance
Slightly above the 50% Fibonacci retracement
Stop Loss: 3,402.89
Pullback resistance
Aligning with the 50% Fibonacci retracement
Take Profit: 2,786.67
Pullback support
High Risk Investment Warning
Stratos Markets Limited (tradu.com), Stratos Europe Ltd (tradu.com ):
CFDs are complex instruments and come with a high risk of losing money rapidly due to leverage. 70% of retail investor accounts lose money when trading CFDs with this provider. You should consider whether you understand how CFDs work and whether you can afford to take the high risk of losing your money.
Stratos Global LLC (tradu.com): Losses can exceed deposits.
Please be advised that the information presented on TradingView is provided to Tradu (‘Company’, ‘we’) by a third-party provider (‘TFA Global Pte Ltd’). Please be reminded that you are solely responsible for the trading decisions on your account. Any information and/or content is intended entirely for research, educational and informational purposes only and does not constitute investment or consultation advice or investment strategy. The information is not tailored to the investment needs of any specific person and therefore does not involve a consideration of any of the investment objectives, financial situation or needs of any viewer that may receive it. Past performance is not a reliable indicator of future results. Actual results may differ materially from those anticipated in forward-looking or past performance statements. We assume no liability as to the accuracy or completeness of any of the information and/or content provided herein and the Company cannot be held responsible for any omission, mistake nor for any loss or damage including without limitation to any loss of profit which may arise from reliance on any information supplied by TFA Global Pte Ltd.

ETH downside target hit, bottom soon?Wave 2 is taking the form of a complex WXYXZ correction broadening wedge. Ugly, hard to trade or find any entries. This will cause a lot of stress. This is also potentially a wave 4, but my preferred count is 2 for now.
Wave 2 appears complete with a swing below the boundary at the High Volume Node. Price is below the saily 200EMA. The trend is down, so we should expect more down. Wave X printed a triangle, hinting at this move down being the final move before reversal.
📈 Daily RSI has reached oversold with unconfirmed bullish divergences.
👉 Continued downside has a target of the High Volume Node $2080, where I will be adding.
Safe trading

$ETH – Classic Breakdown → Bounce → Reshort Setup Into 20 SMACRYPTOCAP:ETH – Classic Breakdown → Bounce → Reshort Setup Into 20 SMA Resistance
Ethereum ( CRYPTOCAP:ETH ) is giving one of my all-time favorite continuation short setups — a clean breakdown, followed by a weak bounce right back into the 20 SMA, which is exactly where momentum names often fail.
🔹 The Setup:
• After the big swoosh down, CRYPTOCAP:ETH is now bouncing right into the shaded zone between the 9 EMA and 20 SMA.
• I call this area the Bone Zone — where broken trends come to die.
• CRYPTOCAP:ETH is showing zero character change on the bounce: lighter volume, lower high structure, no real demand.
🔹 Why This Is Textbook:
• Breakdown → weak retrace → touch of the 20 SMA = the exact continuation short I’ve traded for nearly 20 years.
• The 20 SMA often acts as the “kiss of death” in downtrends when momentum has already flipped.
• Crypto across the board is soft — CRYPTOCAP:BTC cracking key levels, CRYPTOCAP:ETH failing to reclaim anything meaningful.
🔹 My Trade Plan:
1️⃣ Entry: Short into the 20 SMA rejection inside the Bone Zone.
2️⃣ Risk: Stop just above the 20 SMA — clean and mechanical.
3️⃣ Target: A retest of the breakdown lows first, then mid to low -$2,000s if momentum continues.
Why I Love This Setup:
• Same breakdown pullback pattern I’ve run for decades — clean, high R/R, predictable.
• Structure is perfect and risk is tight.

Selena | ETHUSD 1H – Bullish Continuation SetupCOINBASE:ETHUSD
The recent rejection from the upper trendline created short-term corrective movement. Liquidity sweeps below minor support hint at accumulation, and as long as price remains above the invalid zone at 2899, bullish momentum is favored. Holding demand could fuel another expansion toward the next resistance block.
Key Scenarios
✅ Bullish Case 🚀
Hold above Demand Zone (≈ 2990–3020) →
→ 🎯 Target 1: 3110
→ 🎯 Target 2: 3180
→ 🎯 Target 3: 3220 (Top Resistance)
❌ Bearish Breakdown 📉
Break below 2899 invalidation zone
→ Potential retracement toward 2755 – strong support zone
→ Deeper demand sits near 2621 if structure fully collapses.
Current Levels to Watch
Resistance 🔴: 3110 | 3180 | 3220
Support 🟢: 3020 | 2899 | 2755
⚠️ Disclaimer: Educational analysis only. Not financial advice.

ETH returned to the demand zone 2500–2700Ethereum (ETH) daily timeframe
ETH returned to the demand zone 2500–2700 where last time the market formed a reversal and produced one of the strongest upswings of the year. Now we see an almost mirror reaction. Liquidity is gathered. A buyer showed up. The market still holds structure above the local low and that is the first healthy signal.
Key level now is 3000–3040. If Ether stays above it and does not fall back under the active sell zone, the chance of trend recovery returns. In that case I look for a potential move to 3320 and after a breakout toward the liquidity area 3550–3720.
Further on the chart there are two heavy zones that will be a real test for the market. First 4000–4250, second deeper 4600–4850. If Ether breaks above them, bears can be temporarily forgotten. For now those are only intermediate stages.
The risk scenario is also clear. Losing 2700 especially on rising volume reopens the path to the 2400–2500 range. Below that is the zone where the global reversal was caught before and where the market can again hunt stops before a strong move.
Summary: Ether stands at a technical point that will decide the next direction. The first signal is here but confirmation is not yet. I’m watching closely without euphoria or guessing. Facts matter, not hopes. If the scenario confirms I’ll take the trend. If price falls apart, I’ll see it immediately.

ETH Quick Update SELLlet this sinkk for the next week it's obvious that crypto market won't crush until grabbing a lot of liquidity so ; at this level sellers are showing strong resistence don't get fooled again

Previous Target Achieved. What now?
Crash & I have a New Setup🤑
The previous target was hit just as expected. It almost did at least. Profits are booked. Now let's look at a new setup. This time, the target would still be the same. Good luck!
#ETH #ETHEREUM #CRYPTOCURRENCY #TRADINGVIEW #TechnicalAnalysis #ToTheMoon
🚀 BINANCE:ETHUSDT to Reach $5K
> ATH Breakout: A sustained move above the $4,891 previous All-Time High is the final hurdle. Clearing this resistance puts ETH into price discovery, making $5,000 the immediate psychological and measured target.
> Deflationary Supply: Net negative ETH issuance (due to fee burning/EIP-1559 and staking rewards) continuously shrinks the circulating supply. This persistent supply shock is a major fundamental driver for upward price pressure.
> Long-Term Pattern: Confirmation of a breakout from a major multi-year structure (like an ascending channel or bull pennant) on high timeframes projects significant measured moves, often validating $5,000 as a logical next step.
And that's it!
#ETH #ETHEREUM #CRYPTOCURRENCY #TRADINGVIEW #TechnicalAnalysis #ToTheMoon

#ETH/USDT (1h) (spot)#ETH
The price is moving in a descending channel on the 1-hour timeframe. It has reached the lower boundary and is heading towards breaking above it, with a retest of the upper boundary expected.
We have a downtrend on the RSI indicator, which has reached near the lower boundary, and an upward rebound is expected.
There is a key support zone in green at the 2960 price level. The price has bounced from this zone multiple times and is expected to bounce again.
We have a trend towards stability above the 100-period moving average, as we are moving close to it, which supports the upward move.
Entry price: 3000
First target: 3033
Second target: 3080
Third target: 3140
Don't forget a simple principle: money management.
Place your stop-loss below the support zone in green.
For any questions, please leave a comment.
Thank you.

ETH Daily Outlook | November 29, 2025Still looking really clean on the 1-hour. Higher lows are holding firm, no bearish break of structure at all. We’re just in a shallow corrective pullback right now, price sitting right on the 5 EMA while the 10 and 50 are stacked perfectly below and still pointing up.Volume’s basically gone to sleep on the dip and funding is quiet, classic sign the move isn’t over. As long as we stay above the last higher low and that 50 EMA zone, this is nothing more than a healthy pause in the markup.A quick bounce off the 5/10 area and we flip straight back into impulse mode for the next leg up.My bias stays aggressively bullish as long as the EMA stack and structure stay intact. Any touch of the 50 EMA is a buy for me.

ETH Technical Analysis: Relief Bounce, But the Downtrend RemainsETH Technical Analysis: Relief Bounce, But the Downtrend Remains Intact
1. ETHUSD has been forming lower swings continuously, reinforcing a dominant downtrend. Supported by a sign of bearish EMA stack to the 100 EMA, signalling a broader corrective phase with strong bearish momentum.
2. There are still no bullish reversal signals yet, suggesting that any rebound is likely to be a short-term relief rally, forming a lower high before the downtrend resumes.
3. Initial resistance is seen near 3,275, where former support and the EMA20 may act as a supply zone before another leg lower.
4. If ETHUSD breaks below support at 2,730, it could unlock further downside toward the next key support around 2,100.
Analysis by: Krisada Yoonaisil, Financial Markets Strategist at Exness

Continuing the ChallengeForgive me but I have been in hospital with a wide variety of health problems to do with my gut which is still on going and took a break from trading. I am regularly getting IBS attacks and it is getting worse. Sometimes you have to realise when you are not in a condition to trade and take a break. A good acronym is HALT standing for Hungry, Angry, Lonely, Tired. If you are any of these, don't trade.
As for the idea, currently looking at an ETH long on the 4h timeframe. Seems to have pulled back to a key support and showing on the lower end of the SD band from the VWAP suggesting a perfect reversal point. I have used ATR bands to judge volatility and set SL just outside the band along with TP at 2x reward to risk.
Looking forward to continuing the challenge on a slightly longer timeframe due to my health problems.
