ETHUSD | BullishETHUSD is in bullish trend and is not respecting the divergence.It is in bullish continution pattern and printing higher highs and higher lows.
ETHUSD.PI trade ideas

ETHUSD | BullishEtherium is not respecting the divergence and is continuting the continution pattern while printing higher highs and higher lows.

$ETH Surprised $4.7k and ATH breakout going to $5K✨ CRYPTOCAP:ETH Surprised $4.11K breakout going to Rocket $5K 🚀
Price will hit $5K on this month confirmed. previous post was price $4K see now. Who is Open long trade price at $4K ? just Hold it for $5K level.
🚦Vitalik Buterin Reclaims 'Onchain Billionaire' Status as CRYPTOCAP:ETH Surges Past $4,433
CRYPTOCAP:ETH co-founder Vitalik Buterin has once again joined the ranks of crypto's 10-figure holders, with his portfolio now valued at approximately $1.04 billion.
This milestone comes just days after ETH surpassed the $4,000 mark for the first time in eight months. Alongside Buterin, other prominent billionaires shaping the crypto and tech landscape include: Fred Ehrsam Co-founder of Coinbase and Paradigm, with an estimated net worth of $2.93 billion.
Volodymyr Nosov Founder and President of WhiteBIT Group, with wealth estimated between $6-$7 billion.
The Winklevoss Twins - Founders of Gemini exchange, each with an estimated personal net Worth of $2.7 billion. For more on notable figures like Larry Ellison, Bill Gates, and Mark Zuckerberg.
#Write2Earn #ETHETFsApproved #BinanceAlphaAlert #ETH4500Next? #SUBROOFFICIAL
Disclaimer: This article is for informational purposes only and does not constitute financial advice. Always conduct your own research before making any investment decisions. Digital asset prices are subject to high market risk and price volatility. The value of your investment may go down or up, and you may not get back the amount invested. You are solely responsible for your investment decisions and Binance is not available for any losses you may incur. Past performance is not a reliable predictor of future performance. You should only invest in products you are familiar with and where you understand the risks. You should carefully consider your investment experience, financial situation, investment objectives and risk tolerance and consult an independent financial adviser prior to making any investment.


Shorting Ethereum using 15min TFConfirmation for Ethereum Short on 15min TF. This is my first publish to share my analysis of the Ethereum price action on 15min TF and how i use confluence confirmation to nail the short
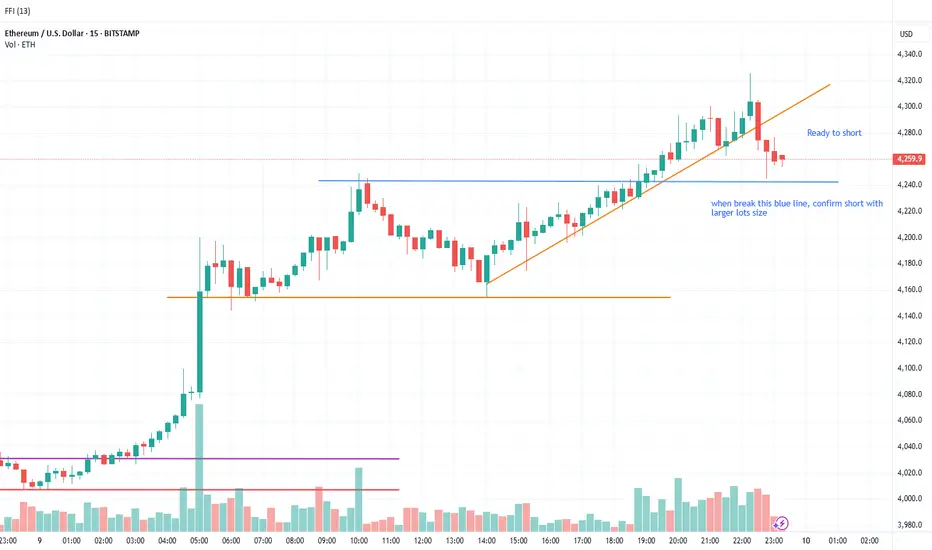
ETH PERPETUAL TRADE ,Short from $4700ETH PERPETUAL TRADE
SELL SETUP
Short from $4700
Currently $4690
Stoploss $5050
Targeting $4620 or Down
(Trading plan ETH go up to $4760
will add more shorts)
Follow the notes for updates
In the event of an early exit,
this analysis will be updated.
Its not a Financial advice


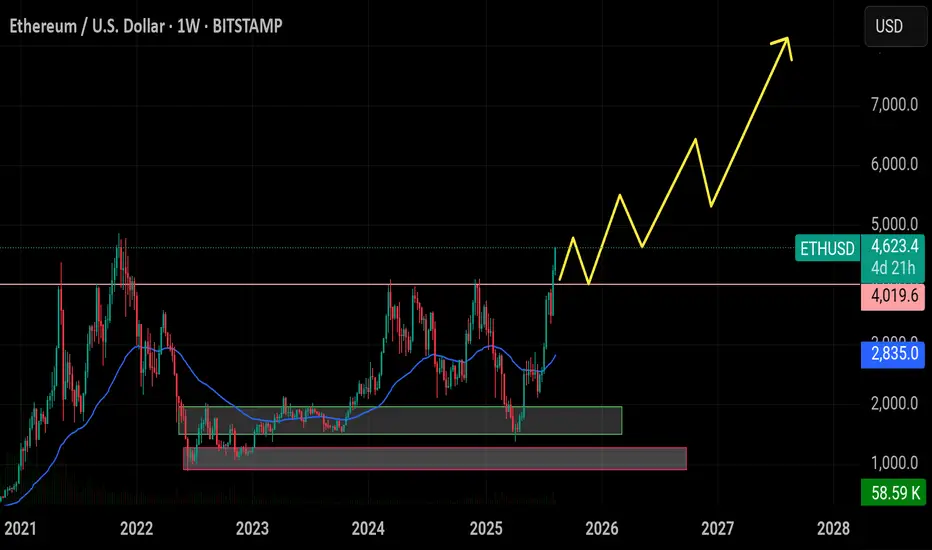
Bitcoin vs Ethereum | 15-20k$ ETH? same chart, same psychology .
- after bullrun price dropped ~80%, we have a bottom
- recovery to resistance level
- retesting the bottom cycle with breaking news
The chart shows the same price psychology.

ETH/USD can be predicted by ETH/BTCYou can anticipate the peak of ETH/USD trends based on ETH/BTC.
Simple and Effective!

ETHUSD : Blow-offIn accordance with the harmonic pattern, the price is at the tip of the blow-off stage now.
By the pattern, it is UNLIKELY to surpass the previous ATH.
Wait for a reaction on a 1W chart, trade once the price weakens.
GOOD LUCK.

ETH BREAKOUTEthereum’s breakout run just hit my trailing stop — locked in profits and letting the market catch its breath.


eth in Overboughti see eth rsi in Overbought i think mabe its a little come down maybe 4400 in support level!!

ETHUSD on track to challenge ATHs!The ETH/USD pair has experienced solid gains over the past few days, breaking through several resistance levels and adding 14.0% so far this week!
Having noted that price took out the 1M resistance at US$4,299 and US$4,564, there is very little technical ceiling in this market right now, and the next upside hurdle can be found at all-time highs of US$4,863. Given that today’s price action retested US$4,564, potentially forming support, this could provide enough technical fuel for buyers to pyramid their positions and target US$4,863.
Written by the FP Markets Research Team

ETHUSD big bada bing is going to the endI was expecting ending diagonal in my latest post, but that never worked out. It's clear impulse wave, and unfortunately it's last in the current bigger wave. There are some rules applying which we can highlight the target zone of the last impulse, it's on the chart. I believe there will be strong resistance at +-5k. It's not the end for ETH though, there must be some flat or triangle much longer in time after which the ascending move will continue. Good luck!

Etherium (ETHUSD) Composite AnalysisTechnical Summary: The primary trend of Etherium is bullish. On the 4H chart, the prices boosted after taking support of Fib extension 0.0 (4157) since Monday. During the Asian session today, the prices tested record highs of 4682. However, the crypto has accepted the resistance at Fib extension 0.618 (4651), creating an immediate narrow zone between 4651 & 4565. Mild corrections are possible till the immediate support, but the overall bias remains bullish, far resistance at 4800 (very close to the all-time high made during Nov 2021).
Descriptive Analysis: Ether exchange-traded funds (ETFs) experienced a record-breaking $1.02 billion inflow in a single day. This marks the largest single-day entry ever for Ether ETFs. Bitcoin ETFs also showed strong performance with $178 million in net inflows. Both markets reported zero outflows and vigorous trading activity. Blackrock played a significant role in the $1 billion Ether ETF surge, while Bitcoin ETFs continued their upward trend.
Data-related Projection: With no major data releases today, traders are looking ahead to tomorrow’s U.S. PPI report for fresh cues. Etherium will move on its own fundamentals as market sentiment remains cautious but supported by expectations of a softer dollar.
Indicator Interpretation: Mild corrections are possible as the indicators are trending in the overbought zone, but the overall bias remains bullish.
ALTERNATIVE SCENARIO
Technical Confirmation: If Etherium remains able to breach the immediate support level of 4565, and sustains lower, then prices might correct further till the middle Bollinger band near 4400-4330.
Facts & Figures: There are over 122 million Ethereum tokens in circulation – over 10 times more than Bitcoin. The coin was created in 2013 and launched in 2015 in Switzerland by eight people
Daily Pivot: 4435 (CMP is 4613 & prices are trading above the pivot level while writing the report).

$ETH has broken above the $4,000 resistance, CRYPTOCAP:ETH has broken above the $4,000 resistance, with short-term targets at $4,800–$5,000, and a potential retest zone around $4,050 for continuation.
Bullish pennant forming on 1hr?ETH/USD appears to be forming a bullish pennant on the 1H chart following a strong impulsive run from $4,290.64 to $4,518.60. The consolidation is converging toward the apex with declining volume, consistent with continuation pattern behavior.
Breakout Projection :
Pole height : $227.96
Estimated breakout point : ~$4,622
Target : ~$4,842
Invalidation : Breakdown below the lower pennant trendline with strong volume before breakout would invalidate the bullish pennant thesis.
This is not financial advice. It is merely an observation of an optimistic apparent pattern formation. Always do your own research and assess your own risk tolerance before making any trades.

Proof of Strength: ETHERIUM UPDATED**Proof of Strength: An UPDATED Analysis of Ethereum's and its Year-End Trajectory**
This is an important update to our August 9th analysis. New market data has emerged that confirms a significant acceleration in Ethereum's market leadership, forcing us to revise our outlook to be even more bullish.
Since our last report, Ethereum has not only sustained its breakout but has seen its market dominance surge to a staggering **13.85%**, a multi-year high we haven't seen since late 2021. This is a game-changing development. It confirms that a major capital rotation into Ethereum is underway. The price has powerfully cleared **$4,500**, and with this new dominance data, our conviction in a continued, aggressive uptrend has increased. While the market is clearly overbought, we are raising our year-end targets, with the **$6,800** aggressive case now becoming a high-probability scenario.
The past week has been spectacular, confirming the parabolic nature of the current advance. Ethereum has surged from $3,826 to a high of **$4,593**, a gain of over 20% in just seven days. This move validates our Elliott Wave 3 thesis and suggests the market is in its most powerful impulse phase. The psychological **$4,500** level was breached with conviction on the highest daily volume we've seen since March, and this level now becomes a critical support floor. The previous resistance zone around **$4,200 - $4,300** has also been firmly established as the primary support zone, with intraday pullbacks being aggressively bought up.
From an indicator perspective, the daily RSI is in extreme overbought territory at **77.8**, with the weekly RSI now firmly overbought at **72.7**. Normally this would be a major warning, but in the context of the dominance surge to **13.85%**, it signals immense strength. This isn't just a price rise; it's a structural breakout in market leadership. Ethereum is actively draining capital from Bitcoin and other altcoins, a classic sign of a true "ETH season."
For traders, the breakout strategy has paid off handsomely. Now, risk management is key. For those with existing positions, taking some partial profits (20-30%) here is prudent. Stop-losses should be moved up to just below the **$4,200** support level to lock in gains. For anyone looking to enter, chasing the price at these levels is extremely high-risk. The better strategy is to wait for a pullback. A retest of the **$4,200 - $4,300** support zone would present a prime opportunity.
Looking at the remainder of the year, the breakout in ETH Dominance forces us to revise our price targets upward. The powerful Wave 3 impulse is undeniable. Based on the new data, our **NEW Primary Target** is the 1.618 Fibonacci extension, which points to **~$5,600**. This is now our base-case scenario, likely to be reached by October or November. Our **NEW Aggressive Bull Case** is the 2.618 extension, targeting **~$6,800**. The dominance surge significantly increases the probability of this "blue-sky" scenario.
Our primary scenario, which we now give an **80% probability**, is a bullish continuation. After a brief consolidation or shallow pullback to the **$4,200-$4,300** range, we expect Ethereum to resume its powerful uptrend toward the **$5,600** target. The strategy is unequivocally to buy the dips. A secondary scenario (**15% probability**) is an extended consolidation between $4,200-$4,800, which would be healthy for the market. A deep correction to the $3,800 breakout point is now a low-probability tail risk (**5%**), but would represent a generational buying opportunity if it occurred.
In conclusion, the surge to **13.85%** dominance is a paradigm shift. It confirms Ethereum is the clear leader of this market cycle and that a significant re-pricing event is underway. Our analysis is more bullish than ever. We are raising our primary target to **$5,600** and see the aggressive **$6,800** target as highly probable. Any dip towards the **$4,200-$4,300 support zone** should be considered a significant buying opportunity.

Can ETH Reach $8,500 Amidst Bullish Catalysts and Threats?A confluence of unprecedented institutional buying, feverish derivatives activity, and bullish technical patterns has ignited the Ethereum market, propelling its price to multi-year highs and sparking bold predictions of a surge to $8,500 and beyond. This rally, however, is not without its skeptics, who point to signs of overheating, increasing profit-taking, and the ever-present shadow of a market cycle peak.
The world's second-largest cryptocurrency has been on a tear, with its price climbing significantly in a single month and nearing its all-time high. This powerful upswing has shifted the crypto world's focus away from a rangebound Bitcoin, raising questions about the mechanics of this bull run, its sustainability, and the myriad of forces pulling the price in opposite directions.
The Bull Case: A Perfect Storm of Institutional FOMO and Technical Breakouts
At the heart of the current rally is a tidal wave of institutional capital, a force that has fundamentally reshaped the market landscape. The recent launch of spot Ethereum Exchange-Traded Funds (ETFs) has been a resounding success, with reports indicating substantial net inflows on single trading days. This influx of "big money" provides a stark contrast to previous retail-driven rallies, suggesting a more stable, long-term buying pressure.
Leading this charge is one major institutional player, a technology firm chaired by a prominent Wall Street strategist. In a move that has drawn comparisons to aggressive corporate Bitcoin accumulation strategies, the firm has announced plans to expand its equity offering to a colossal sum, with the proceeds earmarked for further Ethereum purchases. The firm, already one of the largest corporate holders of Ethereum, is aiming to control a remarkable percentage of the total ETH supply. This monumental buying pressure from a single entity is a powerful bullish signal, fueling what some analysts have described as a price action that is "defying gravity."
The institutional appetite extends beyond this single entity. The total amount of Ether held by companies with crypto treasuries has surged. Simultaneously, Ethereum held on exchanges has dropped to a multi-year low, a bullish indicator that suggests investors are moving their assets into long-term storage with no immediate intention to sell.
This institutional fervor is underpinned by a compelling technical picture. Analysts have identified a rare but powerful chart pattern on Ethereum's daily chart that has been developing for months. This setup is characterized by a horizontal resistance level and a downward-sloping support line, indicating increasingly aggressive buying on each dip. A decisive breakout above this resistance, according to technical analysis principles, could initially target higher price levels, with stronger momentum potentially extending the rally significantly. Other optimistic projections see Ethereum potentially reaching even higher valuations, with some analyses pointing to a fractal pattern that mirrors Bitcoin's previous bull runs.
The Derivatives Dilemma: Record Highs and Muted Enthusiasm
The derivatives market paints a more complex and, in some ways, contradictory picture. Ether futures open interest has soared to an all-time high, with the monthly trading volume on institutional-grade exchanges hitting record levels. This surge in activity, particularly from platforms favored by institutional investors, undeniably signals heightened interest and preparation for volatility.
However, a closer look at the data reveals some nuances. The record open interest, when denominated in US dollars, is largely a function of the rising price of ETH itself, rather than a massive influx of new leveraged positions. In fact, open interest measured in ETH terms remains below its previous peak.
Furthermore, derivatives data suggests a surprisingly subdued appetite for leveraged bullish bets. The annualized premium for ETH perpetual futures has been hovering around a neutral level, below what would typically indicate strong demand for leveraged longs. This could be interpreted in two ways: either the rally is being driven more by spot buying and has a more solid foundation, or there is a lack of conviction among speculative traders about the sustainability of the current price levels.
The Bearish Counterpoint: Profit-Taking, Historical Cycles, and Competitive Threats
As Ethereum's price tiptoes near its previous highs, signs of profit-taking are beginning to emerge. On-chain analytics show that short-term holders, in particular, are ramping up their selling to realize gains. While long-term holders remain relatively steadfast, daily profit realization has climbed. With a vast majority of all Ether addresses now in a state of profit, the temptation to sell could create significant headwinds, potentially slowing the ascent.
Adding to the cautionary tone is analysis from some market experts who have advised investors to consider selling their Ethereum holdings by the autumn. Citing the psychology of market cycles, one analysis suggests that the current "Optimism" phase is likely to transition into a "Market Peak/Euphoria" phase, which is historically followed by a swift and brutal correction. This perspective predicts that Bitcoin could show signs of topping out first, with Ethereum following suit, potentially leading to a significant price collapse for ETH. The short-term target in this scenario lies in a range substantially higher than current prices, but would precede this potential downturn.
Beyond immediate market sentiment, Ethereum faces long-term strategic challenges. Its dominance in the decentralized finance (DeFi) space is being contested by a growing number of independent layer-1 blockchains that offer faster transactions and lower fees. Major corporations and traditional finance entities are increasingly favoring these proprietary chains for their own blockchain projects, seeking greater control and customization. This trend is reflected in on-chain metrics, with Ethereum's total value locked (TVL) showing a decline and its weekly base layer fees lagging behind some competitors.
Ethereum vs. Bitcoin: The Flippening Narrative Resurfaces
For much of the recent crypto market action, Bitcoin has been in a state of consolidation. This has allowed Ethereum to take the spotlight, with ETH significantly outperforming BTC in recent weeks. This divergence has reignited discussions of "The Flippening," the hypothetical moment when Ethereum's market capitalization surpasses Bitcoin's.
The bull case for Ethereum's outperformance hinges on its utility as a programmable platform for DeFi, NFTs, and a host of other decentralized applications. This contrasts with Bitcoin's primary role as a store of value. The massive institutional inflows into Ethereum, both through direct purchases and ETFs, are seen as a validation of its long-term potential beyond a simple inflation hedge.
However, some Bitcoin proponents argue that the current ETH/BTC rally is an engineered market event. They allege that influential players are rotating their Bitcoin holdings into Ethereum to inflate its price based on the corporate treasury narrative, only to later sell their ETH and convert the profits back into Bitcoin.
Conclusion: A High-Stakes Balancing Act
Ethereum stands at a pivotal juncture. The powerful narrative of institutional adoption, exemplified by audacious corporate accumulation strategies, combined with bullish technical indicators, provides a credible path towards ambitious price targets. The influx of capital through ETFs and the growing recognition of Ethereum's role as the backbone of Web3 are formidable tailwinds.
However, the journey is fraught with peril. The specter of a cyclical market top, as articulated by some analysts, cannot be ignored. The increasing profit-taking by short-term holders, the ambivalent signals from the derivatives market, and the persistent competition from other layer-1 blockchains are all significant hurdles that could stall the rally.
Whether Ethereum will surge to new all-time highs and beyond or succumb to the pressures of an overheated market remains to be seen. The coming weeks will be crucial in determining if the current bull run has the legs to defy historical patterns and establish a new paradigm for the world's leading smart contract platform. For now, the market remains in a delicate, high-stakes balancing act, with the potential for both explosive gains and sharp, unforgiving corrections.

ETHUSD – Supply Zone Rejection & Possible PullbackEthereum (ETHUSD) has reacted to a supply zone between $4,300 – $4,340, showing early signs of bearish pressure after a strong rally.
🔹 Key Levels:
Supply Zone (Resistance): $4,300 – $4,340
First Support: $4,177
Demand Zone: $4,072 – $4,005
🔹 Analysis:
Price is struggling to break through the supply zone, and sellers appear to be defending the area. If rejection holds, we could see a retracement toward $4,177. A confirmed break below $4,177 could open the way to the demand zone around $4,072 – $4,005.
🔹 Bearish Scenario:
Entry: On confirmed rejection from supply zone
Targets: $4,177 → $4,072
Stop loss above $4,345
🔹 Bullish Scenario:
If price breaks and sustains above $4,345, buyers could push for higher highs beyond $4,400.
📍 Bias: Short-term bearish unless a clean breakout above $4,345 occurs.

Ethereum (ETH/USD) – Elliott Wave AnalysisThe current price structure suggests that Ethereum is completing the final stages of a 5-wave impulsive advance, with the market now positioned in wave 5 of 5. Price action has reached the upper boundary of the ascending channel, coinciding with a key Fibonacci projection zone (green resistance area), which aligns with typical wave 5 termination points.
Given this confluence, the probability of a medium-to-long-term top forming here is elevated. Once wave 5 completes, a corrective phase is expected, potentially retracing towards the midline or lower boundary of the channel. The projected path (blue arrows) anticipates a significant decline, consistent with the completion of a full impulsive cycle.
Key Points:
• Structure: Impulse wave (5 of 5) nearing completion
• Confluence: Channel resistance + Fibonacci projection zone
• Outlook: High probability of reversal and corrective decline
• Targets: First support near $3,650, with deeper retracements possible toward $3,000–$2,800 if bearish momentum accelerates
This suggests caution for late long entries, as risk/reward now favors a corrective move.

Ethereum Wave Analysis – 12 August 2025- Ethereum rising inside impulse wave (3)
- Likely to rise to resistance level 5000.00
Ethereum continues to rise inside the sharp upward impulse wave (3), which previously broke the resistance zone between the resistance level 4400.00 and the resistance trendline of the daily up channel from June.
The breakout of this resistance zone strengthened the bullish pressure on Ethereum – accelerating the active impulse wave (3).
Ethereum can be expected to rise further to the next round resistance level 5000.00, target price for the completion of the active impulse wave (3).
