Eth now changing directions?New to trading so please dont hesitate to critique:
IMO: Trends will collapse (short term) in a bullish way, since there is a clear uptrend (also confirmed in 1h timeframe.
Volume is still ok to hold trend.
Fib look ok.
ETHUSD.PI trade ideas

ETHUSD TRADE RESULT: BREAKEVEN Here, I overlooked the timing and market structure presented inside the highlighted circle and ended up breaking even shortly after putting SL in profit.

S&P 500 on the Edge – Crypto Awaits the Signal📉📊 S&P 500 on the Edge – Crypto Awaits the Signal 🧠⚠️
Hey Traders! Quick note before we dive in — apologies for the audio quality in this update 🎙️. I had the wrong mic set up (classic move!), but the charts are what matter, and we’ve got some serious levels to respect.
🔙 Back from the Holidays – Still All In
Mid-August is a special time here in Cyprus and Greece, and I took a well-deserved breather with family and friends. But rest assured, I haven’t been idle — behind the scenes, I’ve been working intensely on indicators to elevate my TradingView game — and why not yours too, eventually? 😉
(Just to be clear: no advertising, no selling — just sharing my process and market views, as always.)
📌 The Big Picture – S&P 500
We’re back at that critical level: 6432 .
✅ Above = market stays optimistic
❌ Below = correction risk increases, likely toward 6223
Right now, the odds lean 41% upside / 59% downside , and considering we’re at all-time highs, caution is wise. Buying ATHs is never the best strategy unless confirmed by momentum.
🪙 Bitcoin – Caught Between Key Levels
BTC is sandwiched between two key zones:
🔺 Reclaiming 116,525 = bullish signal
🔻 Losing 115,000 = exposes downside to 110,000
This is a true 50/50 — stuck below a broken ascending channel and flirting with a violated S/R level. Stay reactive, not predictive.
💪 Ethereum – The Strongest Major
Ethereum continues to outperform. Today we didn’t catch the day-trade long, but the 4,210 level is major support.
ETH market dominance is rising steadily — the charts reflect it.
🧩 Altcoin Insights
- ARB : Reclaim 0.54 for possible move to 0.76
- XRP : Key support at 2.93 . Break higher? We could see 3.33+
- ADA : Watching 0.87 support. Below that? Caution.
Market-wide, TOTAL and altcoins are still sluggish. Until momentum returns, tactical plays > emotional ones.
🧠 Summary:
- 📍 S&P 500 is the key signal.
- 📉 BTC & ETH stuck, waiting on that SPX cue.
- 📊 ETH leads the pack — but patience is key.
- ⚖️ Altcoins are mixed, respect your levels.
This market is full of potential — but clarity comes from levels, not guessing. Let’s trade smart. 🔍
One Love,
The FXPROFESSOR 💙
Disclosure: I am happy to be part of the Trade Nation's Influencer program and receive a monthly fee for using their TradingView charts in my analysis. Awesome broker, where the trader really comes first! 🌟🤝📈

ETHUSD - CURRENT OUTLOOK ON ETHEREUMI am currently expecting the dollar to slowly regain strength, and while this is happen, I expect institutions/large funds to begin profit taking from these price ranges.
"May fortune attend thee, and thy trade prosper." .......L2Earned

ETH BUY SETUP ,Bought From $4265ETH BUY SETUP
Currently $4265
Bought From $4265
Stop loss $3900
(Trading plan If ETH go down ,
to $4180 will add more longs)
Expecting target $4344 OR ABOVE
In the event of an early exit,
this analysis will be updated.
Its not a Financial advice

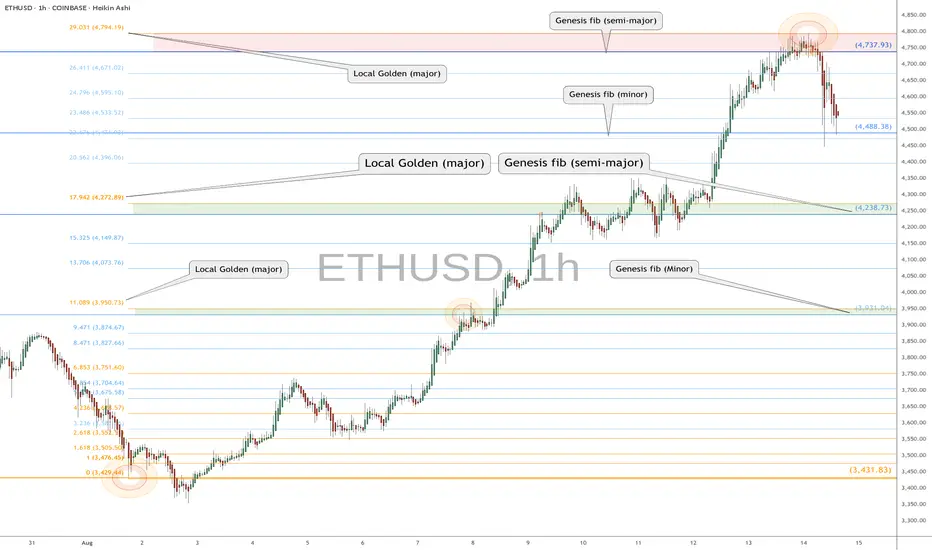
ETH retrace RoadMap: coming back from our Semi-Major Genesis fibETH hit our Semi-Major Genesis fib and dropped.
Plotted here are the important levels to watch.
Small chance Dip is Done, likely it goes deeper.
$ 4488.38 is a minor Genesis that might hold.
$ 4238.73 - 4272.89 will be stronger support.
$ 3931.04 -3950.74 is a Must-Hold for bulls.
.
Last post that called this top EXACTLY:
Hit BOOST and FOLLOW for more such PRECISE and TIMELY charts.
========================================================
.
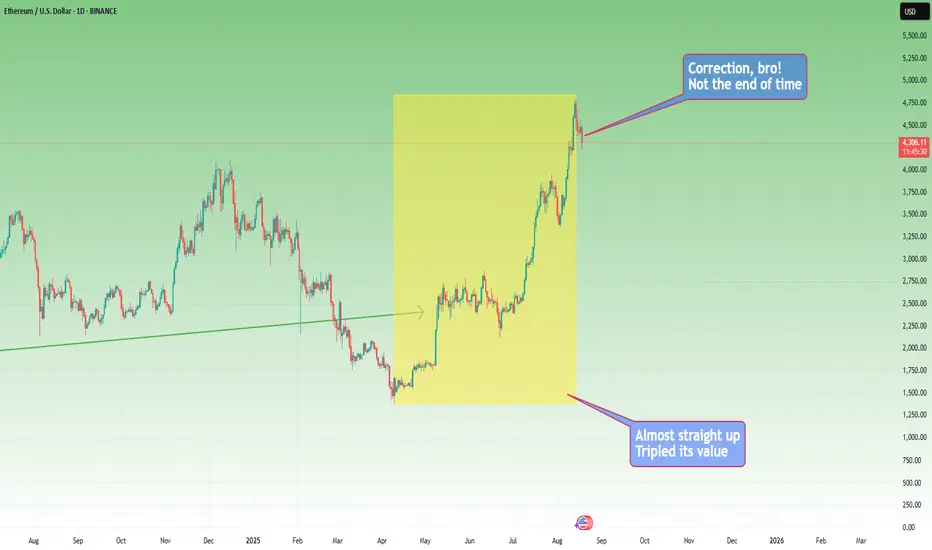
Investing vs. Speculating in Crypto: Stop Mixing the TwoThe crypto market is in a correction, and every time this happens, I see the same pattern repeat: traders and investors talking about the moon — expecting 10x or 100x — but the moment their coin drops by 10%, they panic. They ask “What’s wrong?” or panic that the project is failing.
This is a misunderstanding of what it means to invest versus what it means to speculate. Let’s clear that up.
🚀 The Investor’s Perspective
If you believe Bitcoin is going to 500,000 USD, do you really care if it dips under 100k before reversing?
If you bought Solana with the vision of 1,000 USD, why should a retest of 150 USD make you nervous?
Investors understand:
Markets never move in a straight line.
Patience is essential — big returns require time.
Short-term corrections don’t change a solid long-term thesis.
If you’re aiming for 5x or 10x, you must accept that it takes months or years, not days.
⚡ The Speculator’s Perspective
Speculators play a different game:
They focus on short-term setups.
They use technical analysis and momentum.
They might even short-sell when the conditions align.
Both are fine — but the problem begins when people think they’re “investors” while acting like speculators every time the market moves against them.
🎯 Targets, Plans, and Patience
Here’s what most forget:
The market isn’t a straight line up designed for your convenience or for your dream Lambo
You need to set a clear target and be patient.
Want 5x on BTC? Or 10x on a strong altcoin? Then you’ll have to wait for it.
If you expect daily gains and can’t handle normal corrections, you’re not investing — you’re speculating without realizing it.
🤡 The Quick 10x Illusion
Yes, you can chase 10x in a day or two with meme coins on DEXes. Sometimes it works, most times it ends with rugs or sudden collapses. That’s not investing. That’s just gambling, and you can’t complain when it goes wrong.
✅ Final Thoughts
Decide who you are:
As an investor, set your targets, trust your thesis, and don’t panic on corrections.
As a speculator, play the short-term moves but accept the inherent risks and use discipline.
Crypto can deliver very big returns — but only if you stop mixing long-term conviction with short-term panic.
Patience and discipline will always beat hype. 🚀
P.S.
Let’s take a concrete example: since April, ETH tripled in value in a nearly straight line. What do you expect — for it to keep rising like that to 25k by the end of the year?
Do you look at your portfolio daily expecting more money every single day?
Think also of those who bought ETH with 10 million dollars, not just 3 ETH for 5k.
Maybe they want to mark profits.
Maybe they need a new yacht:)
Their selling affects the market too — and corrections are part of the bull runs.
ETH Momentum Indicators Point to Seller ControlEthereum (ETH) has recorded a negative crossover on its Moving Average Convergence Divergence (MACD) indicator during today’s session. At the time of writing, the MACD line (blue) has slipped below the signal line (orange), signaling renewed seller dominance.
The MACD is a key tool for spotting trends and momentum shifts. A crossover of the MACD line below the signal line is often viewed as a bearish signal, showing that downward momentum is strengthening and sellers are taking control.
With ETH’s recent bearish crossover, the risk of extended selling pressure has increased. If momentum continues in this direction, ETH could face a decline toward the next key support zone around the $4,000 level.

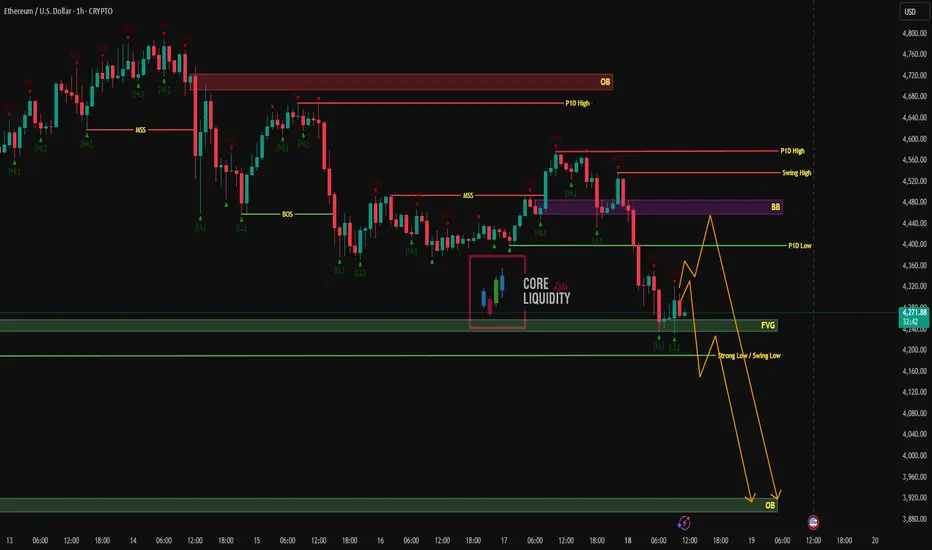
ETH 1H Setup |Liquidity & OB Trap Zone — for scalp click linkMarket has shown multiple structure shifts (MSS) and break of structure (BOS), confirming bearish pressure. After sweeping liquidity at highs, price tapped into premium OB (Order Block) and rejected strongly.
Currently price is holding around 4270 zone inside a corrective range. Expectation:
Possible retracement toward 4360–4450 zone (previous P1D low & breaker block area).
From there, rejection into downside continuation targeting FVG + liquidity below 4200.
Final objective = OB demand zone around 3900–4000.
Key Levels:
OB Supply: 4560–4620
Breaker Block (BB): 4420–4480
Fair Value Gap (FVG): 4180–4220
Strong Low / Swing Low: 4140
OB Demand: 3880–3980
🚨 Market never moves random… the next move might surprise you 👀
Possible ETH/USDT Elliot WaveNow we are at the 4th wave inside the extended 3rd wave. We might see in the short run that ETH/USDT will achieve its new ATH around $5,000, and in the long run, it may reach around $8,000-$10,000 with the great correction at its 4th wave.

Plan Buy ETHI am also waiting and setting a signal to buy ETH when the price has broken through the supply zone, the plan is to wait to buy below with 2 stop loss levels to balance the volume to suit my assets.

$ETH Topping Without All Time High?Has the most anticipated all time high of the year been cancelled? The crowd does not get what it wants! Everyone from CNBC to my grandmas goldfish have been bullish on ETH for the past few months so what a fitting psychological mess it would be if we significantly pulled back here!
Firstly it may just be a temporary set back to the High Volume Node support at $3900 before a move to all time high. Even then I am expecting a deeper pullback to set us up for all time high in Q4. Losing this support bring up the ascending daily 200EMA right at the Fibonacci golden pocket, which you can see is the wave 3 high!
The next target, which is my next buy level, is the larger degree Fibonacci golden pocket, major support High Volume Node and wave 4 bottom at $2100. This would be a capitulation area for many!
RSI has printed confirmed bearish divergence with plenty of room to fall.
Safe trading

The last drop before the rush - ETH weekly update Aug 18 - 24thEthereum is currently in a corrective phase, forming Intermediate Wave 4. On the higher degree, this move takes place within Primary Wave 5 and Cycle Wave 3. At the Minor degree, it becomes clear that this Wave 4 correction is taking shape as a more complex structure, which is consistent with the broader correlation across altcoins. First, a ZigZag pattern unfolded as Wave W, followed by a Flat structure as Wave Y. For Wave Z, either another Flat or a Triangle is expected. The alternative scenario suggests that Wave Y’s Flat has not yet fully completed and may extend lower. While the subsequent Wave X would likely reach a similar target due to fundamental market mechanics, the following Wave Z could theoretically extend deeper, approaching the golden ratio retracement of Wave 4.
From a liquidity perspective, the order book shows relatively few orders below the current price. Instead, a growing concentration of orders can be observed above the top of Intermediate Wave 3, which are likely to be taken out during the upcoming Intermediate Wave 5. The liquidity heatmap confirms significant liquidity above current levels, concentrated in the fair value gap (FVG) zone, which is expected to be targeted during Wave X. Both the clustered orders and liquidity are highlighted in the chart with the red box. Additionally, the volume profile of the prior Intermediate Wave 3 reinforces the likelihood that Wave Y has ended, as price is currently reacting around the point of control (POC), a logical area for a bounce.
Derivative data also supports the potential end of Wave Y. Funding rates have turned back to positive after a period in negative territory, suggesting traders are reducing short exposure and gradually positioning for higher prices. Open interest has also seen a modest uptick, which will likely expand further as Wave X progresses.
In summary, my bias remains bearish, and I will be positioning short at the top of Wave X. Furthermore, I expect Wave Z to take the form of a Flat rather than a Triangle.

EthUSD h4📊 Ethereum (H4 Update)
On H4, we have an average sell setup aligning with a clear Order Block (Sell Side).
📍 Once price retests this Order Block, we’ll move to lower timeframes and look for Sell setups with confirmation.
✅ Wait for confirmation
✅ Follow risk management

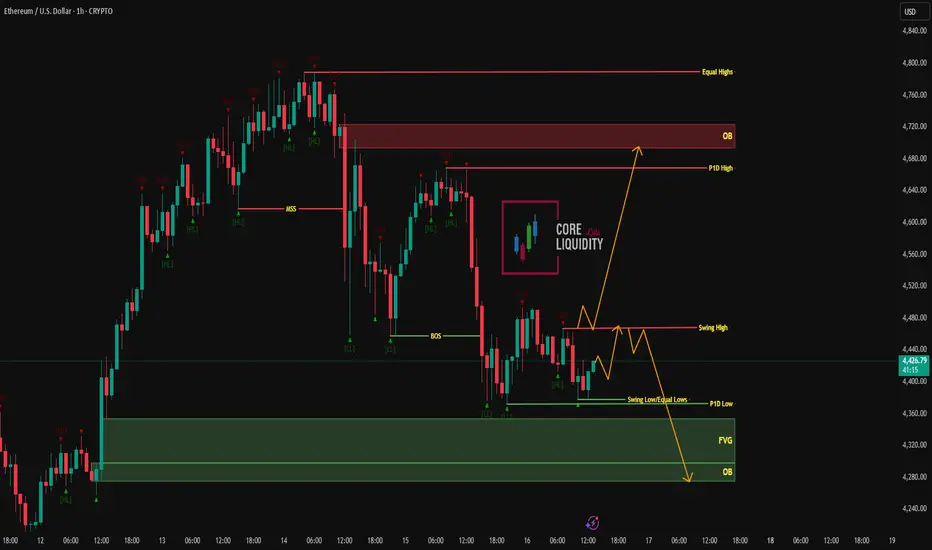
ETH/USD – 1H OB Reaction | Key Decision Zone AheadEthereum is consolidating between equal lows and the recent swing high, building pressure for the next big move. The reaction from this zone will guide whether we see a bullish breakout or a bearish continuation.
Bullish Scenario:
Hold above P1D Low (~4,360)
Break swing high (~4,480) → Push into OB (~4,720)
Target liquidity at Equal Highs (~4,800)
Bearish Scenario:
Fail to reclaim swing high (~4,480)
Break equal lows/P1D Low (~4,360) → Drop into FVG & OB (~4,280–4,300)
Deeper continuation possible if sellers hold momentum
Key Levels:
🟢 P1D Low / Equal Lows: 4,360
🔴 Swing High: 4,480
🟢 OB Target: 4,720
🔴 Equal Highs: 4,800
💬 Will ETH bounce into the OB or break down to the FVG? Share your view below.
ETHUSD : from 1W to 4HLet's continue our discussion.
Previously, we looked at the chart from afar, just to get a bird's-eye view of the price.
Now, we zoom in to examine the details.
If price fails to touch/surpass the previous ATH - buyers are f**ked.
From the above, we can roughly tell who blinked first.
Anyway, in this game, there is no certainty. Only probabilities.
Good Luck - this is the last of the ETH idea from me.

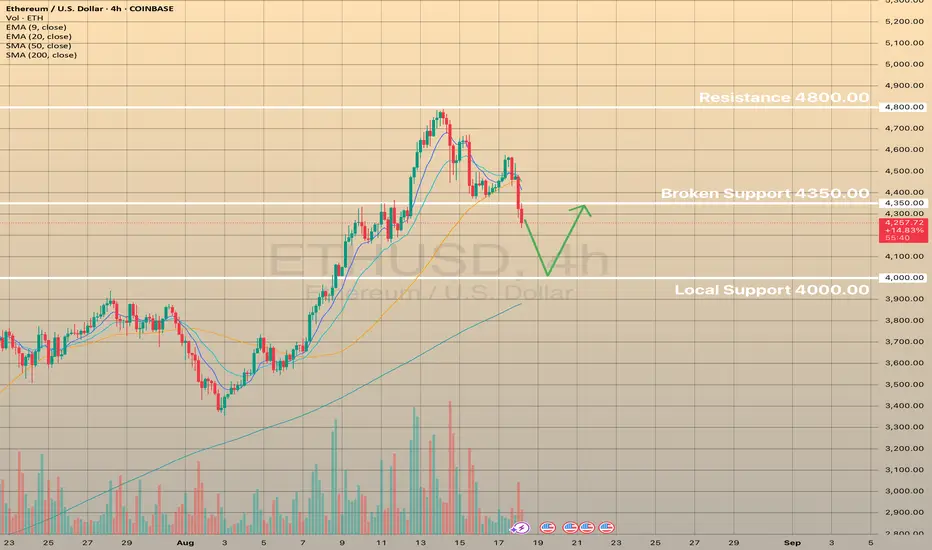
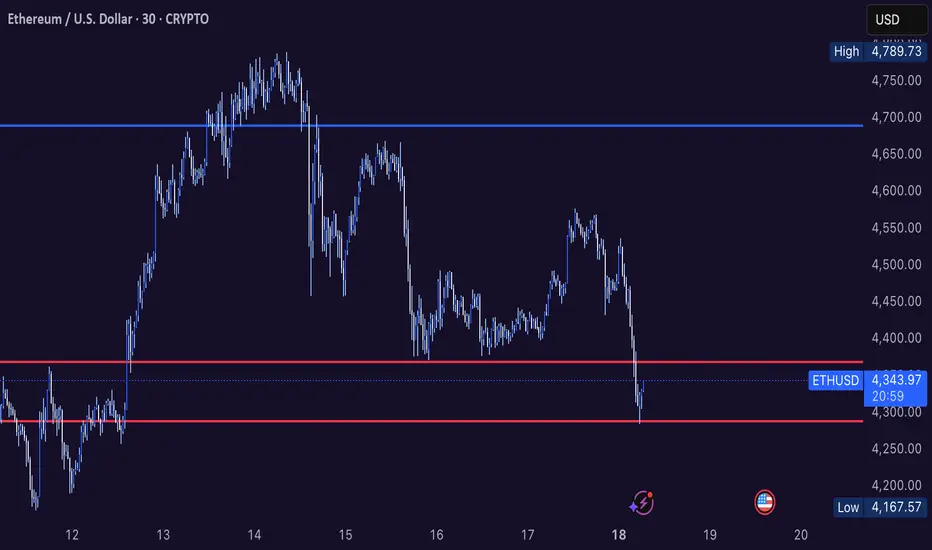
ETHUSD falls on fears of hawkish key rate policyETHUSD falls on fears of hawkish key rate policy
Ether fell by 4% to $4,296.50 on August 18, pressured by last week’s higher-than-expected U.S. macro data. The drop reflects reduced investor confidence amid elevated inflation, with July’s PPI at 3.3% year-over-year, lowering expectations for a Fed rate cut. Spot ether ETF flows dipped modestly, but institutional engagement remains strong, with funds rotating to lower-cost products like BlackRock’s IBIT. Analysts see the Fed’s Jackson Hole Symposium and August 21 jobless claims as key upcoming factors.
ETHUSD broke below the support of 4,350.00. The price is heading towards local support of 4,000.00 in order to retest this crucial level with possible rebound from SMA200 on 4-h chart.
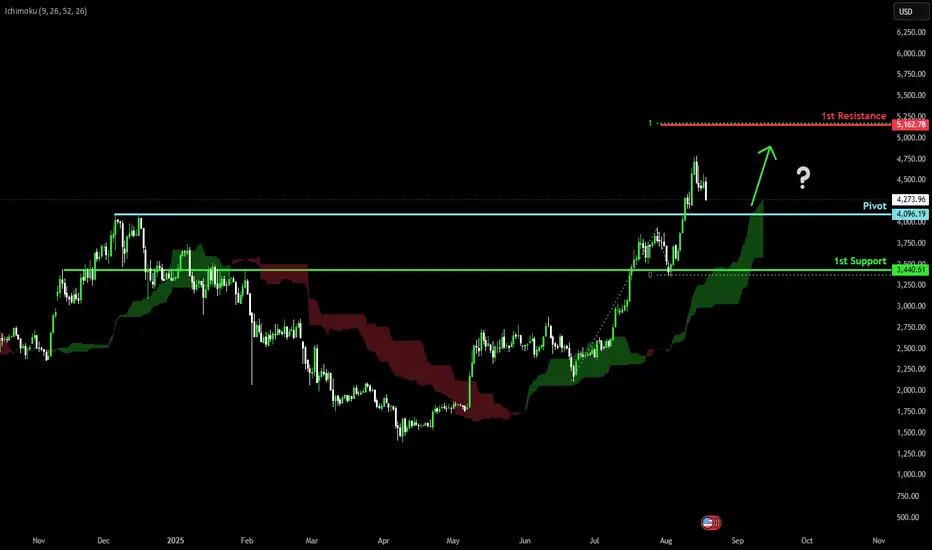
Falling towards pullback support?Ethereum (ETH/USD) is falling towards the pivot, which has been identified as a pullback support and could bounce to the 1st resistance.
Pivot: 4,096.19
1st Support: 3,440.61
1st Resistance: 5,162.78
Risk Warning:
Trading Forex and CFDs carries a high level of risk to your capital and you should only trade with money you can afford to lose. Trading Forex and CFDs may not be suitable for all investors, so please ensure that you fully understand the risks involved and seek independent advice if necessary.
Disclaimer:
The above opinions given constitute general market commentary, and do not constitute the opinion or advice of IC Markets or any form of personal or investment advice.
Any opinions, news, research, analyses, prices, other information, or links to third-party sites contained on this website are provided on an "as-is" basis, are intended only to be informative, is not an advice nor a recommendation, nor research, or a record of our trading prices, or an offer of, or solicitation for a transaction in any financial instrument and thus should not be treated as such. The information provided does not involve any specific investment objectives, financial situation and needs of any specific person who may receive it. Please be aware, that past performance is not a reliable indicator of future performance and/or results. Past Performance or Forward-looking scenarios based upon the reasonable beliefs of the third-party provider are not a guarantee of future performance. Actual results may differ materially from those anticipated in forward-looking or past performance statements. IC Markets makes no representation or warranty and assumes no liability as to the accuracy or completeness of the information provided, nor any loss arising from any investment based on a recommendation, forecast or any information supplied by any third-party.
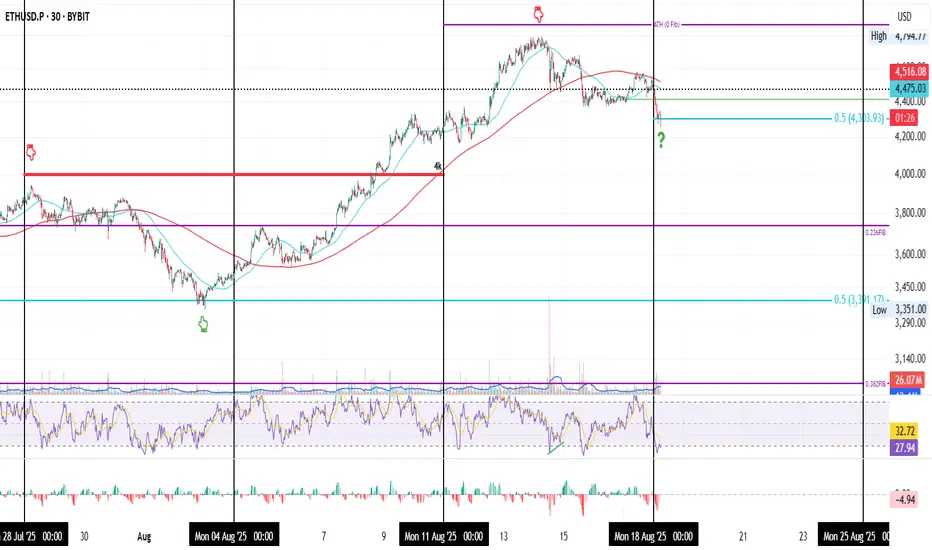
ETH’s Predator Move on the 30min time rame
This is ETH on the 30min timeframe over the past 3 weeks.
It started on Monday, July 28, when price was rejected at the $4K resistance after a Sunday night pump. What followed was nearly half a week of chop, then a drop that found support at the 0.5 Fib = $3391 (the midpoint between the 0.382 and 0.236 levels). From there, ETH rallied +43% to its ATH.
Last week, the same scenario repeated: price rejected from ATH (0 Fib), chopped half a week, then fell Sunday night, this time finding support at the 0.5 Fib = $4303 (the midpoint between the 0.236 and 0 levels).
Now the question is: will this 10% drop be enough to reload for another attempt at ATH, or will price need to retrace deeper to gather the liquidity needed?
One thing is certain: this is a leverage flush. If you’re riding high leverage, understand that you are the prey, and price is the predator. To survive, you need to shed some leverage weight before it catches you.
Always take profits and manage risk.
Interaction is welcome.
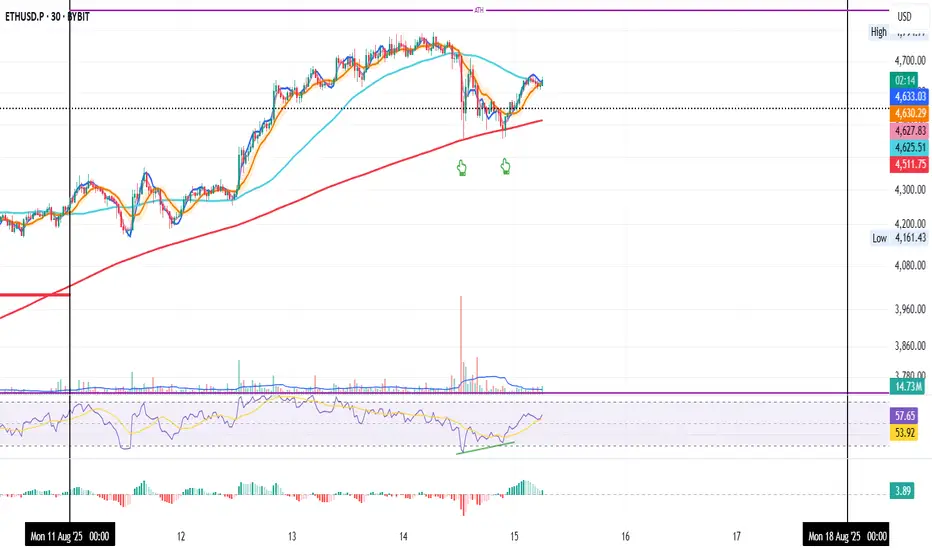
ETH 30min: Double Bottom Setting Up Another ATH Test
ETH on the 30-Min
Yesterday, ETH printed a clean double bottom right on the 200MA.
RSI showed bullish divergence at the same time, a strong reversal signal.
Now, price is holding support at the BB center and 50MA.
If these two levels hold, we could see another push toward the ATH.
Always take profits and manage risk.
Interaction is welcome.
ETH, what price target at the end of the cycle?1) Institutional investors have driven ETH/USD higher since the start of the summer via US spot ETFs
The price of ETH/USD has more than doubled since the start of the summer on the crypto-currency market, in a phase of powerful relative catch-up with the price of bitcoin and an Ether token that is now close to its all-time record. This catch-up phase of the Ether token relative to BTC has been forged on a very healthy fundamental factor: institutional demand.
In fact, it is institutional investors who have driven this sharp rise in the price of Ether, with an explosion in inflows to US spot ETFs on Ethereum. Indeed, it's a given that the bulk of demand via BTC and ETH spot ETFs comes from institutional investors.
Ethereum's underlying uptrend is therefore based on a sound fundamental foundation.
The table below, taken from the Coinglass website, shows inflows and outflows on US spot ETFs on ETH
2) The Ether token is outperforming the bitcoin price, as shown by the technical analysis of the ETH/BTC ratio, and this should continue until the end of the cycle
The second aspect in Ethereum's favor is the sequence of outperformance against ETH on BTC. This is the lesson of the bullish message from technical analysis applied to the ETH/BTC ratio. The latter has turned upwards from a major support level, and the technical upside potential remains significant for the coming months.
The chart below shows weekly Japanese candlesticks for the ratio between Ethereum and Bitcoin
3) ETH/USD will pause below its all-time high of $4900 (that of the previous cycle), but should be able to move beyond it by the end of the cycle
The price of ETH/USD has reached its all-time high of $4850 in autumn 2021, the peak of the previous cycle. It's only logical that the market should start to stall and retrace to consolidate the rise since early summer. The market could develop a range phase between support at $4,000 and resistance at $4,850, before later being able to resume its fundamental uptrend. Historically, the Ether token cycle ends two to three weeks after the end of the BTC bull cycle, so it's likely that ETH/USD will be able to exceed its all-time high in the fourth quarter of this year 2025. The chart below outlines theoretical targets if and only if the all-time high of $4850 is broken by the market. Invalidation if major support at $4,000 is broken.
The chart below shows weekly Japanese candlesticks for the ETH/USD rate
DISCLAIMER:
This content is intended for individuals who are familiar with financial markets and instruments and is for information purposes only. The presented idea (including market commentary, market data and observations) is not a work product of any research department of Swissquote or its affiliates. This material is intended to highlight market action and does not constitute investment, legal or tax advice. If you are a retail investor or lack experience in trading complex financial products, it is advisable to seek professional advice from licensed advisor before making any financial decisions.
This content is not intended to manipulate the market or encourage any specific financial behavior.
Swissquote makes no representation or warranty as to the quality, completeness, accuracy, comprehensiveness or non-infringement of such content. The views expressed are those of the consultant and are provided for educational purposes only. Any information provided relating to a product or market should not be construed as recommending an investment strategy or transaction. Past performance is not a guarantee of future results.
Swissquote and its employees and representatives shall in no event be held liable for any damages or losses arising directly or indirectly from decisions made on the basis of this content.
The use of any third-party brands or trademarks is for information only and does not imply endorsement by Swissquote, or that the trademark owner has authorised Swissquote to promote its products or services.
Swissquote is the marketing brand for the activities of Swissquote Bank Ltd (Switzerland) regulated by FINMA, Swissquote Capital Markets Limited regulated by CySEC (Cyprus), Swissquote Bank Europe SA (Luxembourg) regulated by the CSSF, Swissquote Ltd (UK) regulated by the FCA, Swissquote Financial Services (Malta) Ltd regulated by the Malta Financial Services Authority, Swissquote MEA Ltd. (UAE) regulated by the Dubai Financial Services Authority, Swissquote Pte Ltd (Singapore) regulated by the Monetary Authority of Singapore, Swissquote Asia Limited (Hong Kong) licensed by the Hong Kong Securities and Futures Commission (SFC) and Swissquote South Africa (Pty) Ltd supervised by the FSCA.
Products and services of Swissquote are only intended for those permitted to receive them under local law.
All investments carry a degree of risk. The risk of loss in trading or holding financial instruments can be substantial. The value of financial instruments, including but not limited to stocks, bonds, cryptocurrencies, and other assets, can fluctuate both upwards and downwards. There is a significant risk of financial loss when buying, selling, holding, staking, or investing in these instruments. SQBE makes no recommendations regarding any specific investment, transaction, or the use of any particular investment strategy.
CFDs are complex instruments and come with a high risk of losing money rapidly due to leverage. The vast majority of retail client accounts suffer capital losses when trading in CFDs. You should consider whether you understand how CFDs work and whether you can afford to take the high risk of losing your money.
Digital Assets are unregulated in most countries and consumer protection rules may not apply. As highly volatile speculative investments, Digital Assets are not suitable for investors without a high-risk tolerance. Make sure you understand each Digital Asset before you trade.
Cryptocurrencies are not considered legal tender in some jurisdictions and are subject to regulatory uncertainties.
The use of Internet-based systems can involve high risks, including, but not limited to, fraud, cyber-attacks, network and communication failures, as well as identity theft and phishing attacks related to crypto-assets.

Ethereum we long the gold zone?At this point the market seems to be sidetrending. Finding an entry is hard but ill take my chances with longing the gold zone. Please I bless all you traders.
