#ETHUSD Heading towards 4608----6599 LevelsBINANCE:ETHUSD Etherum after making All time high of 4870 levels. And making a correction we could see an incomplete Sequence, which is heading towards 4608-----6599 levels. Any selloff/ Panic we could see is a good buy for the target level.
Overall crypto market looks extremely strong BINANCE:BTCUSD BINANCE:XRPUSD
ETHUSD.PI trade ideas

Big Rising Wedge 1D Bear SignalNow all euphoria CRYPTOCAP:ETH more want pump and pump but all pump close Dump🔴🔴
Timeframe: 1D
Rsi: 🔴🔴↘️
Pattern: Rising Wedge 🔴🔴↘️
Soon unstake Ethereum and sell tokens

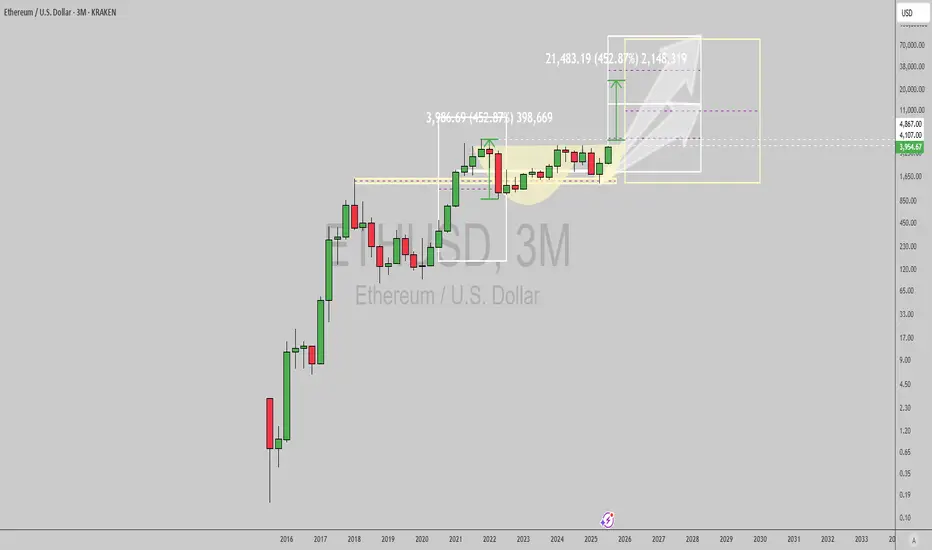
ETH watch $4238.73: Semi-Major Genesis fib to slow/stop SurgeShown here is a single fib series in 3 different timeframes.
The "Genesis Sequence" has called all major turns since 2015.
$4238.73 is a "Semi-Major" fib Ratio so it will be quite strong.
It is PROBABLE that we orbit this fib a few times.
It is POSSIBLE that we reject and form a local top.
It is PLAUSIBLE that we Break-n-Retest to continue.
See "Related Publications" for previous analysis ---------->>>>>>>>>>>

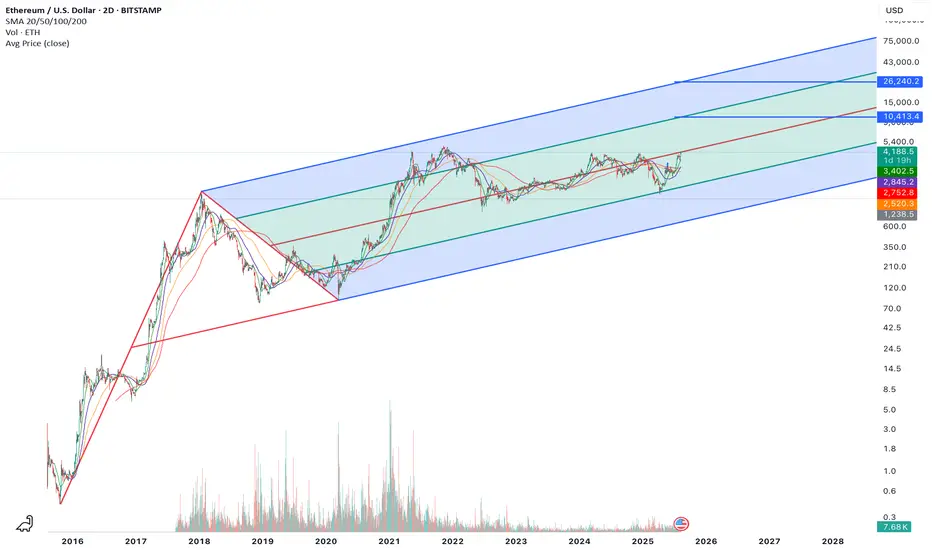
Ethereum’s $26K Path: Pitchfork Precision Meets 401(k)🚀 Ethereum’s $26K Path: Pitchfork Precision Meets 401(k) Mega Capital Inflows
Ethereum’s long-term pitchfork structure — stretching back nearly a decade — has been an uncannily accurate roadmap for the asset’s entire price history. Every major bull run and retracement has respected these channel boundaries with surgical precision. And now, the math points to a euphoric cycle peak near $26,240.
But here’s what’s different this time: a perfect storm of structural, macro, and legislative catalysts could fuel the most explosive Ethereum rally in history.
1️⃣ The Technical Blueprint: ETH’s Pitchfork to the Moon
The chart above speaks for itself:
Multi-cycle median line respect → Every parabolic move in ETH has peaked near the upper bound of this pitchfork.
2025 setup mirrors 2017 & 2021 → Both prior cycle expansions occurred from near the lower channel up to the upper band within 12–18 months.
Current positioning → ETH is breaking away from the midline, with momentum building toward the $10.4K resistance area before a final euphoric move to the $26K upper band.
2️⃣ The Game-Changer: Trump’s 401(k) Executive Order
On August 7, 2025, President Trump signed an executive order allowing 401(k) retirement plans to invest directly in private equity — and by extension, in private tokenized assets and alternative vehicles that can include crypto exposure.
Why this matters for Ethereum:
$7.3 trillion 401(k) market in the U.S. alone.
Even a 1% allocation into ETH through tokenized or pooled products equals $73 billion in demand — over 25% of ETH’s current market cap.
Coupled with upcoming Ethereum-based private market tokenization rails, this could create persistent retirement-driven demand that never existed before.
3️⃣ Ethereum’s Unstoppable Macro Tailwinds
Beyond the 401(k) shockwave, ETH’s macro positioning has never been stronger:
BlackRock’s Ethereum staking ETF pending SEC approval — opening the floodgates for institutional inflows.
Ultra-sound money supply mechanics — ETH’s burn rate has outpaced issuance in multiple months, meaning supply is shrinking while demand is about to accelerate.
Tokenization megatrend — Real estate, private credit, and commodities are increasingly issued on Ethereum rails, boosting transaction demand and fee burns.
Layer 2 explosion — Rollup adoption is pushing more economic activity onto Ethereum, while fees and settlements still flow to ETH validators.
4️⃣ The Cycle Anatomy: How $26K Happens
If history rhymes, here’s how the final leg could unfold:
Breakout to $6K–$7K as ETF approval and 401(k)-related flows kick in.
Acceleration to $10.4K — the mid-pitchfork resistance — as retail and media hype return.
Parabolic blow-off into the $20K–$26K zone as institutional + retirement inflows collide with ultra-low liquid supply.
5️⃣ Why This Time Could Overshoot
Unlike past cycles, Ethereum now sits at the intersection of:
Institutional-grade adoption (BlackRock, Fidelity, JPMorgan)
On-chain structural scarcity (post-merge burn dynamics)
Legislative green lights (401(k) access to alternatives)
Global macro rotation into risk assets as interest rates pivot
If prior cycles were crypto’s “dot com era,” this one is the mobile internet + cloud migration phase — except ETH is the protocol on which everything runs.
Bottom line:
The $26K target isn’t just a chartist’s fantasy — it’s a mathematically reinforced roadmap now backed by the largest pool of retirement capital in the world.
Ethereum is no longer just “digital oil.” With this convergence of technical, macro, and legislative forces, it’s becoming the primary settlement layer for global finance — and this cycle could be the moment the market finally prices that in.
ALT season is here - this is huge, hugeETH is in an enormous symmetrical triangle on the weekly chart and its crossing upper line.
If the week finishes above 4000, nobody can stop this. Running to 6000 without stopping is almost certain.
After it needs to relax and the alt season will explode. This seems to be just a new life opportunity.

ETH - The long call Man this took forever. On this way up, its likely to handily exceed the previous target of $4383 after some resistance. $6375 is definitely in the cards. Will this be Eths big year?

Ethereum Unleashed: A Technical Playbook for New HighsProof of Strength: An Analysis of Ethereum's Dominance and Year-End Trajectory
Date of Analysis: August 09, 2025
Executive Summary
Ethereum has not just recovered; it has entered a powerful breakout phase. The explosive move past the psychological $4,000 barrier this week, confirmed by a surging market dominance, signals a significant shift in market dynamics. This indicates a strong bullish continuation for the remainder of the year. While the current momentum is formidable, extremely overbought conditions on key indicators suggest that strategic entry and risk management will be paramount.
Part 1: Analysis of the Last 7 Days (August 2 - August 9, 2025)
The past week has been nothing short of spectacular for Ethereum, culminating in a major technical and psychological breakout.
Price Action & Key Levels:
Parabolic Breakout: The narrative has evolved from a simple recovery to a full-fledged breakout. After establishing support around $3,600, ETH has surged aggressively, shattering the $4,000 resistance level to trade at $4,022. This move demonstrates immense buying pressure and market conviction.
New Support Established: The previous resistance zone around $3,850 - $3,900 is now the immediate support level to watch. A successful defense of this zone on any pullback would be a powerful confirmation of the trend's strength. The $4,000 level itself is now a critical psychological floor.
Dominance as a Leading Indicator: The rise in ETH Dominance (ETH.D) to 12.65% was a precursor to this move. The fact that dominance climbed before and during this price explosion confirms that Ethereum is the clear market leader, attracting a disproportionate amount of capital.
Key Indicator Insights:
Relative Strength Index (RSI): With the price now above $4,000, the daily RSI has pushed further into overbought territory, likely approaching the 80 level. In a strong bull market, an asset can remain "overbought" for an extended period. However, this reading serves as a critical warning that the trend is becoming overheated and is susceptible to sharp, albeit potentially brief, pullbacks.
Moving Averages: The price is now extending significantly above its short-term moving averages (like the 20-day EMA). While bullish, this creates a "gap" that will likely need to be closed by either a period of sideways consolidation or a price correction back towards the moving average.
Trading Strategy Application:
The breakout strategy has now been validated. The aggressive move through $3,900 and $4,000 was the signal for trend-following traders to enter. At current levels, initiating a new long position is high-risk.
The prudent strategy now is to:
Manage existing longs: Consider taking partial profits and moving stop-losses up to just below the new support area around $3,850.
Wait for the next setup: A new entry opportunity would present itself on a successful retest and hold of the $4,000 level, confirming it as the new support base.
Part 2: Outlook for Remainder of the Year (Until December 31, 2025)
The explosive price action this week has significantly improved the outlook for Ethereum, suggesting an accelerated timeline for reaching new highs.
Elliott Wave & Fibonacci Projection: Path to New Highs
To project more ambitious targets, we can apply Elliott Wave theory. The recent price action strongly suggests we are in the midst of a powerful Wave 3 impulse, which is typically the longest and most aggressive phase of a bull market trend.
Wave 1: The initial impulse from the October 2024 lows ($2,200) to the late November high ($3,400).
Wave 2: The shallow correction down to around $3,100 in early 2025.
Wave 3 (Current Wave): The powerful wave that began from the ~$3,100 low and has now broken $4,000.
Using Fibonacci extensions, we can project the potential termination point for this Wave 3:
Primary Target (1.618 Extension): ~$5,050. This is the most common and technically sound target for a Wave 3. It is calculated by taking 1.618 times the length of Wave 1 and adding it to the bottom of Wave 2. Achieving this target would represent a significant new all-time high and is a realistic goal for the coming months.
Aggressive Bull Case (2.618 Extension): ~$6,250. In crypto markets, which are prone to extreme momentum and speculative fervor, third waves often extend. The 2.618 extension represents a "blue-sky" scenario. Reaching this level would likely require continued strength in ETH Dominance and a favorable macro environment.
Potential Scenarios & Strategy:
Bullish Continuation (Primary Scenario): The path of least resistance is upwards towards the $5,050 primary target. The strategy remains to buy on dips. A retest of the $4,000 level would be the first opportunity. A deeper, but still healthy, correction could find strong support at the $3,850 breakout point.
Wave 4 Consolidation: It's important to note that after this powerful Wave 3 completes (whether at $5,050 or higher), a corrective Wave 4 is expected. This would likely manifest as a multi-week period of sideways consolidation or a significant pullback, which would set the stage for the final Wave 5 rally into 2026.
Conclusion
The recent breakout above $4,000 is a game-changer, confirming Ethereum's market leadership and initiating what appears to be a powerful Wave 3 advance. While the immediate path higher may see some volatility due to overbought conditions, the underlying trend is strong. The primary technical target for this move is now set at $5,050, with a more aggressive bull case pointing towards the $6,250 region by year-end. The key is to view any pullbacks not as a reversal, but as an opportunity to join the prevailing bullish trend.

Bullish Cypher PatternI'm seeing a possible bullish cypher pattern. This is connected to one more possible correction of BTC that I posted earlier.

Ethereum could be more bullish than expected✴️ Ethereum could be more bullish than expected
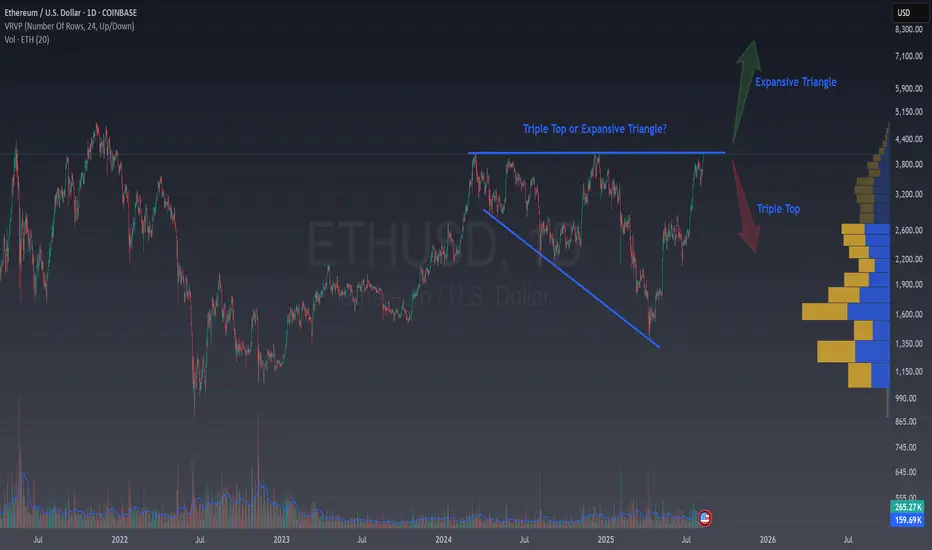
Lately, many traders are pointing at Ethereum’s chart and shouting: “Triple Top!” a classic and easy to spot bearish pattern in technical analysis.
But what if the market is showing us something entirely different?
Zoom in on the structure and you might see an Expanding Triangle (Broadening Formation), a rare but potentially very bullish pattern.
🤔 What Is an Expanding Triangle?
An expanding triangle is formed when both highs and lows keep getting larger, creating a “megaphone” shape on the chart. It's really difficult to spot and is a very rare formation, so it's hard to find ideas on that kind of patterns.
This usually signals:
Rising volatility.
Increasing participation from both buyers and sellers.
A potential build-up before a strong breakout.
Expanding triangles act as continuation patterns and in bullish contexts, breakouts to the upside can be explosive.
⭐ Why This Might Be Bullish for ETH
a) Bitcoin Bull Cycle Nearing Its End
Bitcoin often leads the crypto market. Historically, after its major bull peaks (often 18 months after the halving), capital starts rotating out of BTC into other cryptocurrencies.
Several analysts suggest that we are approaching the later stages of Bitcoin’s current cycle and I also spotted that in recent ideas.
b) The Start of Altcoin Season
One of the most common signals for the start of an altseason is a drop in Bitcoin dominance.
When BTC dominance falls under 60%, altcoins tend to outperform dramatically, something we saw in 2017 and again in 2021.
Recently, BTC dominance has been showing signs of topping, which historically precedes strong altcoin rallies.
c) Ethereum’s Position in the Capital Flow
The typical flow of capital in bull markets is often described this way:
Fiat → Bitcoin → Ethereum → Other Altcoins.
If BTC’s run is maturing, Ethereum is historically the next big beneficiary before the wider market joins in.
📈 The Technical Setup
Looking at the chart:
The upper boundary around $4,000 has been tested multiple times.
Each pullback has found higher lows, expanding the price range.
The pattern’s shape fits the definition of an expanding triangle more than a triple top.
A breakout above $4,000–$4,100 with strong volume could confirm the bullish bias and potentially target previous highs near $4,800, or even new all-time highs if market conditions align.
🔥 Bottom Line
While the crowd may be fixated on a triple top, the broader technical and fundamental context hints at a very different story.
An expanding triangle in Ethereum, combined with the nearing end of Bitcoin’s bull cycle and the likely start of altseason, could set the stage for ETH to become the market’s next big mover. However, a healthy pullback before a breakout is perfectly possible, potentially helping the price rise faster later.
If the price fails to break above the $4,100 resistance, a triple top pattern may begin to form. In that case, we should remain cautious on ETH and pay closer attention to short-term price movements.
💬 Does this setup align with your view on BITSTAMP:ETHUSD ?
🚀 Hit the rocket if this helped you spot the opportunity and follow for more easy, educational trade ideas!
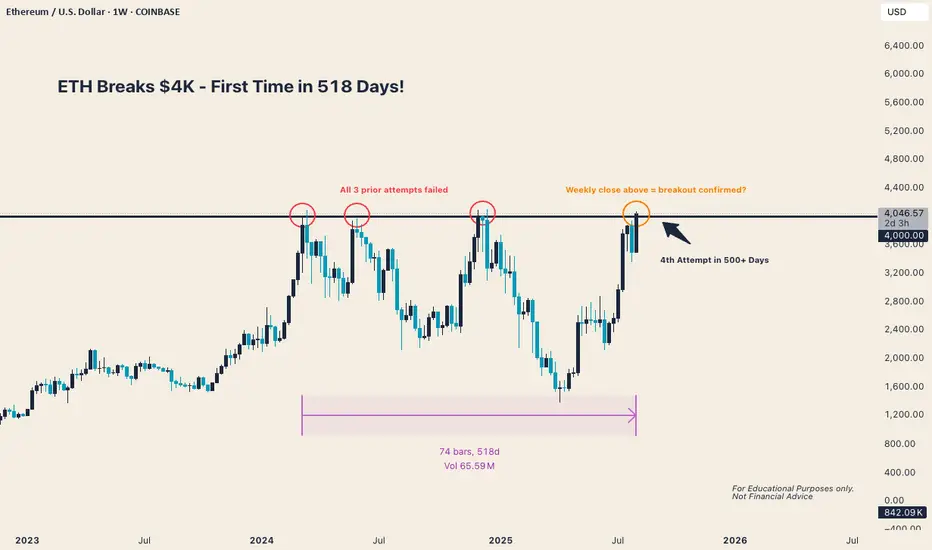
Ethereum Breaks $4,000 - First Time Since 2024After 3 failed breakout attempts over the past 518 days, ETH is once again testing a key macro resistance level.
Historically, when a level like this is broken and held on the weekly close, we see strong follow-through in trend continuation.
Will this be a breakout with legs or another rejection?
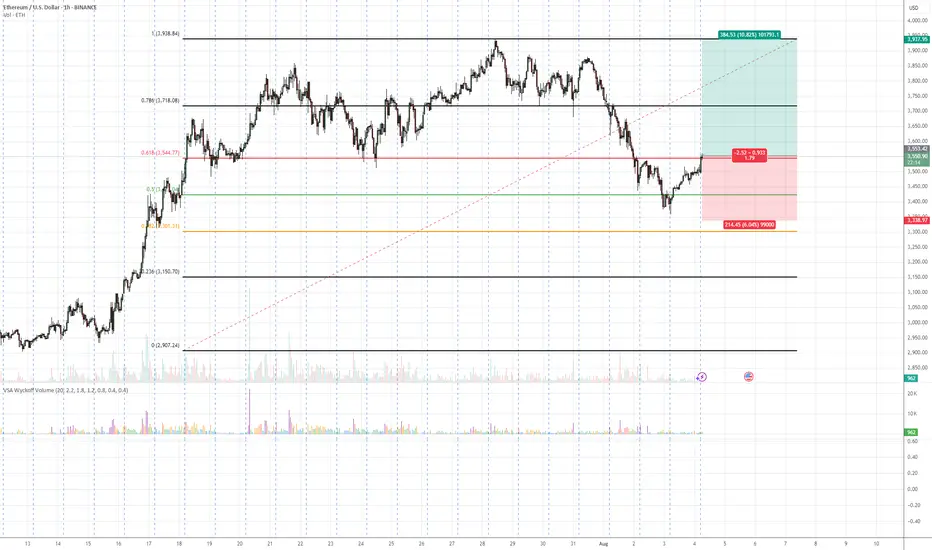
ETH/USDT – Bullish Reversal Potential from Fibonacci Confluence 💡 Idea:
Ethereum is showing signs of demand absorption at a critical Fibonacci support cluster (0.5 – 0.618 retracement). VSA patterns confirm that selling pressure is being absorbed, hinting at a possible markup toward previous swing highs.
📍 Trade Setup:
Entry: Current levels near 3,551
Target: 3,937 (+10.82%)
Stop Loss: 3,338 (below last absorption zone)
R:R Ratio: ~1.79:1
📊 Technical Reasoning (VSA)
1. Stopping Volume at Fibonacci Support
ETH tested the 0.5–0.618 retracement zone from its prior bullish impulse.
Wide spread down-bars on high volume failed to produce significant downside progress, signaling professional buying.
2. No Supply Confirmation
Following the stopping volume, the market printed narrow range candles on decreasing volume, indicating supply exhaustion.
3. Demand Emergence
The recent push above short-term resistance came with increasing volume and wider up-bar spreads, suggesting the start of an accumulation-to-markup transition.
4. Structure & Fibonacci Confluence
Current rally aligns with the Fibonacci golden zone and past structural support.
📌 Trading Plan:
Enter on confirmed breakout above minor resistance with volume expansion.
Scale out partial profits near 3,800 and let remainder ride toward 3,937.
Keep stop below 3,338 to avoid being shaken out by false breakouts.
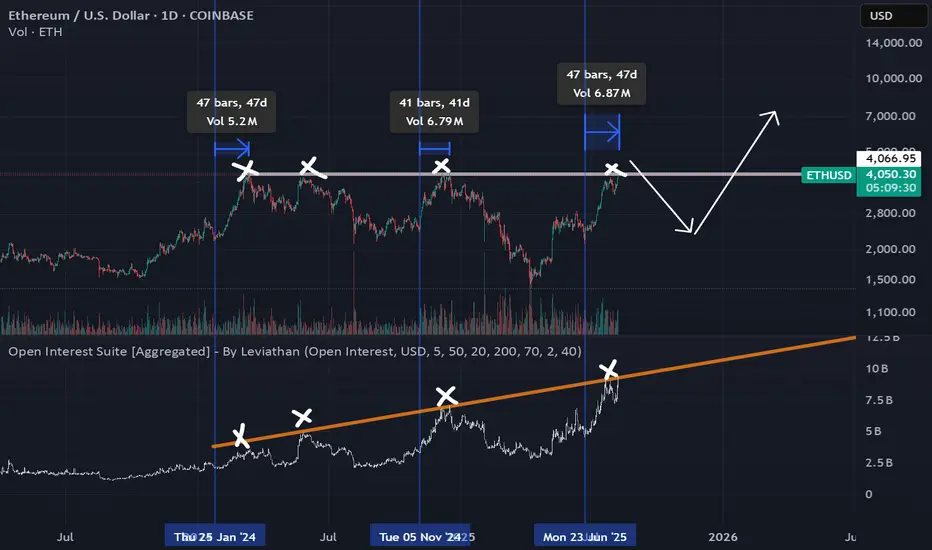
Why ETH Might Get Rejected... AgainThere are several reasons to believe ETH will get rejected from this area once again:
1_Open interest is extremely high, meaning everyone’s borrowing money to add even more to their long positions. That’s definitely not healthy for a sustained uptrend. We might see a “staircase up, elevator down” type of move soon.
2_This rally is way overextended — we’ve been in a parabolic uptrend with no meaningful correction for the past 47 days. It's been a consistent pattern of higher lows and higher highs. We need at least 2–3 weeks of downtrend to regain strength for another solid move upward.
3_There’s no real fundamental news backing this move. There’s the 401(k) Trump order, but that mostly affects BTC — and even then, it would take ages for any actual money to hit the market (if it ever does). This ETH pump is mostly driven by FOMO — people buying just because others are buying ETFs. Pure hype about ETH hitting some fantasy number in the future.
4_Seasonal weakness matters — I highly doubt ETH can break through major resistance during the summer, especially in a historically bearish month like August.
I expect a correction wave to the downside — at least somewhere bellow the $3,350 area( Why 3350? because it's most recent higher low) . We might get a fakeout above $4,100 before that happens. From there, we can reassess the market to see if it’s ready to finally take out that $4,100 resistance or not.
ETH Don’t Miss Out!!!
**🚀 ETH WEEKLY TRADE IDEA — \$4K BREAKOUT WATCH**
📈 **Market Bias:** Bullish (Long-term uptrend intact, ETH above key MAs)
⚠ **Short-Term Risk:** MACD bearish crossover + RSI overbought → possible pullback before breakout
📊 **Key Level:** Testing **\$4,000** psychological resistance
**🛠 Setup:**
* **Direction:** LONG
* **Entry:** \$3,966.12
* **Stop Loss:** \$3,900 (below key support)
* **Take Profit:** \$4,050 (first target)
* **Size:** 0.5 (volatility-adjusted)
* **Confidence:** 75%
* **Entry Timing:** Market open
📌 **Why Long?**
* Strong uptrend + above key moving averages
* Positive funding rates and recent momentum support bullish case
* Risk-reward favorable for a potential \$4K+ breakout
💡 *Watch for volume confirmation — failure to break \$4K with strong buy-side pressure could trigger a pullback to \$3,900.*
---
**#ETH #Ethereum #Crypto #Cryptocurrency #CryptoTrading #ETHUSD #Altcoins #Bitcoin #BTC #CryptoSignals #CryptoSetup #TechnicalAnalysis #SwingTrade #DayTrade #PriceAction #BreakoutTrading #CryptoMarket #CryptoInvesting #MACD #RSI #TradingStrategy #BullishSetup #SupportAndResistance #VolumeAnalysis**

Ethereum 1D RSI bearEthereum look bad after big Pump, always come correction for next move 🔴↘️
Timeframe: 1D
Indicator: RSI
Remember about soon will unstake CRYPTOCAP:ETH
Target: 3200$/3000$

Ethereum's Playing Too CleanBro, how’s Ethereum nailing price action so perfectly lately—no traps, just clean moves every time?
No Fakeouts, No Drama, Just perfect textbook moves
#Ethereum #CryptoTrading

ETHUSD previous resistance , new support at 3,807The ETHUSD remains in a bullish trend, with recent price action showing signs of a resistance breakout, within the broader uptrend.
Support Zone: 3,807 – a key level from previous consolidation. Price is currently testing or approaching this level.
A bullish rebound from 3,807 would confirm ongoing upside momentum, with potential targets at:
4,085 – initial resistance
4,166 – psychological and structural level
4,226 – extended resistance on the longer-term chart
Bearish Scenario:
A confirmed break and daily close below 3,807 would weaken the bullish outlook and suggest deeper downside risk toward:
3,732 – minor support
3,650 – stronger support and potential demand zone
Outlook:
Bullish bias remains intact while the ETHUSD holds above 3,807. A sustained break below this level could shift momentum to the downside in the short term.
This communication is for informational purposes only and should not be viewed as any form of recommendation as to a particular course of action or as investment advice. It is not intended as an offer or solicitation for the purchase or sale of any financial instrument or as an official confirmation of any transaction. Opinions, estimates and assumptions expressed herein are made as of the date of this communication and are subject to change without notice. This communication has been prepared based upon information, including market prices, data and other information, believed to be reliable; however, Trade Nation does not warrant its completeness or accuracy. All market prices and market data contained in or attached to this communication are indicative and subject to change without notice.

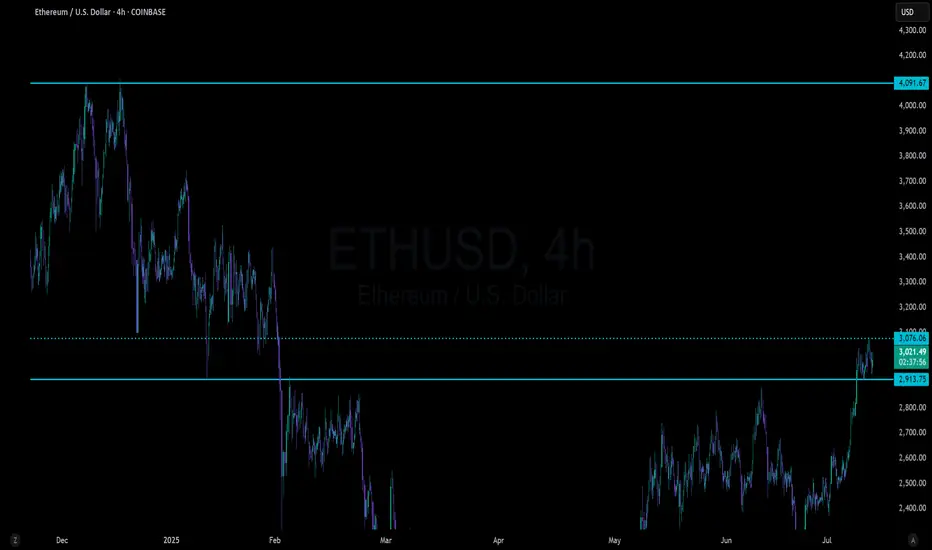
ETH broke a nearly 4 year resistance levelLooking at Ethereum on the daily or weekly Logarithmic chart you can see resistance being consistent since Nov 8th, 2021.
Today, Ethereum has broken through. It was brief, it was fast and it was so small that you can't even see it when zoomed out so far to see the multi year down trend.. However, if you take a look at ETH on the 4hr chart you can see it.
I don't know how ETH will react when breaking such a long downtrend and I look forward to finding out. A retest of the all time high from here seems plausible after such a long downtrend.

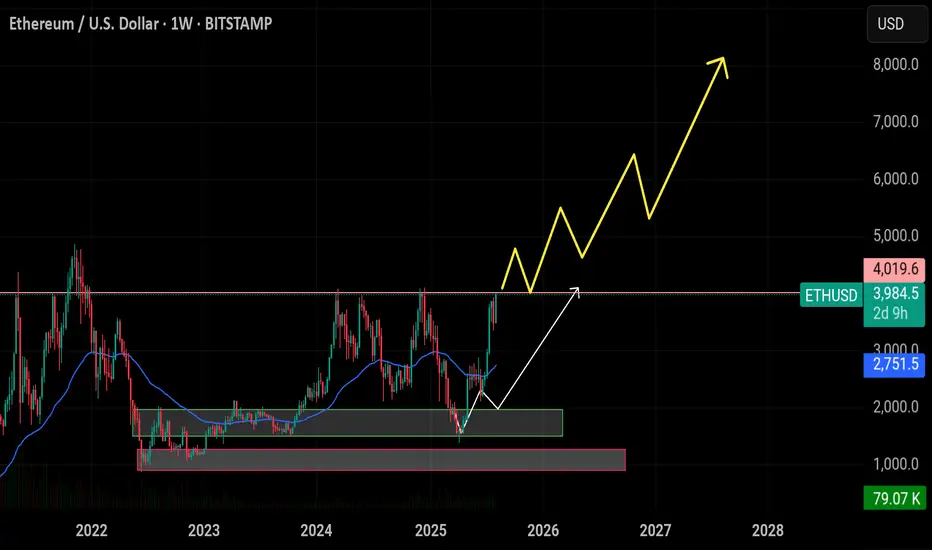
$ETH/USDT Breakout Analysis 1W Chart: Ethereum $ETH/USDT Breakout Analysis 1W Chart:
ETH has successfully reached the $4,000 breakout level, completing our first major target from the accumulation zone ($1,500–$1,900). Price is currently testing the critical $4,000 resistance. If ETH can close a weekly candle above this level and hold, it will confirm a strong continuation structure — potentially targeting $5,000, $7,000, and up to $8,000 in the coming months.
🔸 Support LEVEL: $3,500 is now the key weekly support zone. This level aligns with previous resistance and structure, offering a strong base for bullish continuation. If ETH holds $4,000+ weekly, $3,500 becomes a high-conviction re-entry zone.
🔸 Upside Target: Upon confirmation above $4,000, ETH could rally toward $5,000 short-term, with extended targets at $7,000 and $8,000 if momentum continues.
🔸 Risk Level at $3,500: A weekly close below $4,000 followed by a drop under $3,500 would invalidate the breakout. This could signal a failed breakout and return to range. High risk zone opens below $3,200.
🔸 Watch for Retest ZONE: Look for a healthy retest of the $3,900–$4,000 zone. If ETH pulls back and holds this zone on weekly, it offers a strong entry with targets toward $5,000 and above.
Ethereum breakoutEthereum monthly chart shows a clear breakout above the 3800 resistance, targeting 8k.

Ethereum Is Setting Up For Potential Bull Flag On the Weekly ETH is flirting with a potential break out of this bull flag formation starting in 2022. Lower time frames are confirming this is a key battleground. A break to new all time highs would signal a run to fib extension levels.. don't forgret...BTC ran from 5K to 20K top in 2021 bull market peak.

$ETHUSD: Long term trend and cup and handle pattern...Ethereum is finally very close to breaking out into a new 52wk high following a long term basing pattern that looks like a classic cup and handle. Timemode signals warned us of its bullishness earlier, as the daily, weekly, monthly and now quarterly trends turned bullish one after the other since April this year.
If you're sidelined or short, join the bulls and go long ASAP. Risk is a drop under $1715 for the long term patterns at play here, projected targets range from 10k to 95k long term. Fundamentals as you probably know favor a massive bullish trend as ETH transaction count breaks ATH, institutions race to acquire more ETH day to day, ETF flows are steadily bullish and regulations have become favorable for the growth of defi via stablecoin and RWA adoption, as well as potential for new defi primitives and existing ones to gain traction with widespread use.
Ethereum defi now is secure and solid enough, and can handle the required throughput, and the wheels are in motion for a spectacular move from here.
Best of luck!
Cheers,
Ivan Labrie.
Ethereum | ETH | Long at $2,598.77Currently within my historical simple moving average area and consolidating. I suspect a move up is imminent, but 100% speculation. Crypto "bros" know more than I do.
Targets into 2028:
$4,000 (+53.9%)
$5,500 (+111.6%)
