ETH Technical Analysis: Relief Bounce, But the Downtrend RemainsETH Technical Analysis: Relief Bounce, But the Downtrend Remains Intact
1. ETHUSD has been forming lower swings continuously, reinforcing a dominant downtrend. Supported by a sign of bearish EMA stack to the 100 EMA, signalling a broader corrective phase with strong bearish momentum.
2. There are still no bullish reversal signals yet, suggesting that any rebound is likely to be a short-term relief rally, forming a lower high before the downtrend resumes.
3. Initial resistance is seen near 3,275, where former support and the EMA20 may act as a supply zone before another leg lower.
4. If ETHUSD breaks below support at 2,730, it could unlock further downside toward the next key support around 2,100.
Analysis by: Krisada Yoonaisil, Financial Markets Strategist at Exness
Trade ideas

Continuing the ChallengeForgive me but I have been in hospital with a wide variety of health problems to do with my gut which is still on going and took a break from trading. I am regularly getting IBS attacks and it is getting worse. Sometimes you have to realise when you are not in a condition to trade and take a break. A good acronym is HALT standing for Hungry, Angry, Lonely, Tired. If you are any of these, don't trade.
As for the idea, currently looking at an ETH long on the 4h timeframe. Seems to have pulled back to a key support and showing on the lower end of the SD band from the VWAP suggesting a perfect reversal point. I have used ATR bands to judge volatility and set SL just outside the band along with TP at 2x reward to risk.
Looking forward to continuing the challenge on a slightly longer timeframe due to my health problems.

ETHUSD at Decision Point: Trendline Reaction IncomingETHUSD is pulling back from the weak high and trading inside a descending correction; price sits between resistance above and a major support zone below—expect reaction at the trendline, with a potential bullish reversal toward resistance or a breakdown targeting the lower support zone.

Ethereum Outlook: Downtrend Nearing Exhaustion?The crypto market continues to slide, with Ethereum struggling to regain footing. While the short-term trend remains bearish, we may be closer to the end of this decline than the start. Still, wide price swings are likely, and traders should remain cautious.
🔻 Key Breakdown
Ethereum has lost the critical $3,300–$3,400 support, which now flips to resistance. This zone had been a strong base, and its loss introduces technical headwinds that could limit near-term upside.
📉 Next Support to Watch
The $2,600–$2,800 range is the next major support. A test of this zone could offer clues about trend exhaustion or continuation.
🔮 2026 Outlook Still Bullish
Despite the short-term weakness, the macro view hasn’t changed. We expect Ethereum to revisit all-time highs by 2026, with the potential to test the $6,000 area.
📌 Stay focused on key levels and watch for signs of reversal before assuming a bottom is in.

ETH USDHI GUYS.
we have reached take profit for scalpers.
we expect (Thursday , Friday) continuation sells on (HS PATTERN)
hopefully we shall start the RT SELL STRUCTURE SOON.

EthereumETHUSD
- Bullish Channel as an corrective pattern in Short Time Frame
- Break of Structure
- RSI - Divergence
- Order Block
- S / R Level

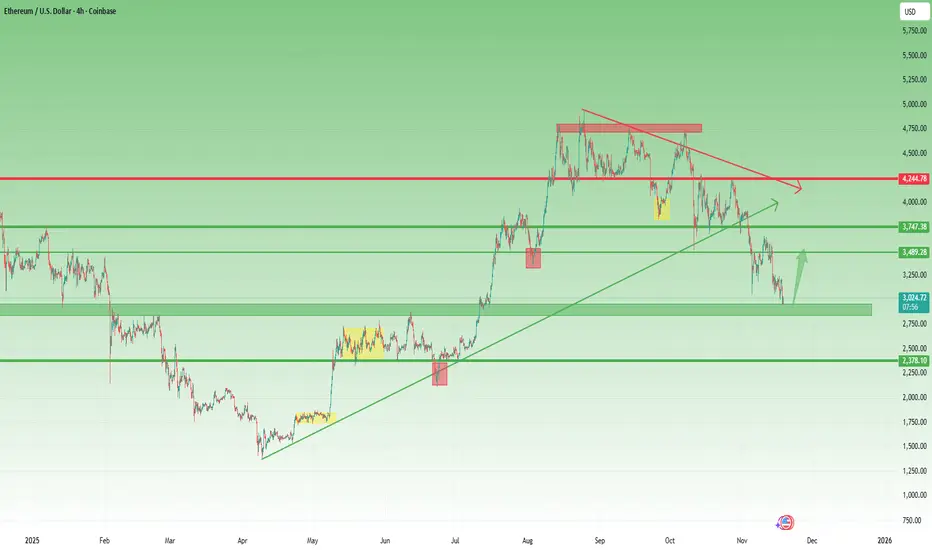
ETH santa rally set up, and short if it failsETH chart looks great for bounce back long here. We have held the HTF golden pocket over the weekend and likely spot to provide a relief rally from hard drop.
We want to see some momentum to the upside for the long trade first. Several 4hr or a daily close over the entry area will be the signal. The final target is the GP and weekly level. Look left to previous consolidation ranges for resistance and likely spots to TP along the way.
However, we are currently in a very strong downtrend and if that should continue the short option is also there. Loss of the GP and entry below the POC of the previous range in this area should take us down to the monthly level. This does offer a tighter SL and will be putting on a larger size trade if this happens.
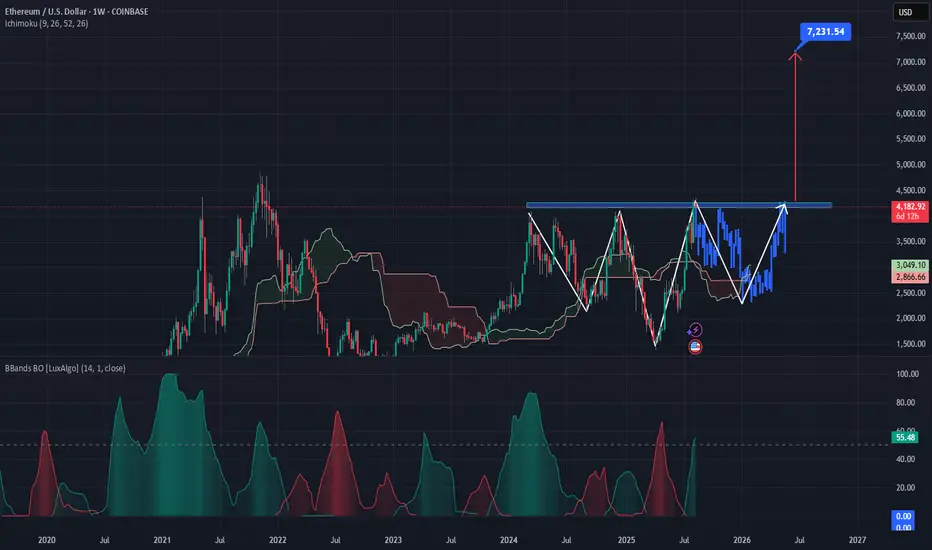
ETH possible reverse HNS pattern predictionAs ETH is trading around psychological zone of 4,000 which it has tested many times. I am seeing some inducement in this area and a potential to reach 7,200 after making reverse HNS pattern. Let's see how it plays out

ETH selling climax!ETH is approaching its final stages of selling. I will watch how price behaves in the marked fib levels.

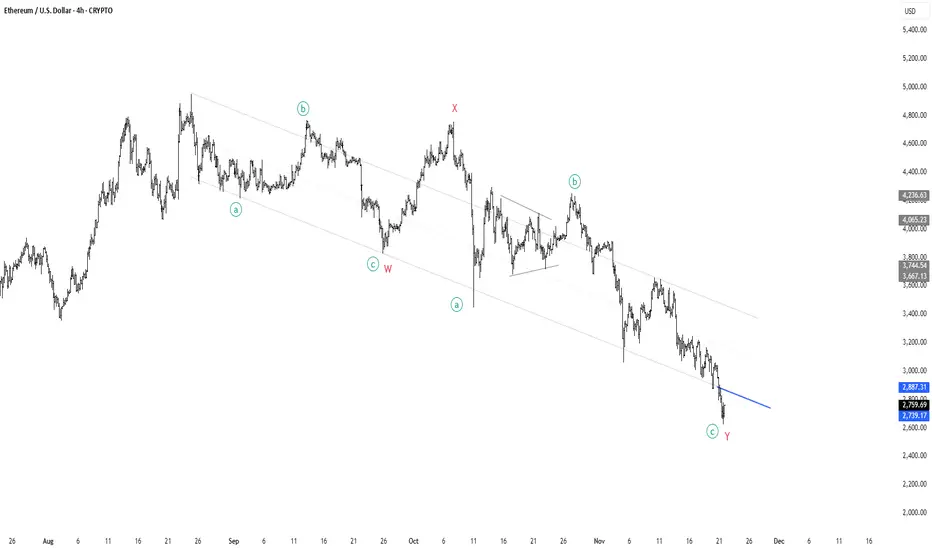
ETH to all time high! Lets go!🚨 ETH Elliott Wave Update 🚨
What we’re looking at here is a clean W-X-Y complex correction unfolding over months — a classic structure when the market wants to correct deeper without breaking the macro trend.
• Wave W completed with an ABC decline
• Wave X gave us the relief rally everyone thought was the bottom ❌
• Wave Y extended lower, subdividing into a-b-c, pulling price into the lower boundary of the corrective channel
Now we’re sitting right at the end of minor wave c of Y, the final leg of this entire structure. The pattern is mature, sellers look exhausted, and the downtrend channel is tightening — perfect conditions for a potential reversal.
🔵 The blue trendline is the key.
If ETH can punch through that level with momentum, it confirms the entire WXY correction is complete and opens the door for a major impulsive leg upward.
💥 Break the blue line → reclaim macro structure →
I believe ETH will begin the march toward new all-time highs.
This is where long-term bottoms historically form:
deep structure, clean proportions, fading downside velocity, and a clear invalidation level.
📈 Eyes on the breakout.
ETH - New ATH coming?I think we can be on the end of the bear market. These are just my thoughts, based on my knowledge on technical analysis, this is not financial advice.

Eth Short to $1,899 Every single time during it's lifetime, when Eth has closed a daily candle below it's 100 week MA, it has substantially declined. Eth may close a daily candle below today or very soon.
The MA is currently at $3,065.
The declines have been decaying, which gives us a probable 38% drop, which would put the target at $1,899.
Every time that this has happened, eth has failed to close a daily candle above the MA after closing below it.
Enter trade at daily closure below $3,065.
Trade invalidated if we close above the MA on the daily.
Take profit at $1,899, and on the way down.

Re-entry Long idea on ETHUSDBased on :
-quantitative analysis
-Volume analysis
-Option flow analysis

ETH Long - Golden Pocket BITSTAMP:ETHUSD is very oversold and showing signs of a short squeeze building on the 4 hour chart. Almost all long liquidity was wiped around 2920 area ($1.3BB on hyper liquid) and there is currently a large cluster of short liquidations around $3120, so it should start to head that direction and cascade up from there until we reach the golden pocket.
There are plenty of macro headwinds, including NASDAQ:NVDA earnings after the bell today that could easily compromise this outlook in the short-term but I believe we will push higher from here. Even if we wick lower in the short-term, I believe that it's close enough to a bottom to enter here with a stop below LOD and some put options to hedge.

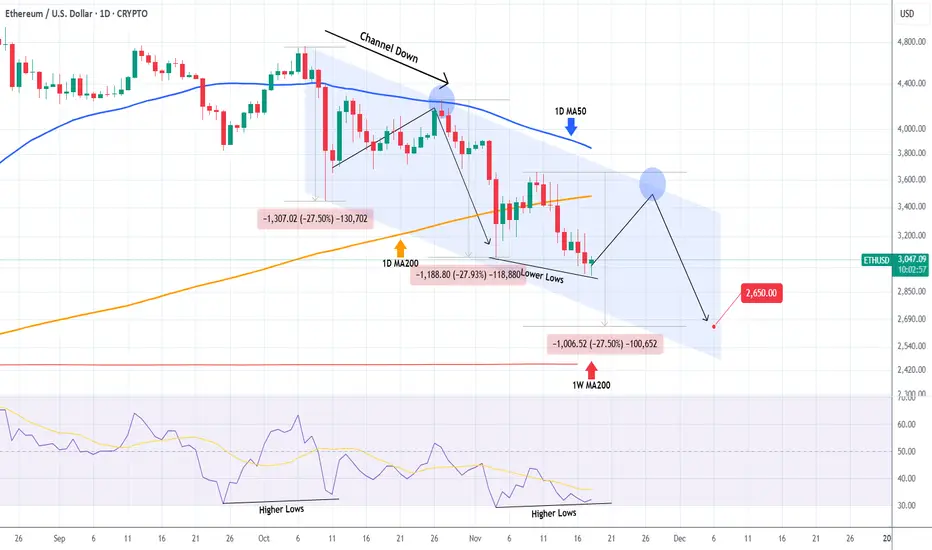
ETHEREUM Dead cat bounce incoming?Ethereum (ETHUSD) has been trading within a Channel Down since the October 07 High with both its Bearish Leg so far declining by -27.50% each.
As the 1D RSI is forming Higher Lows against the price's Lower Lows, i.e. a Bullish Divergence similar to October 11, it is possible to see a short-term bounce to test the 1D MA50 (blue trend-line) again (where the price got rejected on October 27), before it completes the -27.50% Bearish Leg projection.
The medium-term Target remains 2650.
---
** Please LIKE 👍, FOLLOW ✅, SHARE 🙌 and COMMENT ✍ if you enjoy this idea! Also share your ideas and charts in the comments section below! This is best way to keep it relevant, support us, keep the content here free and allow the idea to reach as many people as possible. **
---
💸💸💸💸💸💸
👇 👇 👇 👇 👇 👇
Bearish continuation for ETHEREUMRetracement from new lows
Retest of the head and shoulders neckline
New lows incoming in the next weeks

ETH PERPETUAL TRADE BUY SETUP Long from $2810ETH PERPETUAL TRADE
BUY SETUP
Long from $2810
Currently $2810
Targeting $2970 or Above
(Trading plan IF ETH
go down to $2750 will add more longs)
Follow the notes for updates
In the event of an early exit,
this analysis will be updated.
Its not a Financial advice

ETH Long - 64% increase from $2700 Price RegionThis call is based on a volatility expansion 50% level retest on the 3d. This tool identifies volatility expansion events, tracks how price behaves after them, and builds volatility based projection levels and statistics. It shows how far reversal moves typically travel and how reliable they have been.
I expect a re-test of these same levels provided on the 4h time frame as indicated by the red and white boxes on the upper bound of price.
We have had a good couple weeks of buyers and sellers trading around this level with out any further violent moves below it.
Bitcoin is also starting to show positive market structure on LTF's. I believe during the BTC dead cat bounce alt season will have finally arrived after 4-5 years

ETH Bull Run Alert: From $1,780 Lows to $6,100 Peaks? My TradingHey traders and crypto fam! If you're grinding TradingView charts like me, you've probably eyed Ethereum's wild ride. Right now, ETH is hovering around $2,700 (as of Nov 22, 2025), but let's talk that dip you're mentioning—back to $1,780? That sounds like a throwback to those brutal 2022 lows or a potential retest if macro headwinds (think Fed hikes or BTC dominance spikes) hit hard. But here's the bullish thesis that's got me stacking: In this bull cycle, ETH ain't just recovering—it's primed to moon to $6,100+ by mid-2026. Why? Ethereum's ecosystem is firing on all cylinders: ETF inflows are pouring in, Layer-2 scaling (thanks to Dencun and Prague upgrades) is slashing fees, and DeFi TVL is exploding past $200B. Plus, restaking protocols like EigenLayer are locking up supply like never before. If BTC hits $150K
Risks? Yeah, crypto's volatile AF. If BTC dumps below $80K or regs tighten (SEC eyeing staking?), we could wick back to $1,780. But with 42% of experts saying "buy now" and ETF flows at record highs, the risk/reward screams LONG ETH. What do you think—$6,100 too conservative, or am I dreaming? Drop your takes below, smash that follow button for daily updates, and let's turn this prediction into profits. To the moon! #ETH #CryptoBull #TradingView

Ethereum Slides Deeper as Price Moves Toward 2,750 SupportHello everyone, Ethereum is facing a rather uncomfortable decline after its attempt to recover from the 3,000 USD region failed completely. The price is now hovering around 2,790 USD — the lowest level in over 10 days — and is trading firmly below the Ichimoku cloud, a familiar signal that sellers are still dominating the market.
Observing the price structure on the 4H chart, I see ETH repeatedly leaving red FVGs above, stretching from the 3,000 to 3,200 USD zone. This clearly shows one thing: every recent bounce has been quickly sold off. The market is showing a clear “sell the rally” sentiment, making the short-term downtrend smooth and consistent.
Ethereum is now sliding toward the 2,750 USD zone — a key support area that held price quite well in early November. This is also where liquidity thickens, a region where the market often reacts. But if this level is broken cleanly, the decline could extend toward 2,700–2,650 USD, right at the high-liquidity region and strong support on the D1 timeframe.
News flow also isn’t helping crypto at the moment. The USD is strengthening after September’s jobs report came in far above expectations, raising concerns that the Fed may not cut rates anytime soon. When the dollar becomes more attractive, capital tends to move away from risk assets — and crypto feels the pressure directly. Meanwhile, US equities are recovering strongly thanks to Big Tech and AI stocks, drawing speculative flows away from major coins like ETH.
From my perspective, the highest-probability scenario is that Ethereum continues dropping toward 2,750 USD to test demand. If this area fails to generate a strong enough reaction, price could easily extend lower toward 2,700 USD — a zone where technical buyers may become more active.
What do you think — will Ethereum defend 2,750 USD successfully, or will it need to drop further before recovering?


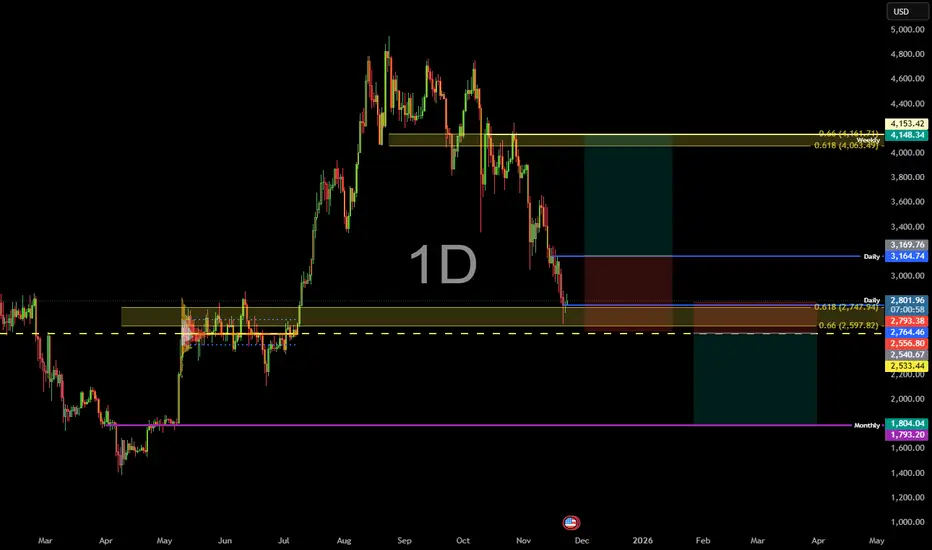
ETH Hits 3K Target – Rebound Likely, Correction Not Over Though1. What Happened Since the Last Update
In my previous ETH analysis, I warned that if Ethereum loses the 3700 support zone, the probability of a drop toward 3000 becomes very high.
That scenario played out perfectly — the 3700 level failed, and price has now reached the 3K zone in recent days.
2. The Key Question Now
Is this the end of the correction, or just the first leg?
From my perspective, the overall correction is probably not finished yet. However, the 3000 area is a major support level, both technically and psychologically, so a bullish rebound from here is very likely.
3. Technical Outlook
Even inside a larger corrective structure, ETH can easily rally $230–$350, or even more, from these levels before deciding the next direction.
Key levels to monitor:
-Support: 3000 → then 2900 (preferred buy zone)
- Upside target: 3300
- Invalidation: A clean daily close below 2800 would weaken the bullish rebound scenario
4. Trading Plan
For the short term, I will look to buy preferably below 2900, targeting 3300 on the bounce.
This is not a long-term trend reversal call — it is a tactical long setup inside a broader correction.
5. Conclusion
ETH has reached the downside target discussed weeks ago. A rebound is likely from here, but the larger correction may not be over yet.
Short-term, buying dips around 2900 makes sense for a bounce toward 3300