Ethereum - Finally new all time highs!🔬Ethereum ( CRYPTO:ETHUSD ) will break out now:
🔎Analysis summary:
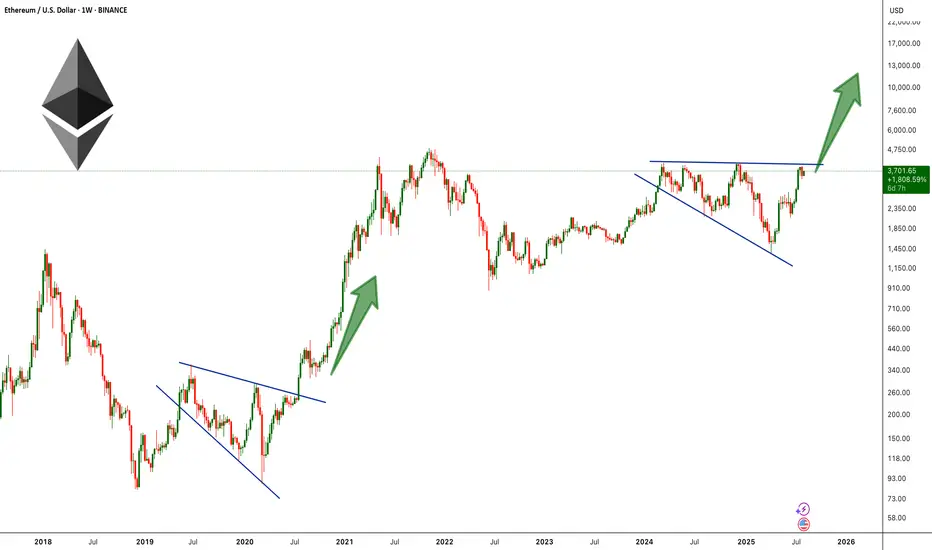
For more than four years, Ethereum has overall been moving sideways. However now Ethereum is once again retesting previous all time highs and preparing a bullish breakout. Multiple retests are generally considered bullish so the breakout is very likely to happen any time soon.
📝Levels to watch:
$4.000
🙏🏻#LONGTERMVISION
SwingTraderPhil
ETHUSD.PI trade ideas


ETH Broadening Wedge Formation !BINANCE:ETHUSDT is forming a broadening wedge pattern on the weekly chart, a structure that often signals high volatility and strong momentum once the price breaks out. This setup is reminiscent of ETH’s 2019–2020 pattern, which also formed as a broadening wedge before breaking to the upside and triggering a historic rally to new all-time highs.
Currently, ETH is pressing against the upper resistance line of the wedge near the $3,900–$4100 zone, a level that has acted as major resistance multiple times in recent months. A decisive breakout above this barrier could ignite strong bullish momentum, opening the path toward the $6,000–$10,000 range.
Cheers
Hexa
Bullish ETH!!!My inverse head and shoulder pattern played out close to perfect, as seen in pic.
Recent bullish move also, made perfect move to downside, with rsi at rock bottom and hitting target perfectly, I say the next bullish move woll break out and hit the new target as seen in pic.
Come on eth!!!

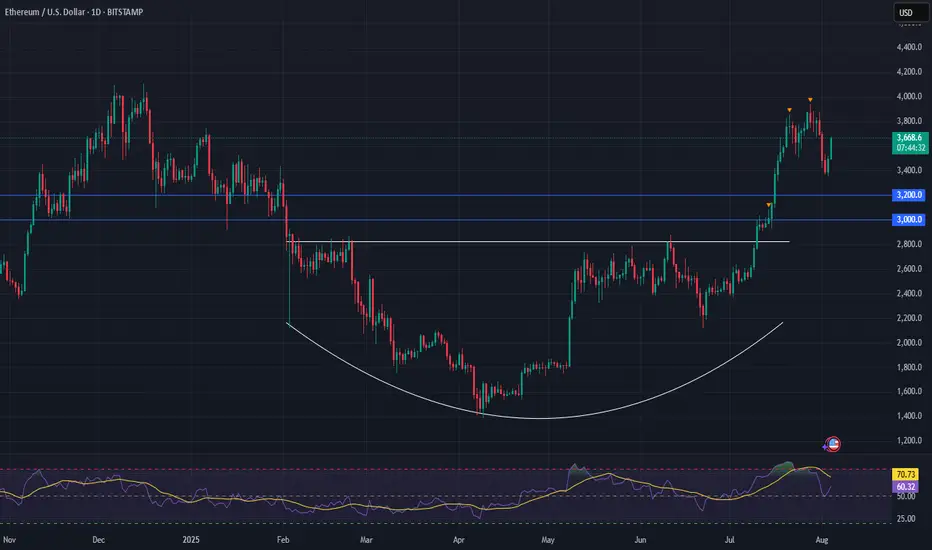
Ethereum (ETH) is setting up for a powerful moveFollowing a strong breakout, ETH has entered a healthy consolidation phase—setting the stage for its next leg higher.
Momentum remains firmly on the bulls’ side, with the breakout from a long-term saucer pattern fueling continued upside pressure.
📈 Technical Highlights:
✅ Short-term target: $4,000+ (breakout continuation)
✅ Long-term potential: $7,000+
🛡️ Key support: $3,000–$3,200 (bullish as long as this holds)
📣 Takeaway:
Ethereum is showing classic bullish structure. With higher-lows forming and strong support below, pullbacks are likely to offer high-probability entries for both traders and long-term holders.
#Ethereum #ETHUSD #Crypto #Trading #TechnicalAnalysis #CryptoTrading #EthereumPrice #Altcoins #Bullish #Breakout
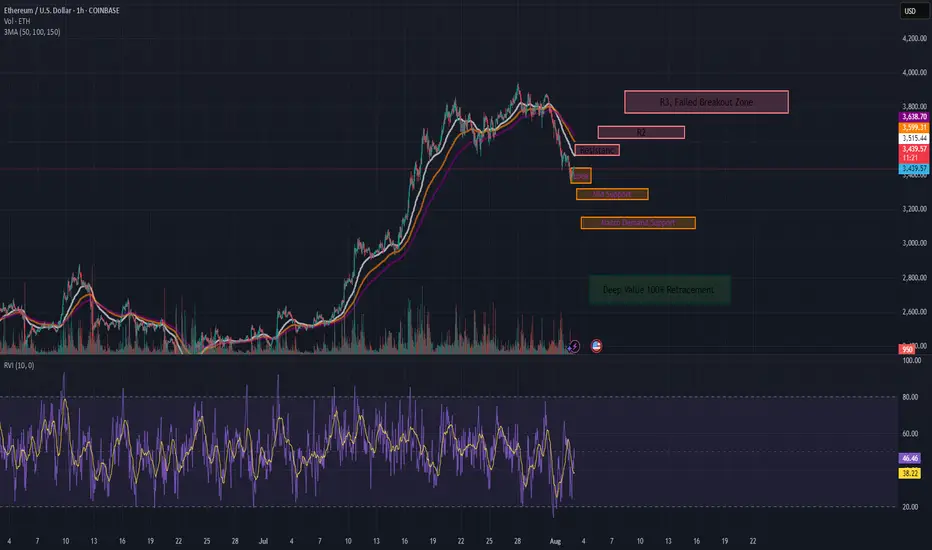
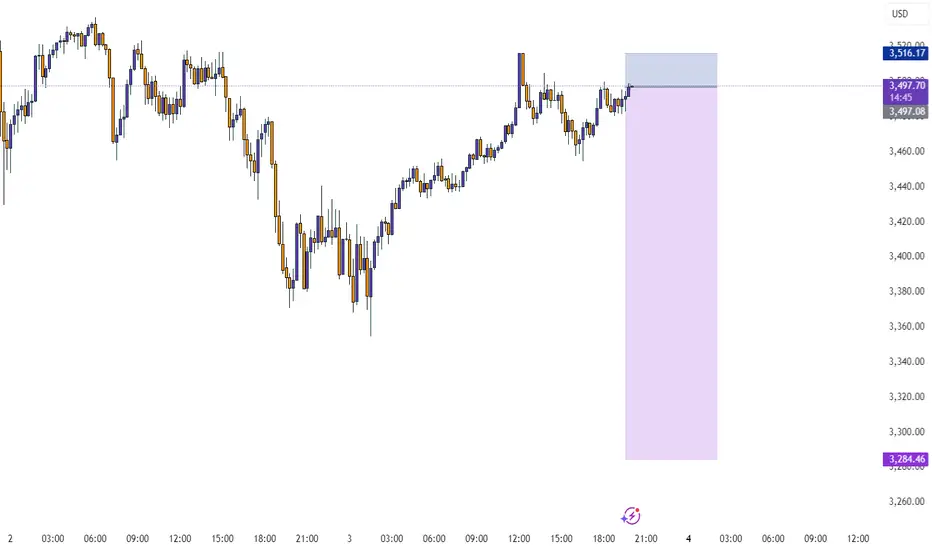
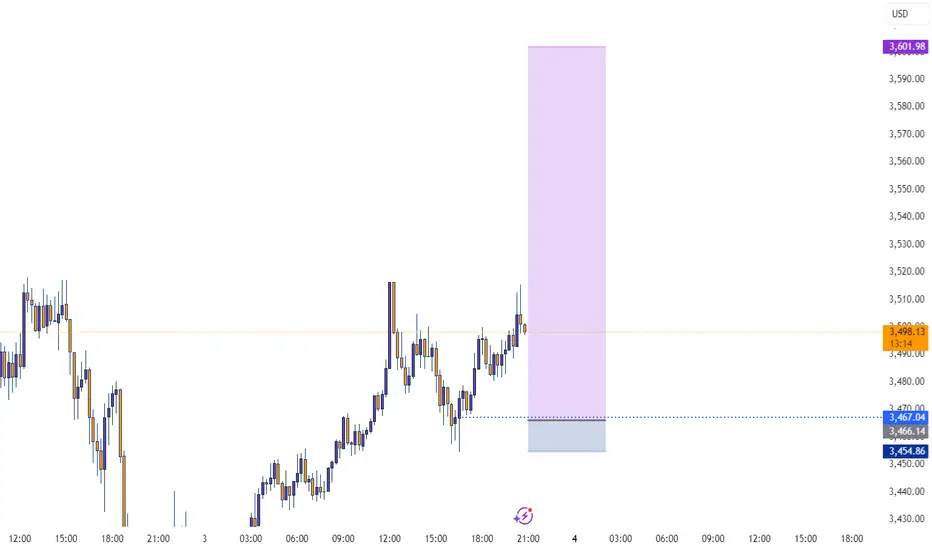
ETH Tactical Long: Laddered Bounce from Absorption ZoneCOINBASE:ETHUSD has been in a steady 1H downtrend, but key support at $3,440 is showing signs of absorption. Volume is thinning on sell-offs, and we're seeing early reversion signals.
This is my over the weekend analysis, not a final recommendation.
Setup Type: Mean Reversion / Absorption Bounce
- Trend: Still bearish on 1H (below 50/100/150 MAs), but slope compression hints at weakening
momentum
- RVI: Below 50, but curling up → early bounce bias
- Volume: Sellers fading into $3,440 = buyer absorption zone
📊 1hr Quant Entry Levels & Laddered Plan
Zone Type Action
$3,440–3,435 Primary Entry Base long entry zone 🔄
$3,420–3,410 Add-on Entry Optional bid stack 🧱
$3,320 Soft Invalidation Trend continuation if lost 🚫
$3,150 Deep Value Wick Low-prob, high-juice trap 💎
🎯 Targets:
T1: $3,515 → EMA cluster rejection zone
T2: $3,600–3,638 → Range midpoint
T3: $3,800 → Trend reversal if reclaimed
⚖️ Risk/Reward: 1:2.5+ (depends on fill ladder)
We are starting entries here, but be cautious if we break through our support levels and you don't have the appetite for the deep value range it may be wiser to wait for a confirming trend or post.
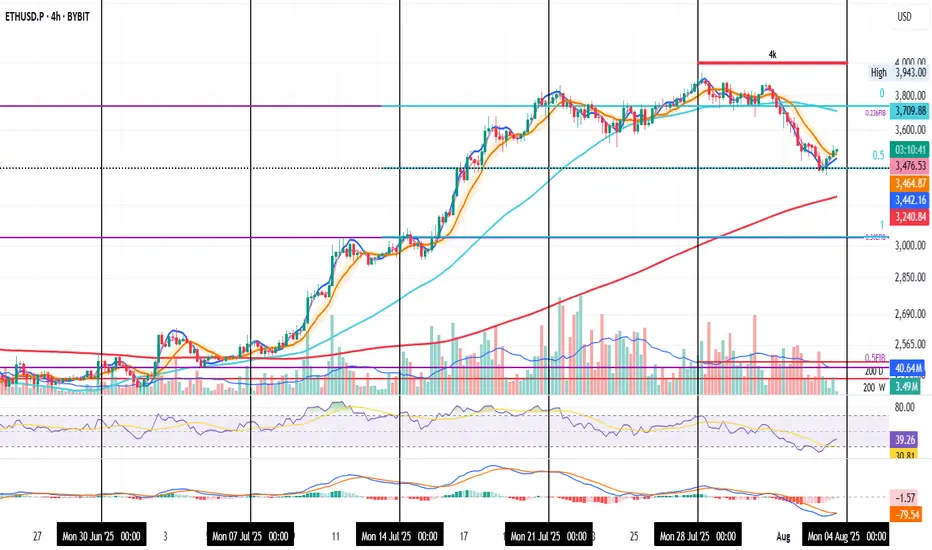
ETH Gears Up Again
ETH on the 4H is confirming the uptrend
MLR > SMA > BB Center — trend structure is bullish
PSAR has flipped bullish
RSI has plenty of room to run
MACD has turned green
Next resistance: 0.236 Fib and the 50MA.
On the macro side:
• Fed chair replacement talks
• Slower job numbers
• CFTC launching “Crypto Sprint”
Momentum is building. We’ll be here to watch it unfold.
Always take profits and manage risk.
Interaction is welcome.

Testing $3,500 Support, Rebound Ahead?Instrument: ETHUSD
Timeframe: Daily
Date: August 4, 2025
Analysis:
ETH fell 7.9% to $3,500 from $3,800, testing support after failing to break its high. The hawkish FOMC and rising BTC.D (62%) pressured altcoins. I entered the dip on $3,500, as shared on X and my previous report
Chart Setup:
Support: $3,500
Resistance: $3,600, $3,800

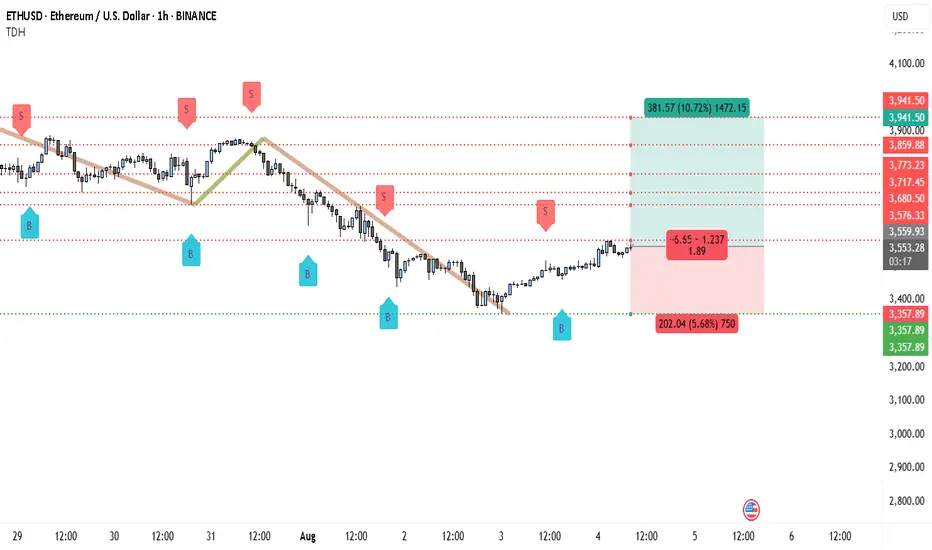
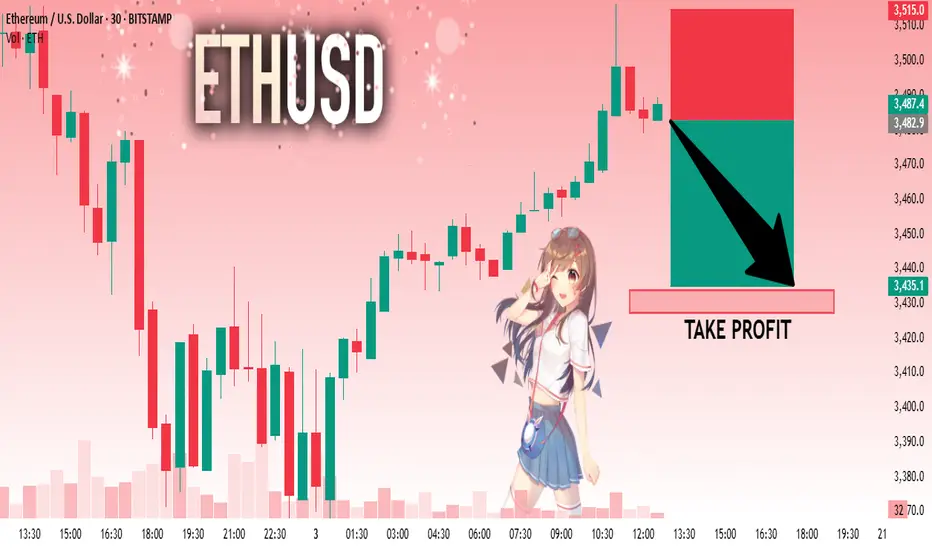
Ethereum’s 1H Chart Screams Breakout — Next Stop $3,941?Ethereum has recently broken above a short-term descending trendline that had been guiding the market lower over the past sessions. This breakout occurred after price formed a strong base around the $3,357 support zone, indicating that sellers were losing momentum. The “B” buy signals printed near these lows further strengthen the bullish outlook.
The immediate resistance lies around $3,559, which is the level price is currently approaching. If buyers can maintain momentum above this area, the next upside targets are $3,576, $3,680, $3,717, and $3,773. The major resistance and projected take-profit area is near $3,941.
From a structural standpoint, the shift from lower lows to higher lows suggests that the short-term trend may be reversing in favor of buyers. This aligns with the increased buying volume observed after the breakout, hinting at potential follow-through in the next London or New York session.
Trading Setup
• Entry: Around $3,553 after breakout confirmation
• Stop-loss: Below $3,357
• Take-profit 1: $3,680
• Take-profit 2: $3,773
• Final Target: $3,941
• Risk-Reward: Approximately 1.89:1
ETHUSD – Holding the LineETH is flirting with breakout mode, reclaiming its 200 SMA at $3,477 and pushing to $3,569. RSI is recovering from a dip and regaining upside pressure. Momentum holds above $3,525.

ETH: Ready to ride a powerful long-term wave from the bottomETH: Ready to ride a powerful long-term wave from the bottom
.
A necessary backtesting phase — to take profits, to rest, to strengthen the trend, to assess supply and demand, and to accumulate more positions in preparation for a long-term move... So, is a correction a risk or an opportunity?
.
US STOCKS- WALL STREET DREAM- LET'S THE MARKET SPEAK!

ETH: VOLANX Pattern Projector Predicts 10K by 2030. It's 2025!Notes:
Multi-Timeframe Liquidity Reaction Framework
Define Your Timeframes
Higher-TF (Daily / 4-hour)
Map major liquidity zones (daily highs/lows, order-block clusters).
Note structural breaks and fair-value gaps around $3,200–$3,300 and $3,800–$4,000 (Murphy, 1999).
Mid-TF (1-hour)
Observe zone tests: wick‐rejections, two‐bar reversals, volume spikes.
Tag each test as “acceptance” (close within zone) or “rejection” (long wick through zone) (Bulkowski, 2008).
Lower-TF (15-/5-minute)
Fine-tune entries: look for micro-order-blocks, VWAP pullbacks, or oscillators divergences immediately post-test.
Set Up Your Research Template
Zone (TF) Date/Time Price Level Test Type Volume %Δ Next Move (pips / %) Notes
Daily Highs (D) 2025-08-03 07:00 $3,800 Rejection +45% +2.5% ↑ Bearish wick test
Order Block (4H) 2025-08-02 16:00 $3,250 Acceptance +30% +1.8% ↑ Smooth retest
… … … … … … …
Measure & Analyze
Wick Length vs. Zone Width: Wick ≥ 50% zone width → higher-prob rejection.
Volume Delta: Spike > 30% above 20-period average → institutional activity.
Post-Test Trend: Record 1-bar, 3-bar, and 6-bar returns after zone interaction.
Iterate & Refine
Review which zones yield reliable continuations versus false breaks.
Adjust zone boundaries (expand/contract by ATR) based on statistical edge.
Incorporate into your DSS for automated alerts when high-prob setups appear.
“By systematically logging zone interactions and subsequent moves, you’ll quantify which liquidity tests offer the best risk-reward and tune your entries for optimal efficiency.”
References
Bulkowski, T. N. (2008). Encyclopedia of candlestick charts. John Wiley & Sons.
Murphy, J. J. (1999). Technical analysis of the financial markets. New York Institute of Finance.
ETH/USD: Legacy coin. Let's see what we get in the hrly, I plan to study the move and make my decision.

ETHUSD: How I see 15 min chart. Technical Context
Price completed a 5-wave decline into Wave 4 support at $3,246 (1.236 Fib extension of Wave 3) within a rising pitchfork channel
Expect a multi-leg accumulation between the orange lower pitchfork line and the red median line before resuming the up-trend
Accumulation Trajectory
Initial Leg: Bounce off $3,246 → rally to $3,563 (0.618 Fib of the entire drop)
Secondary Pullback: Retrace toward the orange trendline (~$3,400)
Subsequent Rallies: Series of higher lows along orange support, testing channel median at ~$3,600–3,650
Final Shakeout: Quick flush toward $3,300–3,350 to clear weak hands before impulsive leg
Intraday Trade Plan
Entry Zones
Tier 1: Near $3,260–3,280 (first swing low)
Tier 2: Along orange rising support (~$3,350 on strength)
Targets
Partial at $3,563 (0.618 retracement)
Full exit near red median line (~$3,625–3,650)
Stop-Loss
Below $3,230 (just under accumulation low)
Position Sizing
Risk ≤ 0.5% of account per leg; scale in on confirmation candles
“Fear in China might prompt a sell-off; use these dips to accumulate for the next impulsive wave.”
References
Murphy, J. J. (1999). Technical analysis of the financial markets. New York, NY: New York Institute of Finance.
Prechter, R. R., & Frost, A. J. (2005). Elliott wave principle: Key to market behavior (10th ed.). New Classics Library.

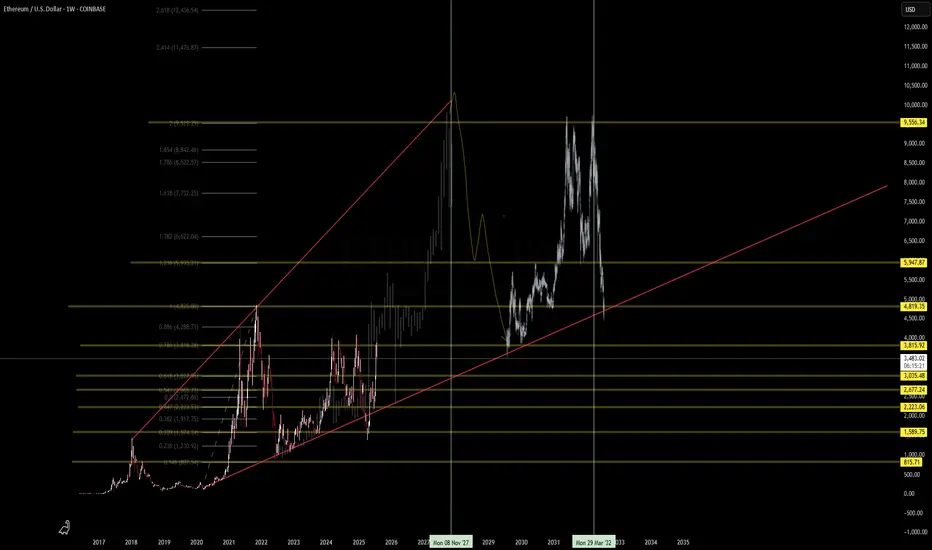
ETH/USD: Now I will architect a strat to run my HFT. Macro Thesis
BTC & ETH “side by side” since 2017–18; both stalled in a multi-year base
Renewed institutional inflows & Fed policy divergence set the stage for a parabolic squeeze
If BTC can trade toward $100 K as a store-of-value, ETH has clear path to $50 K
Technical Setup
Key Resistance: Descending trendline at $3,800–4,000
Confluence Support: $3,200–3,300 (0.618 Fib + rising trendline)
Momentum: Daily close above $3,800 triggers acceleration
Trade Plan
Entry: Break & retest above $3,800
Targets:
T1: $5,000 (round number + regression line)
T2: $10,000 (psychological) ⇨ ultimate stretch T3: $50,000
Stop-Loss: $3,100 (below 0.618 Fib zone)
Risk Management: 1% per trade; adjust with DSS signals
Note: ETH is a new asset class for me; DSS will filter optimal entries and sizing. Always watch macro drivers before committing.
#Ethereum #CryptoMacro #TradingView #SmartMoneyConcepts #VolanX #DSS

ETH/USD: We in? Not yet!Macro
FOMC held rates at 4.25–4.50% for the fifth consecutive meeting, stressing a data-dependent stance amid mixed economic signals (Reuters, 2025a).
White House to publish a pro-crypto policy report, signaling potential regulatory clarity and institutional inflows ahead (Reuters, 2025b).
Ether has doubled over the past three months and gained 4.5% in the last week, reflecting strong momentum and market breadth (Reuters, 2025c).
Risk Management
Stop-loss: Below key support at 3,237 (0.618 Fib + trendline confluence).
Position sizing: Risk ≤ 1% of account equity per trade.
Risk/Reward:
Target 1: 4,372 (1.236 Fib) → RR ≈ 1.5
Target 2: 5,080 (regression line projection) → RR ≈ 2.5
Trade Setup
Entry: On a daily close above the ascending trendline near 3,400–3,500 with bullish confirmation (e.g., hammer or engulfing candle).
Targets:
Partial profit at 4,372 (1.236 Fib)
Full exit at 5,080 (regression line)
Stop-loss: 3,200–3,230 zone (below 0.618 Fib).
Sentiment Filter: “Here or no trade” — only engage if price respects confluence support.

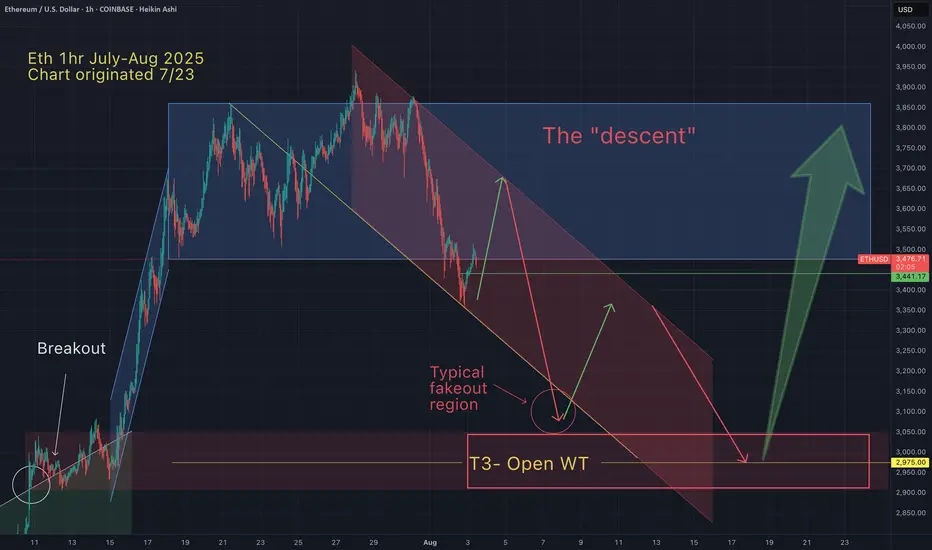
Eth - An aticipated path of continued downward price actionThis is just a thought eperiment based on years of watching patterns repeat.
I like to anticipate price action so I know if/when my trading ideas are being invalidated.
Regardless of the actual path downward, I'm still holding out for $3K or less.
May the trends be with you.
Potential 4H Head and shouldersA potential h&s could be shaping, the daily trend is down but the weekly chart is looking for support.

ETH 4H Mid-Zone BounceETH on the 4H
ETH found support right at the midpoint between the 0.382 and 0.236 Fib levels — exactly at yesterday’s close.
Price closed above the BB center, and the SMA is also holding above it — early signs of recovery.
RSI formed a double bottom in the oversold zone and has now crossed above its moving average.
MACD is about to flip bullish.
I remain bullish and still holding my long, but with tight risk management.
Always take profits and manage risk.
Interaction is welcome.
ETHUSD: Absolute Price Collapse Ahead! Short!
My dear friends,
Today we will analyse ETHUSD together☺️
The price is near a wide key level
and the pair is approaching a significant decision level of 3,482.9 Therefore, a strong bearish reaction here could determine the next move down.We will watch for a confirmation candle, and then target the next key level of 3,433.9..Recommend Stop-loss is beyond the current level.
❤️Sending you lots of Love and Hugs❤️
Using my PAR indicator for swings Using my PAR indicator for swings - Watching multiple time frames squeeze together to get the best trades.
