ETH Derivatives Indicate Bearish Sentiment
A closer look at Ethereum's derivatives landscape reveals growing caution in the market. The 25-delta risk reversals on ETH options for August and September are trading between -2% and -7%, signaling a rising demand for downside protection. In comparison, BTC's risk reversals sit at a milder -1% to -2.5%.
Futures data adds to the picture: ETH open interest is at $47.5B, but key exchanges like Bitget and Hyperliquid show significant drops in long/short ratios (-9.08% and -9.35%). Meanwhile, Binance maintains a relatively low long/short ratio at 0.39, reflecting increasing short interest.
Despite ETH’s impressive 48% rally in July, recent price action has weakened, down 6% in 24h. This divergence between spot price behavior and derivatives sentiment may point to an upcoming correction.
⚠️ Worth watching closely: A break below $3,500 could trigger a sharper unwind of bullish positioning.
ETHUSD.PI trade ideas

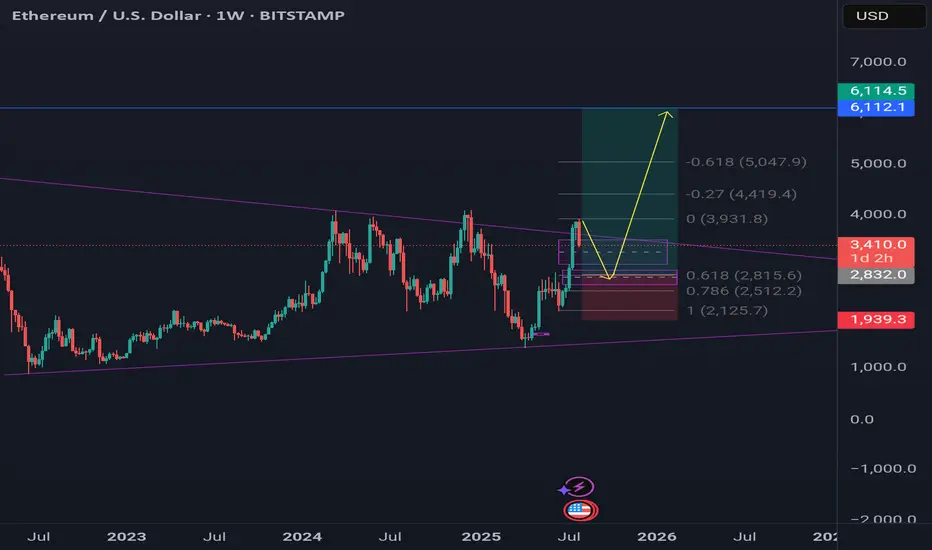
Bullish ETH, 4k on the wayNFA.
I`m very bullish here.
Consolidation likely till 5-6th august.
Run to 4k 11-20th august.
Good luck!

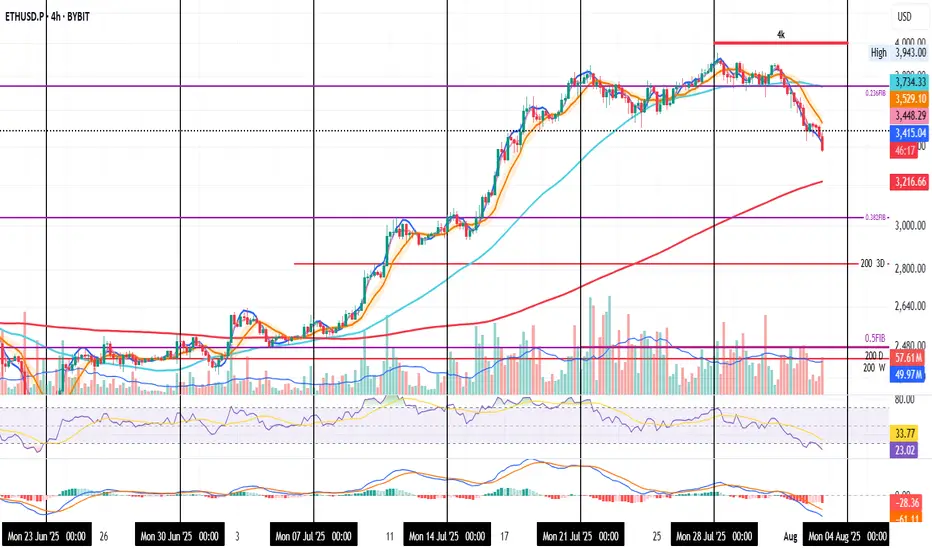
ETH Faces Sharp Rejection at Triangle Resistance📆 On the 3D chart, CRYPTOCAP:ETH just got rejected from the upper boundary of a symmetrical triangle — a clear resistance reaction ❌
That rejection triggered a swift 14% drop 📉, putting pressure back on lower support zones. The structure remains valid, but bulls need to step in soon to avoid deeper losses.
This is a critical spot — will buyers defend the level, or does ETH have more room to slide?
👀 All eyes on support now — next move could be fast.
Not financial advice.

Strategic Long Position on Ethereum (ETH)
Ethereum's funding rates have spiked, reflecting an overcrowded long side. Such conditions often precede a long squeeze, as the market seeks to shake out overleveraged traders.
Despite this risk, the current bullish momentum justifies a tiered entry approach:
First Entry (Market Order): 3,790
Second Entry (Limit Order): 3,550
🛑 Stop Loss (for both entries): 3,400
🎯 Take Profit Target: 4,200
This setup allows participation in the upward trend while leaving room

ETH/USD – Critical Reversal Zone?
### 🚀 ETH/USD – Critical Reversal Zone?
**🔍 ETH Futures Multi-Model Signal | Consensus: LONG | Confidence: 77%**
---
**🧠 Key Highlights (DS + OA Model Consensus):**
* **Price:** \$3,375 → Trading *below* EMA9/SMA20 = short-term bearish, but hitting strong **support zone**
* **Support:** \$3,248 (Bollinger Lower) & \$2,987 (SMA50)
* **Resistance:** \$3,487 (EMA21), \$3,620 (SMA20)
* **Volume:** -10.3% (5D) → Selling **weakening**
* **RSI:** 49.5 → Neutral but oversold on short-term
* **MACD:** Bearish crossover, but showing **divergence**
* **Volatility:** Bollinger width 9.18% = **Breakout Setup**
---
### 📈 Trade Setup – Conditional LONG
| Entry | Stop Loss | Target | R/R | Confidence |
| ------- | --------- | ------- | ------ | ---------- |
| \$3,375 | \$3,229 | \$3,690 | 1:3.24 | 77% ✅ |
🪙 **Trade Type:** Scale-in (50% @ \$3,375, 50% @ \$3,275)
📊 **Take Profits:**
* TP1: \$3,485 (EMA21)
* TP2: \$3,590 (SMA20)
* TP3: \$3,690 (Weekly VWAP Anchor)
---
### ⚠️ Risk Dashboard
* 🚨 BTC < \$58K → Setup invalid
* 📉 No Open Interest Data – monitor liquidation triggers
* 🧠 Max Position Risk: **1.25%** | Use hard stop-loss
* ⏰ Entry Timing: **London Open (8:00 GMT)**
---
### 💬 TL;DR
ETH is sitting in a **high-confluence reversal zone**. Weak sell volume, macro bullish trend, and volatility contraction signal a potential bounce. 📊 **Risk-defined long** setup favored by both models.
🧠 “Smart money doesn’t chase — it positions early.”
---
📌 **#ETH #CryptoTrading #ETHUSDT #Futures #BreakoutSetup #BollingerBands #MACD #RSI #DeFi #Ethereum #CryptoSignals #TradingView**

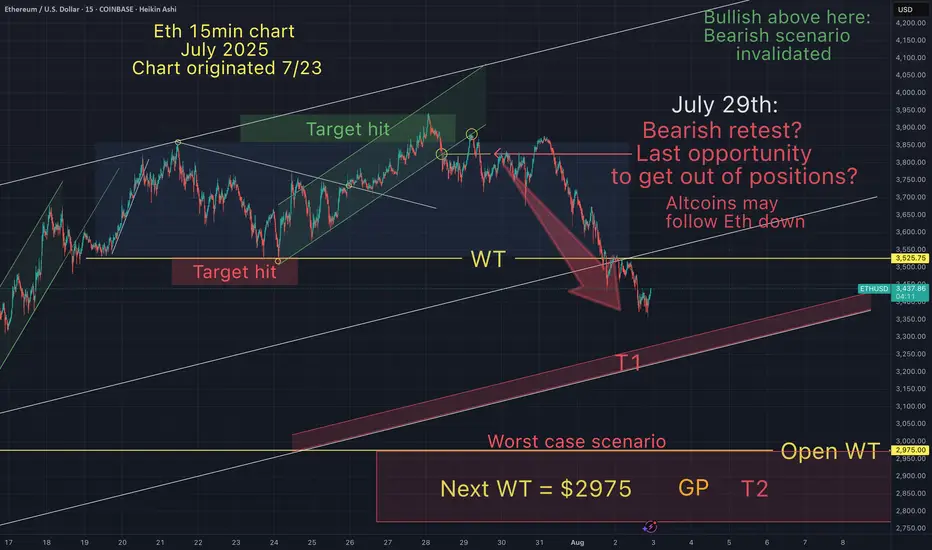
Eth - The descent confirmed. Next target is lower.Recap
-------
On my July 23rd chart I wrote:
"In a bull market the average retrace is between .2 -.4 Fib from the bottom of that run.
Several factors of confluence lead me to believe Eth will hit my red T1 target, bounce to the top of current range (green T1) then drop to a minimum of .35 Fib = $2990".
On July 28th I wrote:
"As anticipated, my bearish T1 target (red) was hit soon after I first posted this chart on July 23rd 2025.
As the arrow indicated, Eth would bounce from my bearish T1 (red) to my bullish T1 (green). This has been confirmed in both price and in the timeframe indicated by my boxes.
There was also a downward arrow from my green T1 pointing towards my bearish T2 (red). Eth is already retracing from my top target, and I belive it will now continue down the red channel towards T2 and possibly T3 (between $2990 - $3200)".
On July 29th on the chart titled "Has Eth begun it's descent?", I wrote:
"On July 23rd, I anticipated that Eth would dump once it took out the range high.
Now that we have witnessed that, along with a bearish retest (as indicated on chart),
I believe the descent has begun. I hope I'm wrong.
But if I'm right, it will provide me with an amazing entry point around $2900-3200"
Aug 2nd:
Eth has crashed 15%. The descent has begun.
might be going insanebasically ive been thinking way too much and i am trying to be in set and forget mode because i think this is what happens

ETHER send it higher and higher and higher.Ether is not going anywhere without makin a new all time high.
Soon 6k ether and even 10k .
The sleeping giant is waking up and when it fully awakes ,it will obliterate everyone.
ETH 4H | Eyes on Support |ETH on the 4H
Bears are having their moment — and that’s fine.
Price is heading lower, with the 200MA around $3200 as the next support. If that breaks, the 0.382 Fib near $3000 is the last line before things get ugly.
My plan? Watch RSI for signs of bullish divergence.
Until then, hold tight.
Always take profits and manage risk.
Interaction is welcome.
ETH/USD Double Bottom with Bullish RSI Divergence 1HETH/USD has formed a double bottom pattern on the 1 -hour timeframe , signaling a potential bullish reversal after recent downside pressure. The pattern is supported by a bullish RSI divergence, where price made lower lows but RSI printed higher lows — indicating a momentum shift.
A buy stop entry is placed just above the neckline, targeting a continuation toward key resistance zones.
Trade Setup
Buy Stop Entry: 3539.52 (on confirmed neckline breakout)
Stop Loss: 3424.13 (below second bottom – invalidation level)
Take Profit 1: 3658.19
Take Profit 2: 3774.71

Ethusd $2500 I suspect may be the last dipTechnical analysis on ethusd .
Whilst everyone is bullish from current level, my technicals is telling me $2500 region which is key for upward movement or a break makes it want to go lowet

Ethereum Breakdown Imminent: Bearish Triple Tops confirmedEthereum has fired off multiple bearish signals that traders and investors cannot ignore. A confirmed triple top on the daily chart suggests exhaustion at resistance, while the appearance of a hanging man candlestick pattern adds weight to the reversal thesis.
The daily RSI has confirmed a bearish divergence, and the MACD has officially crossed below the zero line—marking a shift in momentum and confirming bearish control.
In this video, I’ll break down:
• The triple top formation and its implications
• Why the 200 EMA is the next major support target
• The significance of RSI and MACD confirmations
• What traders should watch for in the coming sessions
This isn’t just noise—Ethereum’s technicals are flashing red. Make sure you’re prepared.

ETHUSD The Week Ahead Key Support and Resistance Levels
Resistance Level 1: 3677
Resistance Level 2: 3752
Resistance Level 3: 3833
Support Level 1: 3485
Support Level 2: 3400
Support Level 3: 3316
This communication is for informational purposes only and should not be viewed as any form of recommendation as to a particular course of action or as investment advice. It is not intended as an offer or solicitation for the purchase or sale of any financial instrument or as an official confirmation of any transaction. Opinions, estimates and assumptions expressed herein are made as of the date of this communication and are subject to change without notice. This communication has been prepared based upon information, including market prices, data and other information, believed to be reliable; however, Trade Nation does not warrant its completeness or accuracy. All market prices and market data contained in or attached to this communication are indicative and subject to change without notice.

ETH VS AI?Hi
Asked AI on the next movement ETH
Predicted Target = 4 847
Time Projection 20 days → 15 Aug 2025
Probability (%) Attenuation × 100 = 183.6 %
Variance vs. Today (Target) 4 847 − 3 507 = 1 340
Projected Retracement Price 3 886 − 599 = 3 287
Variance vs. Today (Retrace) 3 287 − 3 507 = −220
All the best
Caveat emptor
Not a guru

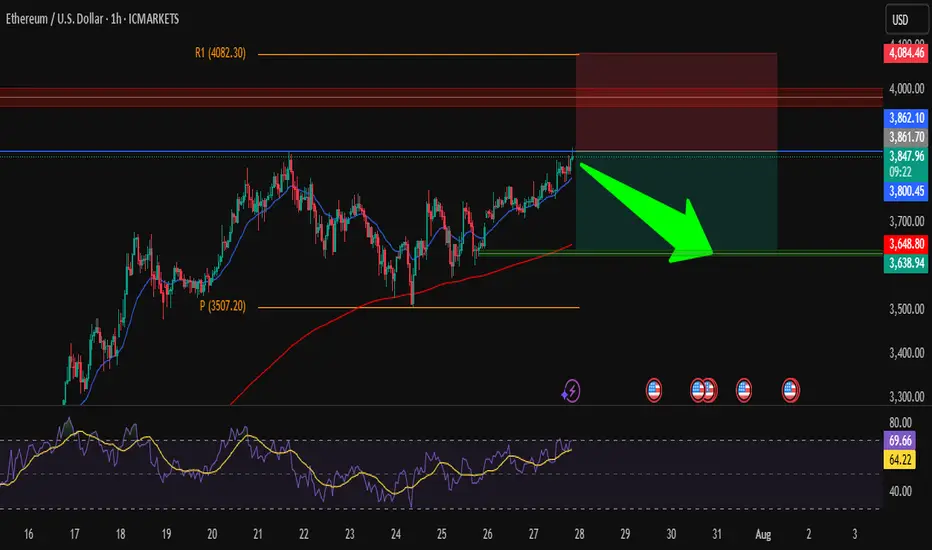
ETH/USD – Short from ResistanceHi traders ! , I opened a short position on ETH/USD as price is hitting a strong resistance zone.
Entry: 3850
SL: 4084.46
TP: 3638.94
📌 Why I took this trade:
Price is testing a strong resistance zone around 3860, RSI is overbought, and we could see a pullback toward the support area around 3640.
Nice risk/reward setup, keeping it simple.
This is just my analysis, not financial advice.
What’s your view — drop or breakout?
ETH BUY SETUP ,Bought From $3830ETH BUY SETUP
Currently $3830
Bought From $3830
(Trading plan If ETH go down ,
to $3700 will add more longs)
Expecting target $3890 OR ABOVE
Stoploss at $3470
In the event of an early exit,
this analysis will be updated.
