ETH - Long - 3880ETHUSD is expected to bounce back from the levels of 2970.
The Crypto has strong support on that level of 2970.
Further support at 2680.
Trade ideas

ETH:USD When bottom?ETH is at a make or break area at the moment. $2870-$2950 is a super major support zone for ETH. If price wants to go down a bit more, then the 0.5 fib level at $2730-$2630 would be another very strong support. The last bit of support would be the golden zone area between $2270 - $2180. Elliott wave perspective, ETH might have come to a spot where no one would complain if it turned around from here. RSI is showing bullish divergence. We can make a case for a full 5 waves for C. If market has other ideas, then this could be a larger wave 3 for a nested 1/2, 1/2. If that is the case, then price might head down to the lower levels mentioned above. But, for now, it does seem like capitulation has taken place, and the sell pressure has peaked. Until price is above at least $4285, it can still be a larger AB with another leg down for C. Ideally, we would want to see another ATH with a complete 5 waves sequence up before we know for sure. My plan is to start nibbling ASAP to add back to my bag with a stop loss. When the sentiment is this bearish, it has always worked out, at least in the short term. If the minor Wave 2 is indeed over, then we should start prepping for massive fireworks. On macro cycle minor wave 3s are the strongest. We'll see how things go, but I am hopeful; until market decides to throw dirt in my eyes!

ETH/USD (1H timeframe) ...ETH/USD (1H timeframe) on Coinbase, and it’s clearly showing a raisin trendline test with two downside “Target Points” already drawn. Let’s break it down:
---
🔍 Chart Analysis
Price is $3,441, sitting right on the ascending trendline.
Ichimoku Cloud is turning bearish (price below the cloud).
Trendline break looks likely — momentum is weak and candles are closing below the cloud.
Two target zones (downside) are marked on my chart.
---
📉 Bearish Breakdown Scenario
If ETH breaks and closes below the ascending trendline (~$3,440 area):
First Target (TP1): around $3,230 – $3,250
→ This aligns with previous horizontal support and midpoint of the last bounce.
Second Target (TP2): around $3,000 – $3,050
→ This is my deeper support zone — the next strong demand level on the chart.
---
⚠ Invalidation / Stop-Loss
If ETH closes back above $3,520 – $3,540, that would invalidate the bearish move (trendline reclaim + cloud flip).
---
🧭 Trade Summary
Entry (Breakdown): Below 3,440
TP1: 3,240
TP2: 3,020
SL: 3,540

short ethBullish scenario: ETH could reach around $4,600–$4,700 if market conditions stay positive.
Neutral scenario: Price likely moves sideways between $2,300–$3,400.
Bearish scenario: A correction could push ETH down to $1800.

BOUGHT ETHUSD ON $2,750 @ the 61.8% fibo level, i took my bet to long ETHUSD on its heavy correction.
We will need confirmation on daily chart with bullish candle closing, but i tried to take a little bit risk this time.. AIMING AT LEAST $3,200 to $3,300 area..
LET'S GO...

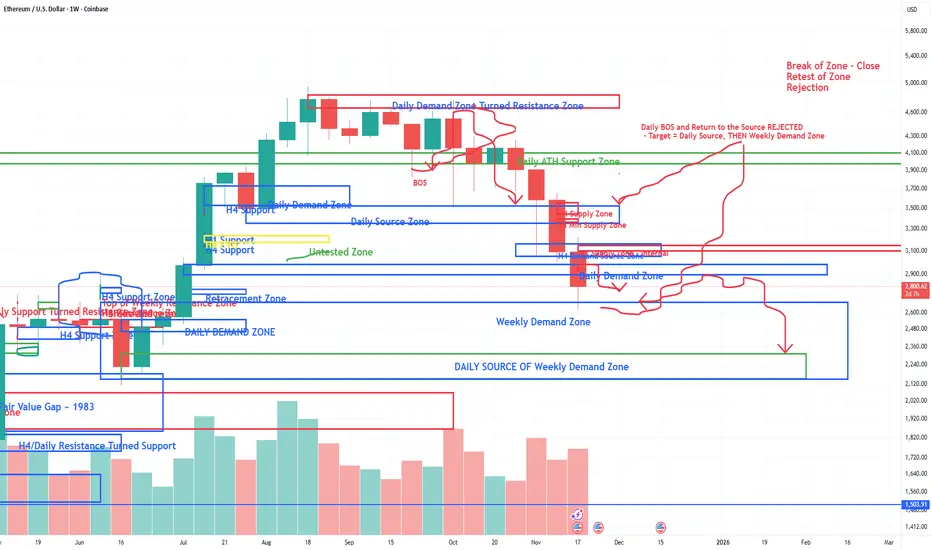
Is the ETH Problem Solved Yet????ETH has traded exactly as expected from this last recent high and break down of structure that followed. Please see my last analysis on ETH from 11/11/25. We have dropped down into this Weekly Demand Zone (2150 - 2680), and are now seeing a bullish response out of it as expected. This response is most likely to pull back up to retest the previous Daily Demand Zone (2900 - 2980) and get Rejected.
The most likely targe of this fall is still to continue to the Daily Source inside of this weekly zone. The problem is that this Weekly Demand Zone was very large, leaving a wide range of buyers in this area. The most concentrated demand will be inside of the Daily Source (2150 - 2314).
This is just the market being the market and following a solid technical analysis structure.
What to look for Next?:
Keep in mind that the overall market is STILL BULLISH. This so called "collapse of the market, flash crash, crypto winter", etc. is only because we extended way too far from the last Weekly Demand Zone. The price of ETH and BTC pushed too far, too fast, and we are only returning to normal market structure. There HAS to be this kind of correction in the market in order to move forward.
So, to resume the bullish case for ETH right now, all we need to see a clear Break of Structure out of this large Weekly Demand Zone on the H4 Time frame. The H4 will be the tell tell sign that the decline is ending. That is most likely to happen within the Daily Source Zone highlighted (2150 - 2314). We need to see a clear H4 Break of the last supply zone and a retest to get out of this 2700 price range area and continue with the overall still bullish trend.
Don't be fooled by these bullish responses right now - we are not ready to go bullish again until we see what I described above. Every other bullish pump right now is a trap, and should be traded accordingly.
Weekly ETH possible fair value locatedIt is possible we going to have a up week. We may entering a bit longer down movement but there are always a relief rally.

ETHUSDT BULLISH MOVE34% pullback fully absorbed at prior breakout level ($2,250–2,300) that flipped to support • Daily EMAs never lost their bullish order — price only wicked below but closed above every day • Volume-backed reclaim of the entire ribbon today This is exactly how trending markets reset without breaking. Higher-timeframe bull market still 100% intact as long as $2,250 holds.
CRYPTOCAP:ETH BINANCE:ETHUSDT BITSTAMP:ETHUSD

Is The Crypto Bull Market Over?!Follow me on X! @Trdr_Alchemist
Over $1B in liquidations on BTC alone, extreme fear across the market, and everyone suddenly calling for the end of the bull market. But this move may be exactly what we needed.
The weekly close is VITAL for us down here. I like what I am seeing, and this could be the biggest sign for us.
⚠️ Disclaimer:
I am not a financial advisor. The content shared on this channel is for educational and informational purposes only and should not be considered financial advice.
Trading and investing in cryptocurrency involve high risk — you could lose some, or all, of your money. Always do your own research and make sure you understand the risks before making any financial decisions.

ETHUSD – Bearish Channel Respect, Flag Breakdown SetupHi
The chart illustrates a clean, structured bearish trend where price continues to respect a broad descending channel. Each major reaction level and pattern aligns well with the larger downtrend, indicating that sellers are still in control.
Price recently tapped a key flip area near the upper boundary of the channel, a crucial zone where previous support has turned into resistance. The rejection from this area confirmed a strong supply and initiated a sharp decline, marked on the chart as the flagpole.
Following the impulse drop, the market entered a consolidation range, forming a classic bear flag structure. Price corrected roughly one-third of the flagpole; a typical retracement depth before continuation in a downtrend.
The drawn projection suggests a bearish continuation from the consolidation box, with the price expected to break lower. If momentum follows the channel’s trajectory, ETH could descend toward the first S&D zone, which aligns with the lower boundary of the macro channel. The marked target around 2848 sits near a liquidity and demand cluster, making it a logical tap point before any significant reversal or larger breakout attempt.
Disclaimer: As part of ThinkMarkets’ Influencer Program, I am sponsored to share and publish their charts in my analysis.


Opportunities for market growth at the end of the yearToday we have reached a new major bifurcation point in the middle of the quarter, which I have focused on. For individual coins, starting in the middle of this week, the probability of a bullish quarterly candle reversal with large growth waves will increase, similar to RESOLV and TNSR. Such reversals will be facilitated by a slowdown in the fall of ETH with attempts to change the trend before the end of the year.
So far, the bearish influence has prevailed in the market, with the opening of most major periods below key resistances and stable sales until the middle of the quarter to consolidate below 3,500, which I will indicate in the latest review. The ultimate goal of the bears in this quarter is to test the range of 2500-2750, with an attempt to close the annual candle in it under a negative scenario, and against the background of consolidation below 3500, this goal is still relevant. By the end of the month, we may still see new sales impulses to break through 2750, but with increasing buying activity at the end of each week, against which individual coins will try to grow. The second half of the quarter for ETH opened below 3,250, which gives a signal for sales below 3,000 up to 2,500, but an opening above 3,100 is a technical signal for growth up to 3,500-4,100. The attempt to reverse the quarterly candle is also facilitated by its opening above 4,100.
And so, under an optimistic scenario and a stable transition to a reversal of the quarterly candle in the second half of the week, purchases can be expected until the end of the week, with the aim of opening a new week above 3250, which will ensure continued growth until the end of the month and the possibility of opening a new month with a growth signal before the end of the year. With less volatility, there is a chance of opening a new week below 3,100, which could lead to a reversal next week.
As I wrote in a review at the beginning of October, BTC opened the quarter negatively, with a pullback signal down to 90-100 k, which the bears successfully worked out. There is a large medium-term support in the 85-90k zone, from which a pullback is likely. In addition to the growth of the altcoin index and the growth of ETH/BTC, which I expect at the turn of the quarter, the slowdown in the decline of BTC will also cease to put pressure on the market and allow individual coins to show major reversals.
Brent may once again have quite a big impact on the markets. If today and tomorrow the price fixes above $ 64 and, moreover, above $ 65, then the probability of growth of the crypt will prevail until the close of the week. In the event of US manipulation and a sudden new wave of brent sales below $62.5 today or tomorrow, there will be a chance for an ETH reversal before the weekend. Given the released data on stocks in the United States, the probability of a positive scenario prevails. All markets are connected, and no matter how absurd it may seem at first glance, it was the background manipulation of the commodity price that allowed the bears to break through key supports on ETH more than once, both on October 10 at 4,100, and at the subsequent 3,500, 3,250 and 3,100. By superimposing the dynamics of brent in the second half of the week on the dynamics of ETH by the weekend, you can see a chain reaction. That is why by the second half of October, I predicted a drop down to 3,500 by the end of the week, in the event of a drawdown of brent to $ 60.
Against the background of a slowdown in the fall of ETH and attempts to reverse the quarter, it is possible to make regular toppings for individual coins. First of all, it is worth paying attention to TURTLE and MITO, which have strong technical signals for growth up to 0.21-25 in the medium term. So the potential is the ground for dynamics similar to RESOLV. VIC BMT HOOK CHESS also has slightly weaker technical signals for growth, which I am also considering working with in the first place. On an attempt to reverse the quarter, there is a high probability of their growth to 50-70%, at least with the aim of breaking the last monthly candle. In the case of a stable ETH reversal, growth impulses of up to 200%+ can be expected.
Similarly, growth waves of up to 40-50% may show weaker instruments that do not have obvious signals, but are in an extremely oversold zone, such as QUICK COS FIO DATA. In my opinion, these tools are candidates for the assignment of the monitoring tag, given the dynamics, and therefore I recommend using a small position when working with them.
In addition to the positive note towards the end of the year that has appeared at the moment, I would like to focus on the overall negative dynamics of the market, which may continue at the beginning of the year. The current likely pullback on the quarterly and annual candles is still a temporary phenomenon and gives opportunities to coins that have technical growth signals left earlier. Most of the market, after attempts to roll back the tops at the turn of the year, is likely to continue falling until the second quarter. That is, coins without obvious growth signals, especially those with large capitalization, may remain flat until January or February without significant purchases followed by a major break.

BottomETH finally throwing down into both horizontal support and poking through channel support (typical shakeout). RSI in oversold territory. Looking for a large bounce within the channel and breakout shortly after
- QT ends Dec 1
- More rate cuts + Fed chair announcement
- Federal govt reopened
- Clarity Act passing soon

ETHUSD - Further Bearish Scenario A double top scenario between last bull runs peak and the current action seen is an idea that ive come across.
Price may not go up at all and retest the dotted line in red in a bearish action
I dont expect this as much as I expect the occurrence of a late altcoin bull run.
Weekly chart

ETHUSD - Log Band IndicatorIndicator shows that the top band is being tested
Places in circles are of similar movement, both containing a retest of this line
I still believe in an alt szn
Weekly chart

ETH BUY?Market Overview:
The overall trend remains bullish on both the daily and weekly timeframes.
Daily Outlook:
On the Daily timeframe, the market appears to be forming a potential reversal pattern, indicating a possible continuation of the broader bullish move. Should the current support level hold, we could see buyers gaining momentum and pushing prices higher.
Disclaimer:
Please be advised that the information presented on TradingView is solely intended for educational and informational purposes only.The analysis provided is based on my own view of the market. Please be reminded that you are solely responsible for the trading decisions on your account.
High-Risk Warning
Trading in foreign exchange on margin entails high risk and is not suitable for all investors. Past performance does not guarantee future results. In this case, the high degree of leverage can act both against you and in your favor

ETH: Might have another chance to long!Hello Traders .
okay, this was the volume profile of ETH of the Binance! Any reaction to it could activate our buy option!

Crypto Dump Explained: My Downside Targets + Reversal ZonesToday’s video breaks down why the crypto market is dropping and why this move is not the start of a bear market. We just had mixed U.S. employment data (NFP, unemployment, job growth), and despite some numbers being positive, the uncertainty has triggered fear across the market.
But this is exactly what I’ve been talking about…
Fear = liquidity.
Confusion = opportunity.
This drop may be the final shakeout before the next major upside move.
In this video I cover:
- The real macro reasons behind the dump
- Why this move strengthens my bullish outlook
- Full breakdown of BTC downside targets
- TOTAL market cap analysis
- ETH key levels and reversal zones
⚠️ Disclaimer:
I am not a financial advisor. The content shared on this channel is for educational and informational purposes only and should not be considered financial advice.
Trading and investing in cryptocurrency involve high risk — you could lose some, or all, of your money. Always do your own research and make sure you understand the risks before making any financial decisions.

ETHUSD: Outlook for the Upcoming DaysMonthly View:
The monthly timeframe remains bullish overall, but ETH has pulled back to gather strength. This kind of move is typical when the market is gearing up to break a higher high. The broader structure hasn’t shifted—this is simply a deeper retracement inside a bullish narrative.
Weekly View:
The weekly chart is showing a similar story. Price has been dropping consistently without giving even a single proper reversal. If ETH truly wanted to fall aggressively, it would normally make a move up first, trigger traders’ stop-losses near previous highs, and then dump. But this time, it didn’t do that.
This unusual behavior hints that the market may be preparing something different from what most traders expect.
Daily View:
The daily timeframe is where things get really interesting. ETH spent more than half the recent sessions moving sideways, collecting liquidity on both sides. After that, it dipped and formed a lower high—but that lower high hasn’t been broken yet.
According to my analysis, ETH is currently sitting in the Discount Zone, an area where buyers often start becoming active.
4-Hour View:
On the 4H chart, I already had a clean short setup earlier, but now I’m watching for signs of a potential reversal. That reversal idea is not guaranteed, though—it becomes invalid if ETH fails to break the series of lower highs.
There’s also another scenario: ETH might refuse to break the lower highs and begin forming higher lows at the same time. If that happens, we’ll see a period of sideways consolidation. When the breakout finally comes—whichever direction it chooses—the move is likely to be powerful.
Final Thoughts:
Based on my analysis, ETH is showing mixed but promising signals across the higher and lower timeframes. The monthly structure is still bullish, and this pullback looks more like preparation for a stronger push rather than a trend reversal. Weekly price action hasn’t shown any meaningful bounce yet, which is unusual—and that alone hints that the market might be setting up something unexpected.
On the daily chart, ETH has swept liquidity after moving sideways for quite a while, and now it’s resting in the Discount Zone, where smart money usually becomes active. The 4H timeframe already gave clean short opportunities earlier, but now the market is approaching a point where a reversal could begin—unless lower highs remain untouched.
If ETH starts forming higher lows without breaking lower highs, the market will likely slip into a compression phase. When price finally breaks out of that squeeze, the move—up or down—can be very strong.
Again, this is just my personal viewpoint. Please do your own analysis before investing. Your profits and losses are entirely your responsibility—I’m only sharing what the charts are suggesting to me right now. Stay alert to the reaction levels ahead; that’s where the next major direction will reveal itself.
----------------------------------------------------------------------------------------------
Thanks for checking out this analysis! If you enjoyed it, hit that follow button so you don’t miss future updates. And if this breakdown helped you out, drop a like 👍 and share your thoughts in the comments 💬—I always appreciate the feedback!


$ETH Macro planI made this CRYPTOCAP:ETH cheatsheet. I'm looking to bid 2900-2700 area. As you can see we lost the level on weekly timeframe. And retesting it this week. A close below means we will likely go to my marked area.

ETH 4H – Potential Major Accumulation FormingWith recent price action, I am seeing what maybe an accumulation happening on the 4 hour chart, flipping my original bias from redistribution. Price is just above a major Preliminary Support level at $2450 and has been forming a large descending channel/wedge. The most recent down swing responded with a sharp wick, which aligns with the Selling Climax. Price then had an Automatic Reaction and since then has returned with a Secondary Test.
If this is correct, we may be entering Phase B of accumulation, where we can see an Upthrust move before absorption of seller continues below.
Why This Looks Like Accumulation
The market is still making lower lows in price, but the internal strength is not confirming those lows. This is typical behavior in Accumulation Phase B/C, where supply exhausts while price drifts downward.
Key supporting signals:
1. Delta Behavior
Recent down-legs have shown declining sell delta, meaning sellers are pushing price lower but with noticeably less aggression. This weakening of effort vs. result is a classic precursor to a terminal action such as a Spring or major ST.
2. Dual RSI Divergences
The RSI indicator here is split into two components:
• Purple = Relative Strength of Price
• Teal = Relative Strength of Volume
Across the most recent lows:
• Price made lower lows
• RSI-price made slightly higher highs and higher lows
• RSI-volume showed a mixed but rising structure, making both higher highs and higher lows on the internal swings
This is important because it shows momentum decoupling from price. When both price-strength and volume-strength diverge upward while price drifts downward, it often signals that the market is absorbing supply rather than breaking down structurally.
3. Volume Tapering
Each push lower has occurred on gradually diminishing volume, and even the bearish expansions lack the signature spike you typically see in distribution breaks. This behavior aligns with absorption, not aggressive continuation.

ETHUSD : TRADE IDEAAnother short opportunity is on ETH/USD. On the daily timeframe, price has successfully broken below the support level at 3353.41. The recent upward movement appears to be a temporary pullback before continuing its decline toward the 2747.46 level.
Ensure strong confirmation before acting, and keep an eye on shifts in market structure.
Thanks a lot for your support & best of luck
**My trading strategy is not intended to be a signal. It's a process of learning about market structure and sharpening my trading my skills also for my trade journal**
