ETH 4H – Potential Major Accumulation FormingWith recent price action, I am seeing what maybe an accumulation happening on the 4 hour chart, flipping my original bias from redistribution. Price is just above a major Preliminary Support level at $2450 and has been forming a large descending channel/wedge. The most recent down swing responded with a sharp wick, which aligns with the Selling Climax. Price then had an Automatic Reaction and since then has returned with a Secondary Test.
If this is correct, we may be entering Phase B of accumulation, where we can see an Upthrust move before absorption of seller continues below.
Why This Looks Like Accumulation
The market is still making lower lows in price, but the internal strength is not confirming those lows. This is typical behavior in Accumulation Phase B/C, where supply exhausts while price drifts downward.
Key supporting signals:
1. Delta Behavior
Recent down-legs have shown declining sell delta, meaning sellers are pushing price lower but with noticeably less aggression. This weakening of effort vs. result is a classic precursor to a terminal action such as a Spring or major ST.
2. Dual RSI Divergences
The RSI indicator here is split into two components:
• Purple = Relative Strength of Price
• Teal = Relative Strength of Volume
Across the most recent lows:
• Price made lower lows
• RSI-price made slightly higher highs and higher lows
• RSI-volume showed a mixed but rising structure, making both higher highs and higher lows on the internal swings
This is important because it shows momentum decoupling from price. When both price-strength and volume-strength diverge upward while price drifts downward, it often signals that the market is absorbing supply rather than breaking down structurally.
3. Volume Tapering
Each push lower has occurred on gradually diminishing volume, and even the bearish expansions lack the signature spike you typically see in distribution breaks. This behavior aligns with absorption, not aggressive continuation.
Trade ideas

$ETH Macro planI made this CRYPTOCAP:ETH cheatsheet. I'm looking to bid 2900-2700 area. As you can see we lost the level on weekly timeframe. And retesting it this week. A close below means we will likely go to my marked area.

ETHUSDNote that these analyzes are only for recording personal accounts and journals that will be reviewed in the future.
Please do not enter into any trade just by viewing the analysis, thank you.

ETH going to fill the gapETH is filling the imbalance left, while BTC is in the POI. this could be a reversal point to switch back up

ETH at the Edge! Massive Move ComingBased on your chart, Ethereum is currently sitting right on the lower boundary of the rising blue channel, which is a major decision zone for the next trend.
Bullish Scenario
If ETH holds the lower blue trendline (around $2,400–$2,500):
Bullish Targets
1. $3,200 — mid-channel resistance
2. $3,760 — major structural resistance
3. $4,800 — historical peak & cup-and-handle breakout level
4. $5,500–$6,000 — full bullish channel extension
Confirmation for upside
• Strong reversal candle on the lower channel
• Break & close above the 50-day SMA
Bearish Scenario
If ETH breaks below the lower channel (~$2,400):
Bearish Targets
1. $2,000 — psychological support
2. $1,550 — major previous swing low
3. $1,000–$1,200 — full downside breakdown target
Stop-Loss Recommendation
(To protect against a channel breakdown)
Stop-Loss:
Below $2,350
This is slightly under the lower trendline — if broken, the bullish structure fails.
Trading Plan Summary
• Entry zone: $2,450–$2,600 (channel support region)
• Stop-loss: $2,350
• Take Profit (TP):
• TP1: $3,200
• TP2: $3,760
• TP3: $4,800
• TP4: $5,500–$6,000

2600-2750 Swing levels on ETHSharing this chart incase anyone might be looking for opportunities in the market.
Basic call outs
Distribution at 4954,
Down trend with mechanical pullbacks,
-Tight range forming as it goes lower
-Key Levels - 2750, 2600

ETHUSD H4 | Bearish ContinuationMomentum: Bearish
Price is moving upward toward the identified sell entry, which aligns with the 50% Fibonacci retracement level and remains positioned below the Ichimoku Cloud, supporting a bearish outlook.
Sell Entry: 3,240.22
Overlap resistance
50% Fibonacci retracement
Below the Ichimoku Cloud
Stop Loss: 3,434.25
Overlap resistance
78.6% Fibonacci retracement
Take Profit: 2,907.19
Pullback support
High Risk Investment Warning
Stratos Markets Limited (tradu.com ), Stratos Europe Ltd (tradu.com ):
CFDs are complex instruments and come with a high risk of losing money rapidly due to leverage. 70% of retail investor accounts lose money when trading CFDs with this provider. You should consider whether you understand how CFDs work and whether you can afford to take the high risk of losing your money.
Stratos Global LLC (tradu.com ): Losses can exceed deposits.
Please be advised that the information presented on TradingView is provided to Tradu (‘Company’, ‘we’) by a third-party provider (‘TFA Global Pte Ltd’). Please be reminded that you are solely responsible for the trading decisions on your account. Any information and/or content is intended entirely for research, educational and informational purposes only and does not constitute investment or consultation advice or investment strategy. The information is not tailored to the investment needs of any specific person and therefore does not involve a consideration of any of the investment objectives, financial situation or needs of any viewer that may receive it. Past performance is not a reliable indicator of future results. Actual results may differ materially from those anticipated in forward-looking or past performance statements. We assume no liability as to the accuracy or completeness of any of the information and/or content provided herein and the Company cannot be held responsible for any omission, mistake nor for any loss or damage including without limitation to any loss of profit which may arise from reliance on any information supplied by TFA Global Pte Ltd.

Don't sell your Ethereum !!!CRYPTO:ETHUSD
Based on my analysis of the historical context and the global macro-economy, I believe there is still room for growth. This is particularly true with the upcoming interest rate decision meeting on December 10th, which is anticipated to potentially bring a positive surprise. Furthermore, the end of the government shutdown, which had previously clouded the outcomes, adds to this outlook.
Personally, I see a spark of hope, and this is corroborated by my technical analysis using Elliott Waves. As you can see in the chart analysis, it suggests we still need one final, fifth impulsive wave before a bear market begins.
This is not financial advice, just my personal opinion.

Ethereum – Downside path📉 CRYPTO:ETHUSD is approaching the equal legs area at 2788–2432, which can trigger a daily bounce in the coming weeks.
After that reaction, the market is expected to form another lower high before continuing the downside path toward the previous April lows near 1500.

ETH1. Current Price & Drop
Price: $2,818.1
Daily Change: -$204.5 (-6.77%)
This is a sharp decline, signaling strong bearish momentum.
2. Trend Analysis
The chart shows a long-term ascending channel (blue) and a mid-term descending channel (red).
Ethereum has broken below the midline of the blue channel and is now trading near the lower boundary of the red zone.
This suggests a major trend reversal from bullish to bearish.
3. RSI Indicator
RSI is currently below 30, which indicates oversold conditions.
Historically, oversold levels often lead to short-term bounces, but given the strong downtrend, this could be a bear trap unless confirmed by volume and price action.
4. Volume & Market Sentiment
Volume: 27.22K (high compared to average) → indicates strong selling pressure.
News snippet mentions Ethereum ETF speculation, but despite that, inflows are not supporting price, which means macro sentiment is negative.
5. Key Support & Resistance
Immediate Support: Around $2,800 (current level). If broken, next major support is near $2,500.
Resistance: $3,000–$3,200 zone (previous breakdown area).
6. Risk Factors
Broader crypto market is also down (BTC -5.17%, ETH -6.77%), suggesting systemic weakness.
Possible reasons:
Regulatory uncertainty
ETF hype fading
Liquidity outflows
Short-Term Outlook
Expect high volatility. If $2,800 fails, ETH could test $2,500 quickly.
Oversold RSI might trigger a dead-cat bounce, but trend remains bearish until ETH reclaims $3,000.
Long-Term Outlook
If the price stays below the blue channel, the bullish structure is broken, and we could see a prolonged correction.

ETHEREUM(ETH/USD): Consolidation – The Silence of VolatilityEven though ⚠️ETHEREUM is trading in a bearish trend since October, 📉
The pair has been in a deep consolidation, since the last 3 days 🗓️
The price is currently testing a strong horizontal support level where the price is consolidating. ↔️
Because the trend is strongly bearish, chances will be high to see
a further bearish continuation. 🐻
Your reliable confirmation will be a breakout and a 4H candle close below the underlined support. 🕯️
The next goal for the sellers will be 2840 🎯
Alternatively, the market may continue consolidating and trading within the range. 🔄

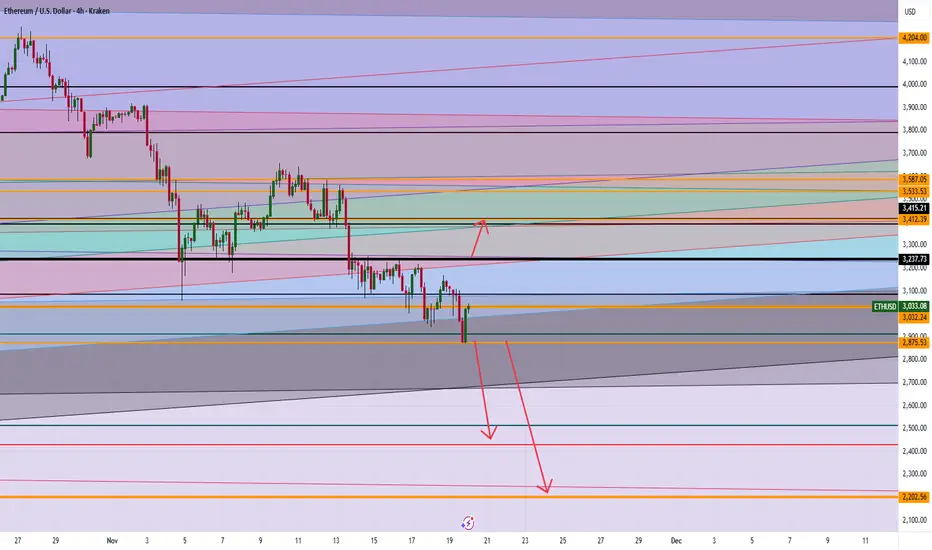
ETH Breakout Levels: Is $3,600 Next or Will Ethereum Crash to $2If ETH holds above 3237, clear momentum targets the 3400 range, with further upside potential toward 3500–3600 if buyers keep control.
A sustained break below 2875 opens the path to 2500, and possibly deeper toward 2200 on heavy selling pressure.
Any questions send me a DM
$ETH Bottom Vibes: Strong Bullish Div on the DailyCRYPTOCAP:ETH is giving potential bottom signs. While the next seemingly bearish-minded zone of liquidity is between 2500-2700. However, I disagree. There is a sneaky zone of accumulation that CRYPTOCAP:ETH bulls and bears battle between 2800-3100. See the tan colored box on my chart.
Next, you can see a Strong Bullish Divergence on the daily chart for CRYPTOCAP:ETH with the RSI.
Last, there is a subtle, yet technically significant Falling Wedge Pattern forming up on the chart of $ETH. Meanwhile the fear is nearly at an all time high and the market awaits NVDA and AI performance. Earnings came in in the GREEN.
I typically try to think different than the "crowd think". So if the bottom is here it would front run so many people who want to purchase ETH in the 2500-2700 range. Makes sense to me.
The sentiment checks out for bottom vibes (like the CMC Greed and Fear Index at a 15 yesterday) combined with 1 very strong technical indicator (strong bullish divergence on the 1 Day chart) right in the middle of a sneaky zone of accumulation.
Let's see. NFA

ETH PERPETUAL TRADE BUY SETUP Long from $2880ETH PERPETUAL TRADE
BUY SETUP
Long from $2880
Currently $2880
Targeting $2980 or Above
(Trading plan IF ETH
go down to $2830 will add more longs)
Follow the notes for updates
In the event of an early exit,
this analysis will be updated.
Its not a Financial advice

EthereumETHUSD
- Completed " 12345 " Impulsive Waves
- Consolidation Phase as an corrective pattern in Short Time Frame
- Break of Structure
- RSI - Divergence
- Change of Characteristics

“Ethereum Support Retest & Bullish Reversal Setup”Ethereum is retesting the key support zone after a bearish move, holding above the trendline. If the support holds, price may bounce toward the next target at 3,150, following the projected upward move. BOS levels and trendline interactions highlight potential bullish continuation.

$ETH Trendline Hold + Higher Low – Ethereum Bull Run Reloaded!COINBASE:ETHUSD CRYPTOCAP:ETH Trendline Hold + Higher Low – Ethereum Bull Run Reloaded! 🚀
Altcoin Pioneers! 🔥 ETH just tagged the multi-year ascending trendline at ~$3,141 (the same line that perfectly caught every major low since 2022) and instantly bounced with a strong weekly green candle. Higher low officially confirmed!
- Trendline defended for the 6th time ✅
- With BTC.D crashing, ETH.D bottoming & falling wedge breakout on BTC, all stars are aligning for Ethereum to lead the next leg
- Close above $3,800 flips weekly structure → targets $5,000 → $7,000 → $10k+ in 2026
RSI resetting from oversold, volume building. This is the exact setup that launched ETH from $1,800 → $4,800 last cycle. Ethereum season is loading FAST! 🧪💥
#Ethereum #ETHBull #AltseasonLeader

ETHUSD BUY 2442On the daily chart, ETHUSD is trending downwards, with the bears in control. The price is expected to continue lower, with support around 2442, a potential buy point for a bullish bat pattern, which also falls within a previous demand zone.

Short time🚨 Ethereum Warning! 🚨
Looks like the bears are waking up 🐻 —
Ethereum is losing its key supports one by one, and signs are pointing toward a bearish phase ahead! 📉
If you’re still holding long positions, manage your risk wisely…
The sound of an upcoming dump is getting louder 👀

11/17/25 - $ethusd - Zoom out.11/17/25 :: VROCKSTAR :: BITSTAMP:ETHUSD
Zoom out.
- does this chart look bearish to you?
- the scale chain with the most traction today is eth hands down
- L2s are the new "L1" and eth is becoming the settlement layer L0
- wall street loves it
- the retail "missed bitcoin buying zcash" crowd just doesn't get it, oddly
- native staking
- use cases out the wazoo
- chart looks, honestly, great (zoom out!)
- rarely do you get the benefit of so many years of adoption, domination and now up coming catalysts and the px remains a relic of the past because people are so behind-hurt "muh alt sea-zon"
- eth isn't an alt
- eth is the S&P of the blockchain world
- bitcoin is gold
- eth is the nasdaq onchain
- and this party is in inning 1
- plan accordingly
- if you r using leverage or need returns "tomorrow" hfsp
- this is a hold, accumulate, hold, accumulate and patience will be rewarded
- stack sats, stack eth... chill
see u on the otherside of 2025 homie, i like this winner at $3k. smooth brainer.
V

$ETH – Bear Flag Developing as $BTC Cracks Key SupportEthereum ( CRYPTOCAP:ETH ) is forming a bear flag pattern just as Bitcoin ( CRYPTOCAP:BTC ) starts to crack under major support — this could get ugly fast if we lose the key levels in both charts.
🔹 The Setup:
CRYPTOCAP:ETH is hovering around $3,000, a huge psychological and structural level on the chart.
The current flag structure looks weak — lower highs, declining volume, and repeated rejections at the 9 EMA.
A flush below $3,000 opens the door to a deeper move, potentially into the mid-$2,000s or even lower.
🔹 Macro & Market Context:
The entire risk complex looks shaky — if NASDAQ:NVDA disappoints on earnings, it could accelerate selling across crypto and equities.
CRYPTOCAP:BTC ’s failure to hold support is a red flag — crypto tends to move together on momentum shifts.
Watch for risk-off confirmation in NASDAQ:QQQ , AMEX:IWM , and high-beta names.
🔹 My Trade Plan:
1️⃣ Position: Short CRYPTOCAP:ETH here with a stop over the 9 EMA on the daily.
2️⃣ Target: First zone in the mid-$2,000s, potential extension if panic sets in.
3️⃣ Trigger: Breakdown confirmation under $3,000 with volume.
Why I Like This Short:
Clean bear flag structure with well-defined risk.
CRYPTOCAP:BTC and risk assets breaking key levels together = confluence.
CRYPTOCAP:ETH has plenty of air pockets below $3,000 — the technicals support continuation.

This Is NOT a Bear Market - Its a Setup!Everyone is saying the 50 EMA is broken, we are officially in bearish territory, and I will be quite honest, that excites me. I think we are almost at the point where we will BLOW.
We never get the bear market when everyone expects it — just like we never get the bull market when everyone waits for it.
This move down is designed to scare you… and once enough people believe it’s over? That’s when the real move begins.
I cover:
-Why the move down is engineered to convince traders it’s “over”
-The psychology behind fear-driven dumps
-BTC downside risk before the real move up
-TOTAL market structure and key levels
-ETH analysis and what I’m expecting next
-Why this entire move fits perfectly into my bullish narrative
⚠️ Disclaimer:
I am not a financial advisor. The content shared on this channel is for educational and informational purposes only and should not be considered financial advice.
Trading and investing in cryptocurrency involve high risk — you could lose some, or all, of your money. Always do your own research and make sure you understand the risks before making any financial decisions.

ETH BULLISHPlease don’t judge the set up lol I’m still learning. I’d love some constructive criticism cause I know I got a rookie setup but I am bullish on ETH.
