I'm still bearish on EThereum Price might not get to the point of interest i marked out but if it does, I'm 50% sure it will hold then do a 100 pips sell first before either continuing to TP or reversing.
Use proper risk and money management if you do decide to set your limit order after the close of this current daily candle.
Trade ideas

ETH idea 12.11.2025On this market, I see the potential of the two closest scenarios, on the one hand, a short at the level of 3900-4000, where I would like to see the sfp above the previous high, and then a long one, which I would like when it falls below the wall at the price of 3180

ETHUSD W1 - Swing PositionETHUSD W1
We might be starting the bullish continuation here in the Crypto space after such an aggressive correction. We have marked on a 618 correction from previous swing low to swing high price.
Swing low price of $1400, to a swing high price of $5000, a huge extension seen from April 2025 through to end of Aug 2025. We have indicated various prices of interest, working out every $500.
Falling just shy of $2500, this may have been the lowest price we expect to. Lets see what this week brings.

ETH shortStrong downtrend with ADX above 40.
EMA's cross over downwards.
RSI not yet oversold.
Sell volume clearly dominates.
Has lots of room to breakdown further.

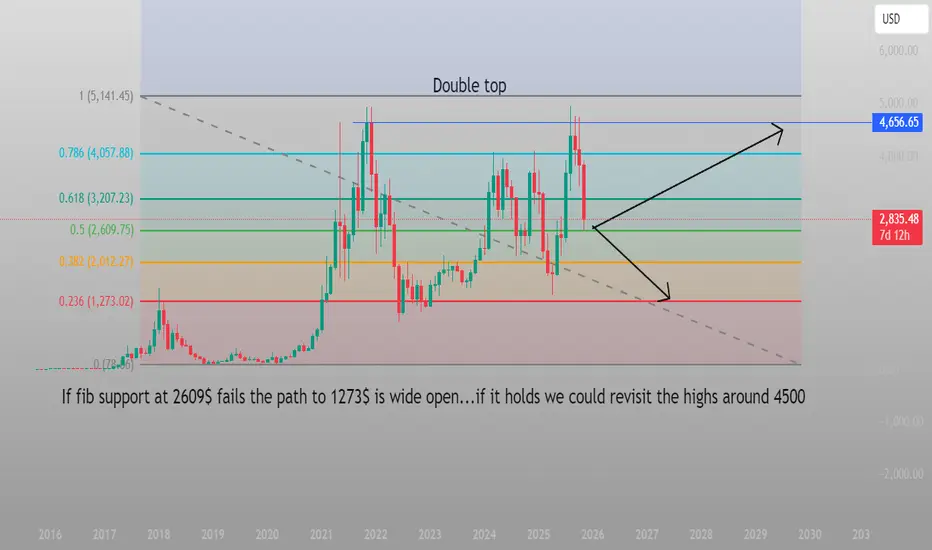
ETH decision pointWe are at a crossroads I believe.
Double top near 4600; major resistance ahead.
Key support at 2609; breakdown targets 1273.
Hold at 2609 could rally toward 4500.
Fib levels guide risk and targets.
ETHUSD Weekly
Great weekly pullback for ETHUSD. Long-term buy here with the market structure bill coming next month.

ETH Is Testing the 0.786 Level With DeM at ExhaustionETH is pressing into a major support cluster built from the July 2025 swing low and the readings on the RB DeM indicator are finally reaching exhaustion territory.
The DeM value sitting near 0.18 lines up with the 0.786 retracement of the entire July push which creates a high probability reaction zone.
✓ RB DeM showing deep exhaustion
✓ Price tapping the 0.786 fib from the July 2025 cycle
✓ Structure approaching a level where bigger players usually reload
If buyers defend this zone the next rotation upward could build quickly. I am watching for my RB Swing Setups algo to trigger once momentum shifts.
Full multi timeframe analysis and weekly setups are inside my newsletter.
Link in profile.

ETHUSD TRADING LEVELS#ETHUSD TRADING LEVELS by TrAdiNgSoLiDLeVeLs. Anyone can trade on both sides with a strict stoploss.
Thank You for your support.

ETHUSD oversold & bearish ?The ETHUSD pair continues to display a bearish outlook, in line with the prevailing downward trend. Recent price action suggests a corrective pullback, potentially setting up for another move lower if resistance holds.
Key Level: 2,914
This zone, previously a consolidation area, now acts as a significant resistance level.
A failed test and rejection at 2,914 would likely resume the bearish momentum.
Downside targets include:
2,476 – Initial support
2,400 – Intermediate support
2,330 – Longer-term support level
Bullish Scenario (breakout above 2,914):
A confirmed breakout and daily close above 2,914 would invalidate the bearish setup.
In that case, potential upside resistance levels are:
2,960 – First resistance
3,040 – Further upside target
Conclusion
ETHUSD remains under bearish pressure, with the 2,914 level acting as a key inflection point. As long as price remains below this level, the bias favours further downside. Traders should watch for price confirmation around that level to assess the next move.
This communication is for informational purposes only and should not be viewed as any form of recommendation as to a particular course of action or as investment advice. It is not intended as an offer or solicitation for the purchase or sale of any financial instrument or as an official confirmation of any transaction. Opinions, estimates and assumptions expressed herein are made as of the date of this communication and are subject to change without notice. This communication has been prepared based upon information, including market prices, data and other information, believed to be reliable; however, Trade Nation does not warrant its completeness or accuracy. All market prices and market data contained in or attached to this communication are indicative and subject to change without notice.

ETH: major key levels!ETH:
.
Major key levels!
Wait for signals with low supply volumes at the bottom and reversal signals.
.
US STOCKS- WALL STREET DREAM- LET'S THE MARKET SPEAK!

ETH DCA Opportunities: Targeting the $2,900 Zone and FibonacciEthereum Breakdown: Fibonacci Retracements and Strategy-Validated Supports
Let's dive into Ethereum ( BINANCE:ETHUSD ).
Ethereum is approaching an interesting zone established from March to May last year, confirmed by both my indicators around $2,900 USD. Currently, it's nearing that same level, which converges with the range from our recent low at $1,300 to the high from a few weeks ago hitting the 0.618 Fibonacci retracement.
This positions the current zone as a prime area to initiate DCA entries for a better average price. If the price doesn't hold and breaks through, the next strategy-confirmed zones would be around $2,400 USD, followed by another at $1,600.
My approach uses custom indicators like Trend Force (TF) and Smart Money (SM) for these validations confluences between them provide the strongest signals, but single indicator confirmations can also be reliable.
Since my indicators are private and not visible here on TradingView, head over to my Substack for the full chart, including a longer timeframe view of previous signals and zones based on the strategy. There, you can also find my detailed strategy explanation to interpret the traffic signals easily.
Remember, I'm not a financial advisor, and this isn't investment advice—always do your own research. I'm just sharing my analyses derived from proprietary tools. If you'd like me to review a specific asset, let me know in the comments.

ETHEREUM Thoughts - Potential Bottom front running the majority CRYPTOCAP:ETH has experienced a blood bath this month but I believe a potential bottom could be forming here. It really relies on several factors:
- CRYPTOCAP:BTC
- NASDAQ:NVDA
- Market wide sentiment
However, through technical analysis and hours of staring at this chart the past few weeks, I am spotting some interesting signs of life for a true bounce. I detail those in my video.
Spoiler Alert: Looks like a STRONG BULLISH DIVERGENCE is forming on the CRYPTOCAP:ETH daily chart - lets pay attention and see if the NASDAQ:NVDA earnings affect the price like I think it may...

ETHUSD | 1-Hour Bullish Continuation Concepts: ICT | SMC | Bill Williams | RR > 2:1
ETH is setting up for a significant bullish move on the 1-hour chart. After a clear sweep of sell-side liquidity, price has shown strong displacement and is now coiling above a key support confluence, suggesting a continuation toward the range high is likely.
ICT & SMC Analysis:
Liquidity Sweep & FVG: The wick down to $3,069.1 constituted a clear sweep of sell-side liquidity. The powerful bullish candle that followed created a significant Fair Value Gap (FVG) and a Bullish Order Block.
Market Structure Shift (MSS): The break above the recent swing high at $3,090.9 confirmed a shift from a ranging/downward structure to a bullish one.
Mitigation & Retest: The current pullback is retesting the confluence of the FVG, the Order Block, and the Alligator, offering a high-probability long entry.
Bill Williams’ Alligator Confirmation:
The Alligator on the 1-hour frame confirms the bullish bias:
Lips (3,078.4) > Teeth (3,079.5) > Jaw (3,079.8)
The alignment is bullish, and price holding above the Lips indicates the trend is awake and active. We are looking for the next impulsive leg to begin from this support.
Trade Plan (1-Hour Setup):
🟩 Entry Zone: $3,077 - $3,082 (Confluence of FVG, Order Block, and Alligator support)
🔴 Stop Loss: $3,068 (Below the recent liquidity sweep low)
🎯 Take Profit: $3,258 (Major previous high and a key liquidity pool on the 1H/4H chart)

#ETH/USDT : Rebound Setup from ascending channel Support#ETH
The price is moving within an ascending channel on the 1-hour timeframe and is adhering to it well. It is poised to break out strongly and retest the channel.
We have a downtrend line on the RSI indicator that is about to break and retest, which supports the upward move.
There is a key support zone in green at the 2930 price level, representing a strong support point.
We have a trend to stabilize above the 100-period moving average.
Entry price: 3064
First target: 3100
Second target: 3168
Third target: 3260
Don't forget a simple money management rule:
Place your stop-loss order below the green support zone.
Once you reach the first target, save some money and then change your stop-loss order to an entry order.
For any questions, please leave a comment.
Thank you.

Ethereum Accumulates Below Key ResistanceFenzoFx—Ethereum remains bearish, trading near $3,078.00. Price is below $3,170.00, with a bearish fair value gap overhead and resistance at $3,371.00. Technical indicators show an oversold market with bullish divergence, and candlestick patterns suggest accumulation around this zone.
Despite the bearish setup, a short-term rise may occur to grab liquidity before the downtrend resumes. In this case, Ethereum could target the bearish gap and resistance at $3,371.00.

ETHUSD bearish continuation below 3,508 resistanceThe ETHUSD pair continues to display a bearish outlook, in line with the prevailing downward trend. Recent price action suggests a corrective pullback, potentially setting up for another move lower if resistance holds.
Key Level: 3,508
This zone, previously a consolidation area, now acts as a significant resistance level.
A failed test and rejection at 3,508 would likely resume the bearish momentum.
Downside targets include:
2,878 – Initial support
2,784 – Intermediate support
2,700 – Longer-term support level
Bullish Scenario (breakout above 3,508):
A confirmed breakout and daily close above 3,508 would invalidate the bearish setup.
In that case, potential upside resistance levels are:
3,590 – First resistance
3,665 – Further upside target
Conclusion
ETHUSD remains under bearish pressure, with the 3,508 level acting as a key inflection point. As long as price remains below this level, the bias favours further downside. Traders should watch for price confirmation around that level to assess the next move.
This communication is for informational purposes only and should not be viewed as any form of recommendation as to a particular course of action or as investment advice. It is not intended as an offer or solicitation for the purchase or sale of any financial instrument or as an official confirmation of any transaction. Opinions, estimates and assumptions expressed herein are made as of the date of this communication and are subject to change without notice. This communication has been prepared based upon information, including market prices, data and other information, believed to be reliable; however, Trade Nation does not warrant its completeness or accuracy. All market prices and market data contained in or attached to this communication are indicative and subject to change without notice.

ETH/USD — Bearish Breakdown Toward 2,500 Ethereum extended its decline last week and broke below 3,125 (Murray ), updating the July low with a drop to 2,950. The market remains dominated by risk-off sentiment as the Fed signals the possibility of pausing rate cuts in December, geopolitical tension increases, and uncertainty around AI-driven tech investments grows.
The Fear & Greed Index sits at 11 (extreme fear), while ETF outflows intensified:
• ETH ETFs: –$1.4B (≈7% of AUM)
• BTC ETFs: –4%
On-chain activity also confirms weakening demand: ETH deposits fell 13% to a four-month low, and weekly DEX volume declined 27% to $17.4B.
The fundamental backdrop continues to favor the bears.
⸻
Technical Setup
ETH/USD broke below its descending channel and consolidated under 3,125, opening a clear path to deeper downside targets:
Bearish Structure
• Price trades below the mid-Bollinger band
• Bollinger Bands point downward
• MACD expands in the negative zone
• Stochastic remains flat inside oversold conditions
Unless ETH reclaims 3,750, the trend remains decisively bearish.
⸻
Key Levels
Resistance: 3,750 · 4,375 · 5,000
Support: 3,125 · 2,500 · 2,187
⸻
Trading Plan
🔻 Primary Scenario — SELL STOP
• Entry: 2,960
• TP1: 2,500
• TP2: 2,187
• SL: 3,300
• Bias: bearish continuation
• Timeframe: Weekly (5–7 days)
🔼 Alternative Scenario — BUY STOP
• Entry: 3,770
• TP1: 4,375
• TP2: 5,000
• SL: 3,360
• Bias: reversal only above 3,750
⸻
ETH remains in a strong downtrend after losing the 3,125 support zone. A move below 2,960 confirms continuation toward 2,500 → 2,187, while only a breakout above 3,750 would signal a potential trend reversal.

don't do (m)$ETH!IMO we are heading for the first neckline, as seen on the chart.
If it doesn't bounce there.. next neck line down below, and so on.
NFA, DYOR, for entertainment purposes only 🙄

$ETH Weekly UPDATE. Ethereum has hit the $3050 CRYPTOCAP:ETH Weekly UPDATE.
Ethereum has hit the $3050 zone right as expected, and sellers are still pressing down. The rejection from $3500 confirmed that momentum flipped bearish and structure has not recovered since. As long as price stays under the $3400–$3500 range, the downside pressure remains valid.
ETH is now breaking below $3000. If it fails to recover and hold above this level, the next liquidity pockets sit at $2800 and $2600, where buyers may try to defend. Until then, patience favors the bears. But if ETH holds $3000, a reversal toward $3400–$3500 is possible.
The only real shift in momentum comes if ETH reclaims the 1W 50 EMA and builds support above it. That would open the door for a sharp move back toward $3800–$4000. Until then, every bounce is just a reaction, not a reversal.

$ETHUSD: Riding the Lightning - The Short Trade is ActiveThe Trade is Active
Greetings, fellow navigators. The market has spoken, and our patience has been met with a trigger. The short setup we've been observing on BITSTAMP:ETHUSD is now live, with price having tagged our entry zone around the $4590 - $4600 level. If stopped out at 4800, we would be okay to re-enter, keeping the stop loss above the most recent swing high.
The thesis remains as discussed: after a powerful "inhale," the market appears to be taking a corrective "exhale." Price has broken the lower boundary of its immediate ascending channel, signaling a potential shift in short-term momentum. The plan is in motion.
Style: Short / Mean Reversion
Entry: ~$4590 (Active)
Stop Loss: ~$4814
Take Profit: ~$3000
Risk/Reward: Approximately 1 : 6.9
The Philosophy - A Word on Trading Crypto
To trade crypto is to engage with the market in its wildest form. It is the extreme sport of the financial world. The volatility here is a double-edged sword; it can carve out immense opportunity, but it demands the utmost respect and skill to handle without getting cut. Trying to catch a reversal in this space can feel like trying to catch a falling blade that has no handle.
This is why we don't "catch"; we plan. We define our risk before we ever enter. The "doctor's orders" for navigating this beautiful chaos are simple, but not easy:
A healthy dose of strategically placed stop losses.
A commitment to non-degenerate risk management.
A big smile, because the lessons learned here will forge you into a disciplined trader.
A Note on Your Well-Being
I speak of getting "cut" not to be grim, but to be real. This path can be intensely lonely, especially when the market delivers a harsh lesson. I've been there. If you are struggling, or ever lose more than you were prepared to, I want you to know that you do not have to carry that weight alone. Please reach out to someone.
Everything money can buy is cheap. You are priceless.
If you are struggling, you don't have to do it alone.
988 Suicide and Crisis Lifeline
Hours: Available 24 hours
Just shine.
Disclaimer: This is not financial advice. It is for educational and informational purposes only. Please conduct your own research and manage your risk accordingly.

ETHUSD-LIKELY TO DUMP BELOW 2.6K[Short it]WEEKLY-Bearish order flow
Daily-bearish order flow with bearish context
ENTRIES-H1/5mns entry time frames swingers and intra -day traders respectively
Target weekly ORDERBLOCK

ETHUSD – Bullish Continuation Setup1H Reversal → Now Looking for Expansion**
ETH just confirmed a clean shift from reversal into continuation, exactly the structure we expect after clearing liquidity and tapping a fresh demand zone.
1️⃣ Liquidity Grab Completed
Price swept sell-side liquidity beneath the recent range (classic ICT sell-to-buy behavior).
Smart money filled long positions → bullish narrative begins.
2️⃣ Breaker + FVG Retest
ETH returned to a micro Breaker Block + a small 1H FVG.
These zones overlap—confluence for continuation.
Price is now sitting right inside that region.
3️⃣ Alligator Compression (Bill Williams)
Alligator (blue-red-green) lines are compressing.
This is the “sleeping Alligator” phase → volatility contraction.
What comes next?
Expansion.
Direction of expansion = aligned with the higher-timeframe liquidity draw above.
4️⃣ Clear Draw on Liquidity Above
Closest upside magnets:
3,300 – 3,330 → inefficiency fill
3,641.7 → major liquidity + previous 1H distribution high
The model favors a move up to rebalance those imbalances.
My Trade Setup (1H Long)
Entry Zone:
🔵 3,160 – 3,200 (Breaker + FVG confluence)
Stop Loss:
🔻 3,020
(below last displacement low — invalidation)
Targets:
🎯 TP1: 3,300
🎯 TP2: 3,420 – mid-range imbalance
🎯 TP3: 3,641.7 (main liquidity draw)
Risk-to-Reward:
Solid continuation R:R from current structure
(as shown on the chart).

Ethereum Next Buying Move Read the Description The chart shows Bullish Trend
Support Zone: Around $3,200–$3,300 (clearly marked).
Target Level: Around $3,680–$3,700.
Price has bounced up from the support zone and is now moving toward that target region.
The chart’s drawn projection shows a bullish retracement into the upper zone before a potential pullback.
Short Setup Idea (Counter to the Bullish Move)
If you’re waiting for a short (sell) opportunity, the best area would be near the target resistance zone shown in your chart.
Short Entry Zone:
$3,650–$3,750
(This is the “Target Level” box
Confirmation to Look For
Wait for bearish confirmation before entering:
A rejection candle
Lower time-frame break of structure
Declining volume or momentum divergence on RSI/MACD
