ETHUSD bearish continuation below 3,508 resistanceThe ETHUSD pair continues to display a bearish outlook, in line with the prevailing downward trend. Recent price action suggests a corrective pullback, potentially setting up for another move lower if resistance holds.
Key Level: 3,508
This zone, previously a consolidation area, now acts as a significant resistance level.
A failed test and rejection at 3,508 would likely resume the bearish momentum.
Downside targets include:
2,878 – Initial support
2,784 – Intermediate support
2,700 – Longer-term support level
Bullish Scenario (breakout above 3,508):
A confirmed breakout and daily close above 3,508 would invalidate the bearish setup.
In that case, potential upside resistance levels are:
3,590 – First resistance
3,665 – Further upside target
Conclusion
ETHUSD remains under bearish pressure, with the 3,508 level acting as a key inflection point. As long as price remains below this level, the bias favours further downside. Traders should watch for price confirmation around that level to assess the next move.
This communication is for informational purposes only and should not be viewed as any form of recommendation as to a particular course of action or as investment advice. It is not intended as an offer or solicitation for the purchase or sale of any financial instrument or as an official confirmation of any transaction. Opinions, estimates and assumptions expressed herein are made as of the date of this communication and are subject to change without notice. This communication has been prepared based upon information, including market prices, data and other information, believed to be reliable; however, Trade Nation does not warrant its completeness or accuracy. All market prices and market data contained in or attached to this communication are indicative and subject to change without notice.
Trade ideas

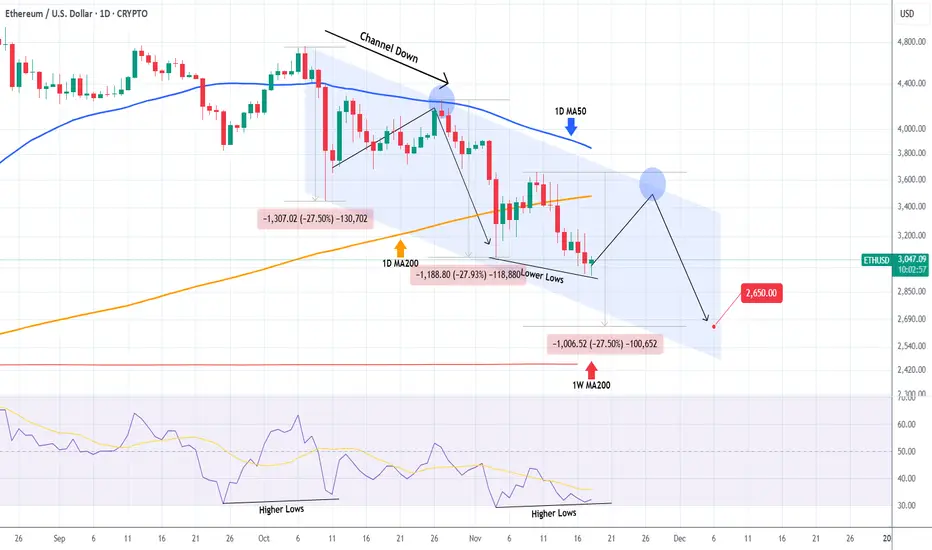
ETHEREUM Dead cat bounce incoming?Ethereum (ETHUSD) has been trading within a Channel Down since the October 07 High with both its Bearish Leg so far declining by -27.50% each.
As the 1D RSI is forming Higher Lows against the price's Lower Lows, i.e. a Bullish Divergence similar to October 11, it is possible to see a short-term bounce to test the 1D MA50 (blue trend-line) again (where the price got rejected on October 27), before it completes the -27.50% Bearish Leg projection.
The medium-term Target remains 2650.
---
** Please LIKE 👍, FOLLOW ✅, SHARE 🙌 and COMMENT ✍ if you enjoy this idea! Also share your ideas and charts in the comments section below! This is best way to keep it relevant, support us, keep the content here free and allow the idea to reach as many people as possible. **
---
💸💸💸💸💸💸
👇 👇 👇 👇 👇 👇
ETH/USD — Bearish Breakdown Toward 2,500 Ethereum extended its decline last week and broke below 3,125 (Murray ), updating the July low with a drop to 2,950. The market remains dominated by risk-off sentiment as the Fed signals the possibility of pausing rate cuts in December, geopolitical tension increases, and uncertainty around AI-driven tech investments grows.
The Fear & Greed Index sits at 11 (extreme fear), while ETF outflows intensified:
• ETH ETFs: –$1.4B (≈7% of AUM)
• BTC ETFs: –4%
On-chain activity also confirms weakening demand: ETH deposits fell 13% to a four-month low, and weekly DEX volume declined 27% to $17.4B.
The fundamental backdrop continues to favor the bears.
⸻
Technical Setup
ETH/USD broke below its descending channel and consolidated under 3,125, opening a clear path to deeper downside targets:
Bearish Structure
• Price trades below the mid-Bollinger band
• Bollinger Bands point downward
• MACD expands in the negative zone
• Stochastic remains flat inside oversold conditions
Unless ETH reclaims 3,750, the trend remains decisively bearish.
⸻
Key Levels
Resistance: 3,750 · 4,375 · 5,000
Support: 3,125 · 2,500 · 2,187
⸻
Trading Plan
🔻 Primary Scenario — SELL STOP
• Entry: 2,960
• TP1: 2,500
• TP2: 2,187
• SL: 3,300
• Bias: bearish continuation
• Timeframe: Weekly (5–7 days)
🔼 Alternative Scenario — BUY STOP
• Entry: 3,770
• TP1: 4,375
• TP2: 5,000
• SL: 3,360
• Bias: reversal only above 3,750
⸻
ETH remains in a strong downtrend after losing the 3,125 support zone. A move below 2,960 confirms continuation toward 2,500 → 2,187, while only a breakout above 3,750 would signal a potential trend reversal.

don't do (m)$ETH!IMO we are heading for the first neckline, as seen on the chart.
If it doesn't bounce there.. next neck line down below, and so on.
NFA, DYOR, for entertainment purposes only 🙄

ETH Hits 3K Target – Rebound Likely, Correction Not Over Though1. What Happened Since the Last Update
In my previous ETH analysis, I warned that if Ethereum loses the 3700 support zone, the probability of a drop toward 3000 becomes very high.
That scenario played out perfectly — the 3700 level failed, and price has now reached the 3K zone in recent days.
2. The Key Question Now
Is this the end of the correction, or just the first leg?
From my perspective, the overall correction is probably not finished yet. However, the 3000 area is a major support level, both technically and psychologically, so a bullish rebound from here is very likely.
3. Technical Outlook
Even inside a larger corrective structure, ETH can easily rally $230–$350, or even more, from these levels before deciding the next direction.
Key levels to monitor:
-Support: 3000 → then 2900 (preferred buy zone)
- Upside target: 3300
- Invalidation: A clean daily close below 2800 would weaken the bullish rebound scenario
4. Trading Plan
For the short term, I will look to buy preferably below 2900, targeting 3300 on the bounce.
This is not a long-term trend reversal call — it is a tactical long setup inside a broader correction.
5. Conclusion
ETH has reached the downside target discussed weeks ago. A rebound is likely from here, but the larger correction may not be over yet.
Short-term, buying dips around 2900 makes sense for a bounce toward 3300
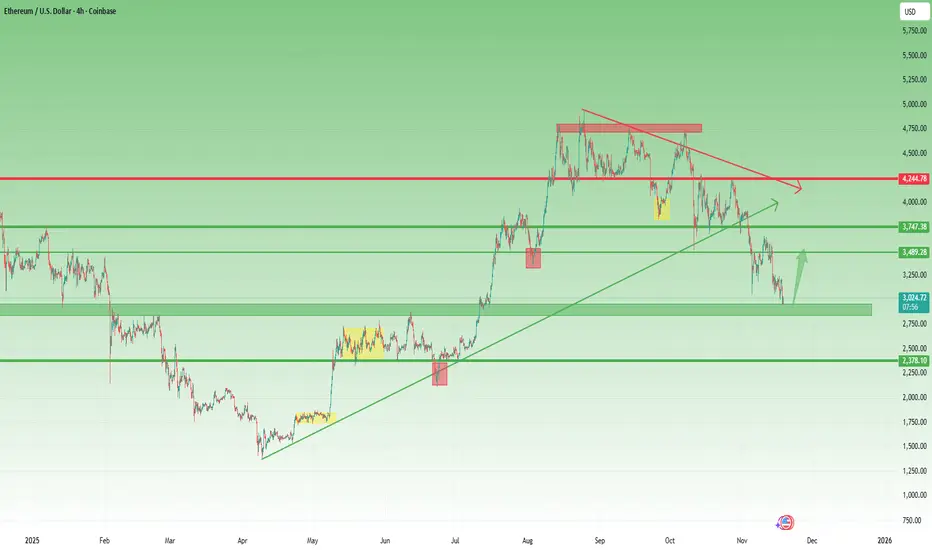

ETHUSD – Bearish Channel Respect, Flag Breakdown SetupHi
The chart illustrates a clean, structured bearish trend where price continues to respect a broad descending channel. Each major reaction level and pattern aligns well with the larger downtrend, indicating that sellers are still in control.
Price recently tapped a key flip area near the upper boundary of the channel, a crucial zone where previous support has turned into resistance. The rejection from this area confirmed a strong supply and initiated a sharp decline, marked on the chart as the flagpole.
Following the impulse drop, the market entered a consolidation range, forming a classic bear flag structure. Price corrected roughly one-third of the flagpole; a typical retracement depth before continuation in a downtrend.
The drawn projection suggests a bearish continuation from the consolidation box, with the price expected to break lower. If momentum follows the channel’s trajectory, ETH could descend toward the first S&D zone, which aligns with the lower boundary of the macro channel. The marked target around 2848 sits near a liquidity and demand cluster, making it a logical tap point before any significant reversal or larger breakout attempt.
Disclaimer: As part of ThinkMarkets’ Influencer Program, I am sponsored to share and publish their charts in my analysis.

ETH:USD When bottom?ETH is at a make or break area at the moment. $2870-$2950 is a super major support zone for ETH. If price wants to go down a bit more, then the 0.5 fib level at $2730-$2630 would be another very strong support. The last bit of support would be the golden zone area between $2270 - $2180. Elliott wave perspective, ETH might have come to a spot where no one would complain if it turned around from here. RSI is showing bullish divergence. We can make a case for a full 5 waves for C. If market has other ideas, then this could be a larger wave 3 for a nested 1/2, 1/2. If that is the case, then price might head down to the lower levels mentioned above. But, for now, it does seem like capitulation has taken place, and the sell pressure has peaked. Until price is above at least $4285, it can still be a larger AB with another leg down for C. Ideally, we would want to see another ATH with a complete 5 waves sequence up before we know for sure. My plan is to start nibbling ASAP to add back to my bag with a stop loss. When the sentiment is this bearish, it has always worked out, at least in the short term. If the minor Wave 2 is indeed over, then we should start prepping for massive fireworks. On macro cycle minor wave 3s are the strongest. We'll see how things go, but I am hopeful; until market decides to throw dirt in my eyes!

ETHUSD BUY 2442On the daily chart, ETHUSD is trending downwards, with the bears in control. The price is expected to continue lower, with support around 2442, a potential buy point for a bullish bat pattern, which also falls within a previous demand zone.

$ETH Weekly UPDATE. Ethereum has hit the $3050 CRYPTOCAP:ETH Weekly UPDATE.
Ethereum has hit the $3050 zone right as expected, and sellers are still pressing down. The rejection from $3500 confirmed that momentum flipped bearish and structure has not recovered since. As long as price stays under the $3400–$3500 range, the downside pressure remains valid.
ETH is now breaking below $3000. If it fails to recover and hold above this level, the next liquidity pockets sit at $2800 and $2600, where buyers may try to defend. Until then, patience favors the bears. But if ETH holds $3000, a reversal toward $3400–$3500 is possible.
The only real shift in momentum comes if ETH reclaims the 1W 50 EMA and builds support above it. That would open the door for a sharp move back toward $3800–$4000. Until then, every bounce is just a reaction, not a reversal.

11/17/25 - $ethusd - Zoom out.11/17/25 :: VROCKSTAR :: BITSTAMP:ETHUSD
Zoom out.
- does this chart look bearish to you?
- the scale chain with the most traction today is eth hands down
- L2s are the new "L1" and eth is becoming the settlement layer L0
- wall street loves it
- the retail "missed bitcoin buying zcash" crowd just doesn't get it, oddly
- native staking
- use cases out the wazoo
- chart looks, honestly, great (zoom out!)
- rarely do you get the benefit of so many years of adoption, domination and now up coming catalysts and the px remains a relic of the past because people are so behind-hurt "muh alt sea-zon"
- eth isn't an alt
- eth is the S&P of the blockchain world
- bitcoin is gold
- eth is the nasdaq onchain
- and this party is in inning 1
- plan accordingly
- if you r using leverage or need returns "tomorrow" hfsp
- this is a hold, accumulate, hold, accumulate and patience will be rewarded
- stack sats, stack eth... chill
see u on the otherside of 2025 homie, i like this winner at $3k. smooth brainer.
V

Short time🚨 Ethereum Warning! 🚨
Looks like the bears are waking up 🐻 —
Ethereum is losing its key supports one by one, and signs are pointing toward a bearish phase ahead! 📉
If you’re still holding long positions, manage your risk wisely…
The sound of an upcoming dump is getting louder 👀

$ETHUSD: Riding the Lightning - The Short Trade is ActiveThe Trade is Active
Greetings, fellow navigators. The market has spoken, and our patience has been met with a trigger. The short setup we've been observing on BITSTAMP:ETHUSD is now live, with price having tagged our entry zone around the $4590 - $4600 level. If stopped out at 4800, we would be okay to re-enter, keeping the stop loss above the most recent swing high.
The thesis remains as discussed: after a powerful "inhale," the market appears to be taking a corrective "exhale." Price has broken the lower boundary of its immediate ascending channel, signaling a potential shift in short-term momentum. The plan is in motion.
Style: Short / Mean Reversion
Entry: ~$4590 (Active)
Stop Loss: ~$4814
Take Profit: ~$3000
Risk/Reward: Approximately 1 : 6.9
The Philosophy - A Word on Trading Crypto
To trade crypto is to engage with the market in its wildest form. It is the extreme sport of the financial world. The volatility here is a double-edged sword; it can carve out immense opportunity, but it demands the utmost respect and skill to handle without getting cut. Trying to catch a reversal in this space can feel like trying to catch a falling blade that has no handle.
This is why we don't "catch"; we plan. We define our risk before we ever enter. The "doctor's orders" for navigating this beautiful chaos are simple, but not easy:
A healthy dose of strategically placed stop losses.
A commitment to non-degenerate risk management.
A big smile, because the lessons learned here will forge you into a disciplined trader.
A Note on Your Well-Being
I speak of getting "cut" not to be grim, but to be real. This path can be intensely lonely, especially when the market delivers a harsh lesson. I've been there. If you are struggling, or ever lose more than you were prepared to, I want you to know that you do not have to carry that weight alone. Please reach out to someone.
Everything money can buy is cheap. You are priceless.
If you are struggling, you don't have to do it alone.
988 Suicide and Crisis Lifeline
Hours: Available 24 hours
Just shine.
Disclaimer: This is not financial advice. It is for educational and informational purposes only. Please conduct your own research and manage your risk accordingly.

$ETH – Bear Flag Developing as $BTC Cracks Key SupportEthereum ( CRYPTOCAP:ETH ) is forming a bear flag pattern just as Bitcoin ( CRYPTOCAP:BTC ) starts to crack under major support — this could get ugly fast if we lose the key levels in both charts.
🔹 The Setup:
CRYPTOCAP:ETH is hovering around $3,000, a huge psychological and structural level on the chart.
The current flag structure looks weak — lower highs, declining volume, and repeated rejections at the 9 EMA.
A flush below $3,000 opens the door to a deeper move, potentially into the mid-$2,000s or even lower.
🔹 Macro & Market Context:
The entire risk complex looks shaky — if NASDAQ:NVDA disappoints on earnings, it could accelerate selling across crypto and equities.
CRYPTOCAP:BTC ’s failure to hold support is a red flag — crypto tends to move together on momentum shifts.
Watch for risk-off confirmation in NASDAQ:QQQ , AMEX:IWM , and high-beta names.
🔹 My Trade Plan:
1️⃣ Position: Short CRYPTOCAP:ETH here with a stop over the 9 EMA on the daily.
2️⃣ Target: First zone in the mid-$2,000s, potential extension if panic sets in.
3️⃣ Trigger: Breakdown confirmation under $3,000 with volume.
Why I Like This Short:
Clean bear flag structure with well-defined risk.
CRYPTOCAP:BTC and risk assets breaking key levels together = confluence.
CRYPTOCAP:ETH has plenty of air pockets below $3,000 — the technicals support continuation.

This Is NOT a Bear Market - Its a Setup!Everyone is saying the 50 EMA is broken, we are officially in bearish territory, and I will be quite honest, that excites me. I think we are almost at the point where we will BLOW.
We never get the bear market when everyone expects it — just like we never get the bull market when everyone waits for it.
This move down is designed to scare you… and once enough people believe it’s over? That’s when the real move begins.
I cover:
-Why the move down is engineered to convince traders it’s “over”
-The psychology behind fear-driven dumps
-BTC downside risk before the real move up
-TOTAL market structure and key levels
-ETH analysis and what I’m expecting next
-Why this entire move fits perfectly into my bullish narrative
⚠️ Disclaimer:
I am not a financial advisor. The content shared on this channel is for educational and informational purposes only and should not be considered financial advice.
Trading and investing in cryptocurrency involve high risk — you could lose some, or all, of your money. Always do your own research and make sure you understand the risks before making any financial decisions.

ETH PERPETUAL TRADE SELL SETUP Short from $3201ETH PERPETUAL TRADE
SELL SETUP
Short from $3201
Currently $3201
Targeting $3153 or Down
(Trading plan IF ETH
go up to $3252 will add more shorts)
Follow the notes for updates
In the event of an early exit,
this analysis will be updated.
Its not a Financial advic

ETHUSD-LIKELY TO DUMP BELOW 2.6K[Short it]WEEKLY-Bearish order flow
Daily-bearish order flow with bearish context
ENTRIES-H1/5mns entry time frames swingers and intra -day traders respectively
Target weekly ORDERBLOCK

ETH - everyone is wrongWatching this scenario playing. I predicted 1.3k$. Now I'm predicting a slow climb towards19k in early 2027.

ETHUSD – Bullish Continuation Setup1H Reversal → Now Looking for Expansion**
ETH just confirmed a clean shift from reversal into continuation, exactly the structure we expect after clearing liquidity and tapping a fresh demand zone.
1️⃣ Liquidity Grab Completed
Price swept sell-side liquidity beneath the recent range (classic ICT sell-to-buy behavior).
Smart money filled long positions → bullish narrative begins.
2️⃣ Breaker + FVG Retest
ETH returned to a micro Breaker Block + a small 1H FVG.
These zones overlap—confluence for continuation.
Price is now sitting right inside that region.
3️⃣ Alligator Compression (Bill Williams)
Alligator (blue-red-green) lines are compressing.
This is the “sleeping Alligator” phase → volatility contraction.
What comes next?
Expansion.
Direction of expansion = aligned with the higher-timeframe liquidity draw above.
4️⃣ Clear Draw on Liquidity Above
Closest upside magnets:
3,300 – 3,330 → inefficiency fill
3,641.7 → major liquidity + previous 1H distribution high
The model favors a move up to rebalance those imbalances.
My Trade Setup (1H Long)
Entry Zone:
🔵 3,160 – 3,200 (Breaker + FVG confluence)
Stop Loss:
🔻 3,020
(below last displacement low — invalidation)
Targets:
🎯 TP1: 3,300
🎯 TP2: 3,420 – mid-range imbalance
🎯 TP3: 3,641.7 (main liquidity draw)
Risk-to-Reward:
Solid continuation R:R from current structure
(as shown on the chart).

Ethereum Next Buying Move Read the Description The chart shows Bullish Trend
Support Zone: Around $3,200–$3,300 (clearly marked).
Target Level: Around $3,680–$3,700.
Price has bounced up from the support zone and is now moving toward that target region.
The chart’s drawn projection shows a bullish retracement into the upper zone before a potential pullback.
Short Setup Idea (Counter to the Bullish Move)
If you’re waiting for a short (sell) opportunity, the best area would be near the target resistance zone shown in your chart.
Short Entry Zone:
$3,650–$3,750
(This is the “Target Level” box
Confirmation to Look For
Wait for bearish confirmation before entering:
A rejection candle
Lower time-frame break of structure
Declining volume or momentum divergence on RSI/MACD

ETH/USD – Low-Volume Accumulation Breakout SetupETH/USD – Low-Volume Accumulation With Potential Early-Session Breakout Ahead
ETH/USD has been trading inside a tight, low-volume consolidation zone over the past few sessions. The daily volume profile shows a consistent drop in participation, indicating that larger players have stepped aside temporarily. Whenever price moves sideways on contracting volume, it often suggests accumulation or absorption, not weakness.
Historically on this chart, each period of suppressed volume has been followed by an impulsive breakout, as shown by the repeated patterns on the left side. The current structure is forming a similar setup.
Price continues to respect the Daily Value Area and is holding above a key support shelf, showing that sellers are failing to push the market lower—even with low volume. This is a sign of strength from passive buyers.
If today’s session also closes with muted volume, it sets the stage for a potential early-session expansion tomorrow, likely targeting the imbalance and low-volume area highlighted above.
The projected target zone aligns with the next liquidity cluster on the volume profile, where the market may attempt to print a new short-term high before deciding its next macro move.

ETH/USD – Bullish From Demand Zone Ethereum has tapped a strong demand area, and buyers are already reacting. This zone has held several times before, and we’re now seeing the early signs of a potential reversal.
If momentum continues, ETH could push toward $3,400 → $3,642 → $3,920, and possibly even $4,250. The structure is starting to form clean higher highs and higher lows, which often signals the beginning of a larger bullish move.
If this demand holds, the upside potential is very promising.

ETHUSDNow, if the price can reach the lower time levels or levels and provide confirmation, you can consider buying.
