ETHEREUM (ETHUSD): Bullish Trend Continues
I see a nice bullish confirmation on Ethereum after a recent pullback.
The price formed a double bottom pattern and violated its neckline
and a resistance line of a falling wedge pattern.
With a high probability, the market will go up.
Goal - 4741
❤️Please, support my work with like, thank you!❤️
I am part of Trade Nation's Influencer program and receive a monthly fee for using their TradingView charts in my analysis.
ETHUSD.PM trade ideas


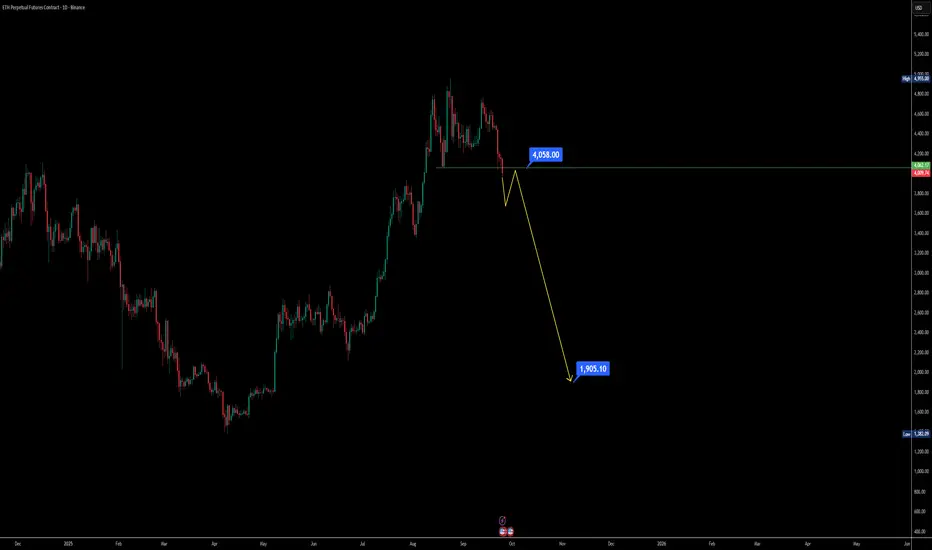
Ethereum Daily Chart Distribution Phase Signals huge dumpIf you’ve been tracking Ethereum on the daily chart, the structure is starting to look heavy — and not in a bullish way. Let’s break this down step by step so it’s easy to follow 👇
Support lost: ETH has already broken its key support zone around $4060, which previously acted as a higher low. Now, the recent dip is printing a new lower low, shifting market sentiment.
Daily close levels matter: If the daily candle closes below $4000, it confirms weakness and opens doors for a further sell-off.
Possible head and shoulders: A pullback toward the $4100 region could simply build the right shoulder of a bearish head and shoulder pattern. The structure matches what we saw earlier on the left shoulder.
Bearish momentum risk: If ETH fails to hold above $4000 after that pullback, we could be looking at extended downside — even a sharp fall toward the $2000 zone based on historical dump patterns.
Market behavior reminder: Over the past two years, whenever ETH started a distribution breakdown, the drop was often fast and violent. That’s why caution is key here.
📌 Key Takeaway: Ethereum is at a make-or-break daily level. Watch $4000 closely — losing this level could accelerate a bearish breakdown. Short-term traders may look for opportunities on the pullback, while long-term holders need to stay cautious of the possible head and shoulders pattern forming.
ETH To 3,054$ coming to a theatre near you! please see linked ideas, I keep repeating myself just to warn you all.
if bitcoin breaks support at 109,368$ please expect all hell to break loose in the crypto and stock markets.

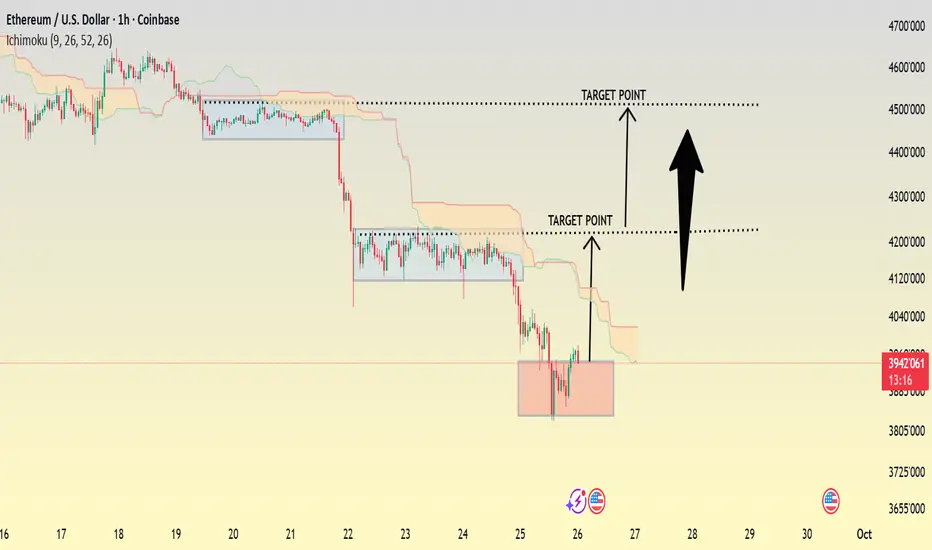
ETH/USD 1HOUR Chart Pattern ....ETH/USD is currently holding above a strong support zone, showing signs of bullish momentum building up. As long as price stays above this zone, buying pressure can continue toward the first target at 3,820 and further extension toward the second target around 4,120.
📌 Entry Zone: 3,945 – 3,940
📌 Target 1: 4,225
📌 Target 2: 4,515
📌 Stop Loss: Below 3,880
⚡ Summary:
ETH is forming a clean bullish structure after consolidation. This setup is favorable for buyers aiming for medium-term upside moves. A break and close above 4225 will confirm stronger bullish continuation.
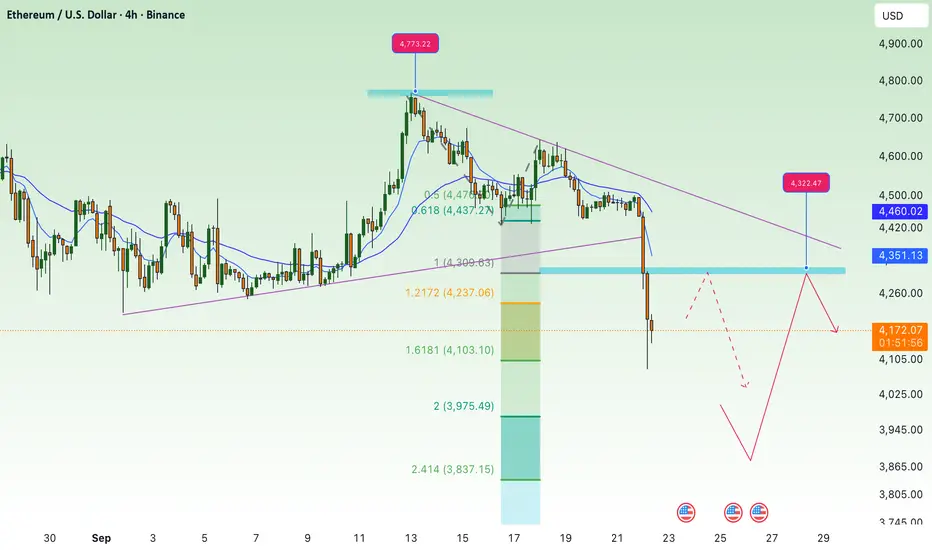
break support, continue to correct downETH 4H Chart Analysis
• Breakout Zone:
ETH has broken below the $4,360 – $4,330 zone (purple box), which previously served as strong support. This signals a shift in sentiment toward bearish momentum.
• Current Price Action:
After a sharp drop, ETH is consolidating around $4,170, hinting at a possible short-term rebound before continuing its downward structure.
• Resistance Levels:
• $4,360 – $4,330: Recently broken support, now acting as strong resistance.
• $4,505: Next resistance above, in line with prior range highs.
• Support Levels:
• $4,166: First Fib extension target, currently being tested.
• $3,880 – $3,900: Major support zone if price declines further (2.618 Fib extension + horizontal demand zone).
• Outlook:
ETH may retest the $4,330 – $4,360 resistance before continuing lower. If bearish pressure persists, the next downside target is around $3,880 – $3,900.
ConsolidationConsolidation broke downward in june. Consolidation broke downward in september.
What comes next: big rally

Bullish reversal off pullback support?The Ethereum (ETH/USD) is reacting off the pivot and could bounce from this level to the 1st resistance which has been identified as a pullback resistance that lines up with the 38.2% Fibonacci retracement.
Pivot: 3,858.23
1st Support: 3,724.88
1st Resistance: 4,111.35
Disclaimer:
The above opinions given constitute general market commentary, and do not constitute the opinion or advice of IC Markets or any form of personal or investment advice.
Any opinions, news, research, analyses, prices, other information, or links to third-party sites contained on this website are provided on an "as-is" basis, are intended only to be informative, is not an advice nor a recommendation, nor research, or a record of our trading prices, or an offer of, or solicitation for a transaction in any financial instrument and thus should not be treated as such. The information provided does not involve any specific investment objectives, financial situation and needs of any specific person who may receive it. Please be aware, that past performance is not a reliable indicator of future performance and/or results. Past Performance or Forward-looking scenarios based upon the reasonable beliefs of the third-party provider are not a guarantee of future performance. Actual results may differ materially from those anticipated in forward-looking or past performance statements. IC Markets makes no representation or warranty and assumes no liability as to the accuracy or completeness of the information provided, nor any loss arising from any investment based on a recommendation, forecast or any information supplied by any third-party.

ETHEREUM HIGH PROBABILITY SETUP SOON!!!🚨 ETHER HIGH PROBABILITY BUY SETUP 🚨
* Here We Can See Clearly The Next Potential Moves For ETHUSD Coming Hours/Days.
* Keep Your Eyes Close On Your Trading Positions.
* Happy PIP Hunting Traders.
FXKILLA.

$ETH is trading around $4,000 after hitting the $4,800–5,000 $ CRYPTOCAP:ETH is trading around $4,000 after hitting the $4,800–5,000 resistance zone I mentioned in my last update. As expected, a short-term correction is playing out toward $3,500–$3,200, with possible extension to $3,100, where I’ll be looking to buy again. My bullish targets remain around $5,000 and $6,000, and I’ll share timely updates as the setup develops.

ETH Macro Picture, Pullback then $10k?CRYPTOCAP:ETH had a massive rally from the wave (II) bottom with a poke above all time high followed by extremely greedy sentiment on social and mainstream media of which I was warning should mark a local top and trap new investors.
Price has now pulled back to the first High Volume Node support target. I am expectinga deeper pullback over the next few weeks to complete wave (2) with an initial terminal target of the weekly pivot $3179 which is also the 0.382 Fibonacci retracement. That would be shallow for wave 2 which is expected in a wave III. However, the 0.5 Fibonacci retracement sits at the next major High Volume Node support where it is expected to meet the weekly 200EMA adding a lot of confluence to this are as the next bottom, $2660.
Any further downside bring up the S1 weekly pivot, golden pocket and high volume node, $2250.
There is weekly bearish divergence from the early 2024 highs.
I will play this trading plan point by point and look for longs at key levels to at least secure some bounce profits if not find a bottom.
Safe trading

ETH to 40k? 2020-21 Fractal PRESS PLAYWhy?
-meme stock mania redux
-stock market bottoms 6 months before economy (April bottom + 6 = October)
-wyckoff accumulation after sign of strength breakout
New
-deregulation of crypto
-staking of ETH ETFs
-RISC-V future, lighter.xyz, zero knowledge proofs
-layer 2 execution to offload retail flow
press play!
fib lines and PLAY idea inspired by @ScottScotty cheers!

Ethereum Beautiful RetestQuick Update :
- Remember what i always insist on :
" Resistances often tend to become supports, and supports often turn into resistances "
- You don’t need ten indicators to find the way, keep your chart simple. Indicators are just supplements, helping confirm when you already have a good chance of being right.
- The target for ETH remains unchanged, it could reach around 15,000 or even higher accordling to Fibonnacci.
Be Ready for Uptober
Happy Tr4Ding !

ETHUSD SELL NOW 3990🔻 ETHUSD Short Setup – Entry: 3990
Ethereum is facing resistance near 3990, presenting a clean intraday short opportunity. Key bearish signals:
- 🔸 Price rejection at prior supply zone
- 🔸 Bearish divergence on RSI (1H)
- 🔸 Lower high structure forming below 4030
- 🔸 Volume fading on recent push
📉 Trade Plan:
- Entry: 3990
- Stop Loss: 4030
- Take Profit: 3910
Risk/reward ratio: 1:2 – ideal for disciplined scalpers and short-term swing traders. Watch BTC correlation and macro headlines for volatility spikes.

ETHUSD Weekly Scenarios BullsWeekly Scenarios
Bulls
If ETH holds support at $4,200 and manages to rebound above the $4,500-4,600 resistance, we can expect a rally to $5,000 and beyond.
Sideways/Consolidation
The price may remain stuck in the $4,200-4,600 range until the market finds enough signal or volume to break out.
Bears
A breakout below $4,200 with volume confirmation will lead to a decline to $3,800 and below.

ascending channel/ eliots waveas everyone is panicing and calling a bear market its time to look into the higher time frame of ethereum.
Ethereum is since 9 april in an ascending channel making higher highs and higher lows.
we fineally reached the bottom of the channel and also the $4000 support zone, so double support.
Eliots wave theory: the eliots wave shows etherum has made its wave 1 with a 103% rally, wave 3 with a 130% rally, and wave 5 yet to start. as wave 5 is mostly a bigger run then wave 1 but wave 3 cannot be the shortest it means wave 5 would be a rally of around 104-129%.
INSTITUTIONAL INTEREST and RATE CUTS are also supporting our targets.
according to data on glassnote Ethereum mega-whales are accumulating ETH at their fastest pace in years.

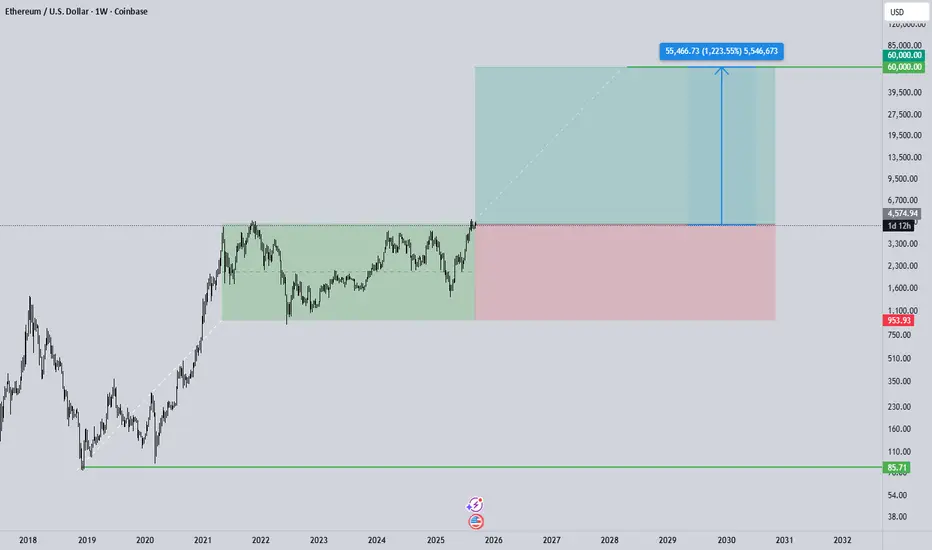
Ethereum Weekly Chart Outlook: Breakout Potential & 60K near!The weekly Ethereum chart shows that after years of consolidation within a broad range (green box), the price is now testing the upper boundary and attempting a breakout. Such behavior typically signals the start of a major bullish phase, provided the breakout is confirmed on the weekly close and the former resistance successfully turns into support. Based on projections, the first intermediate targets could be around 7.4k, 9–12k, and then 16k, while the long-term projection of 60k (+1200% from the current price) represents a highly optimistic multi-year scenario. On the other hand, if the breakout fails and price settles back below resistance, a return to the 1k region is possible. The reward-to-risk ratio of this trade, with a stop at 953 and a target of 60k, is exceptionally high (over 15:1), but the wide stop severely limits position size and demands strict risk management. Therefore, a secure entry should only follow a confirmed weekly close above resistance with a successful retest, and traders should plan for partial profit-taking at intermediate levels along the way.
$ethEth here in hot water.
$4400 demands respect and this handle has great potential to return it.
Giving a low end of $3900 which has recently come in and if is settled we will get this run.
So again, allow for $3900, track the closures and we’ll see how she goes.
🫣🫶🏽

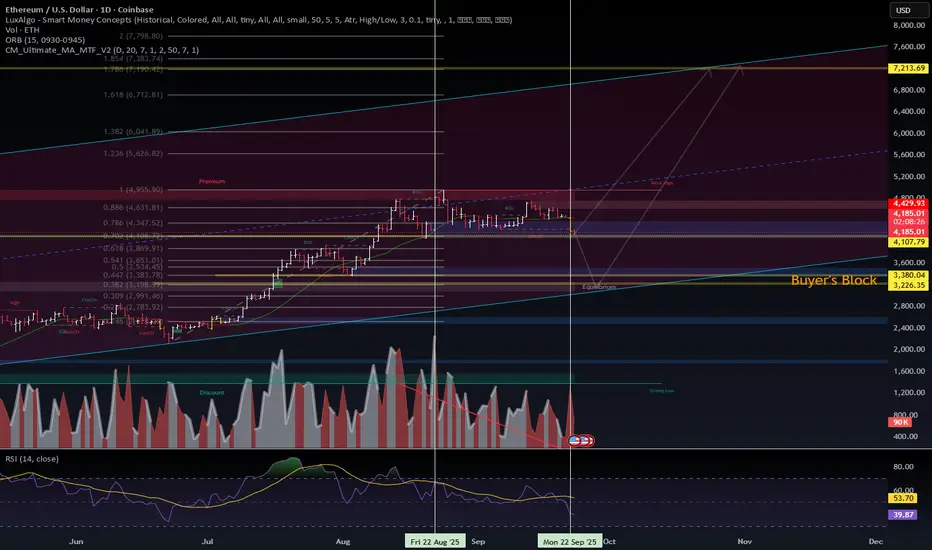
ETH-USD | Range Decision Point — Model vs. StructureETH-USD | Range Decision Point — Model vs. Structure
Ethereum is consolidating under the 0.786 ($4,347) supply band.
Chart (SMC levels): Daily support sits at $4,108. A clean break below exposes $3,895–$3,700, then the larger Buyer’s Block $3,380–$3,266.
Momentum: RSI at ~40 with selling volume dominance = downside bias until $4,347 is reclaimed.
Model (30-day forecast): Institutional ensemble issues a Strong Sell → target $3,895.5 (−7%), with a wide CI down to $3,193.
Game plan:
Bearish path: Daily close < $4,108 → look for $3,950 → $3,895.
Bullish path: Sweep/reclaim $4,108, then acceptance > $4,347 unlocks $4,520–$4,620.
Key Levels:
Bull trigger: >$4,347
Bear trigger: <$4,108
Near-term target: $3,895 (model alignment)
Long-term channel top: $7,713 (stretch target if buyers regain control)
Not financial advice. Educational mapping for VolanX DSS testing.
Zoom out and you'll find peaceIf you zoom out it looks like we are still in an uptrend.
Or am I drawing lines to calm myself down? 😜

Entry Point: Sell at 4180 **Trade Setup**
Entry Point: Sell at 4180
Stop Loss: Set your stop loss just above the resistance level at approximately 4210 to minimize risk
Take Profit: Aim for a profit target around 4000, where previous support levels have formed.
**Timeframe**
This setup is ideal for short to medium-term traders. Monitor for changes in market sentiment.
**Conclusion**
As Ethereum approaches the 4180 level with bearish signals, this could present a selling opportunity. Be sure to manage your risk and adjust your strategy based on market developments.
Good luck and trade wisely!

ETH: Short-Term Retracement, Long-Term BullishAfter a strong upward rally, ETH’s price is currently in a phase of retracement and consolidation. Short-term upward momentum has weakened somewhat, leaving it under pressure to pull back. However, the MA20 and MA60 continue to maintain a solid upward trend, providing medium-term support for the price. That said, the MACD histogram has shown short-term contraction, indicating a slowdown in the upward momentum.
Overall, ETH’s price action today is characterized by short-term retracement but sustained upward potential in the medium to long term.
Nevertheless, the cryptocurrency market is highly volatile, so investors should closely monitor market developments and relevant news to adjust their investment strategies in a timely manner

ETHUSD H4 | Falling towards pullback supportEthereum (ETH/USD) is falling towards the buy entry at 3,895.02, which is a pullback support that is slightly above the 38.2% Fibonacci retracement and could bounce from this level to the take profit.
Stop loss is at 3,551.04, which is a pullback support that aligns with the 50% Fibonacci retracement.
Take profit is at 4,386.55, which is a pullback resistance.
High Risk Investment Warning
Trading Forex/CFDs on margin carries a high level of risk and may not be suitable for all investors. Leverage can work against you.
Stratos Markets Limited (tradu.com ):
CFDs are complex instruments and come with a high risk of losing money rapidly due to leverage. 65% of retail investor accounts lose money when trading CFDs with this provider. You should consider whether you understand how CFDs work and whether you can afford to take the high risk of losing your money.
Stratos Europe Ltd (tradu.com ):
CFDs are complex instruments and come with a high risk of losing money rapidly due to leverage. 66% of retail investor accounts lose money when trading CFDs with this provider. You should consider whether you understand how CFDs work and whether you can afford to take the high risk of losing your money.
Stratos Global LLC (tradu.com ):
Losses can exceed deposits.
Please be advised that the information presented on TradingView is provided to Tradu (‘Company’, ‘we’) by a third-party provider (‘TFA Global Pte Ltd’). Please be reminded that you are solely responsible for the trading decisions on your account. There is a very high degree of risk involved in trading. Any information and/or content is intended entirely for research, educational and informational purposes only and does not constitute investment or consultation advice or investment strategy. The information is not tailored to the investment needs of any specific person and therefore does not involve a consideration of any of the investment objectives, financial situation or needs of any viewer that may receive it. Kindly also note that past performance is not a reliable indicator of future results. Actual results may differ materially from those anticipated in forward-looking or past performance statements. We assume no liability as to the accuracy or completeness of any of the information and/or content provided herein and the Company cannot be held responsible for any omission, mistake nor for any loss or damage including without limitation to any loss of profit which may arise from reliance on any information supplied by TFA Global Pte Ltd.
The speaker(s) is neither an employee, agent nor representative of Tradu and is therefore acting independently. The opinions given are their own, constitute general market commentary, and do not constitute the opinion or advice of Tradu or any form of personal or investment advice. Tradu neither endorses nor guarantees offerings of third-party speakers, nor is Tradu responsible for the content, veracity or opinions of third-party speakers, presenters or participants.
